Click here for the BAT GCN circular template
Image
Pre-slew 15-350 keV image (Event data; bkg subtracted)

#   RAcent  DECcent POSerr  Theta    Phi     Peak Cts     SNR  Name
  264.1212 -27.3172 0.0440    3.5  -47.7       0.3879     4.3  TRIG_00501485
------------------------------------------

Foreground time interval of the image:
  0.000  49.210 (delta_t =  49.210 [sec])
 50.000  64.000 (delta_t =  14.000 [sec])
Background time interval of the image:
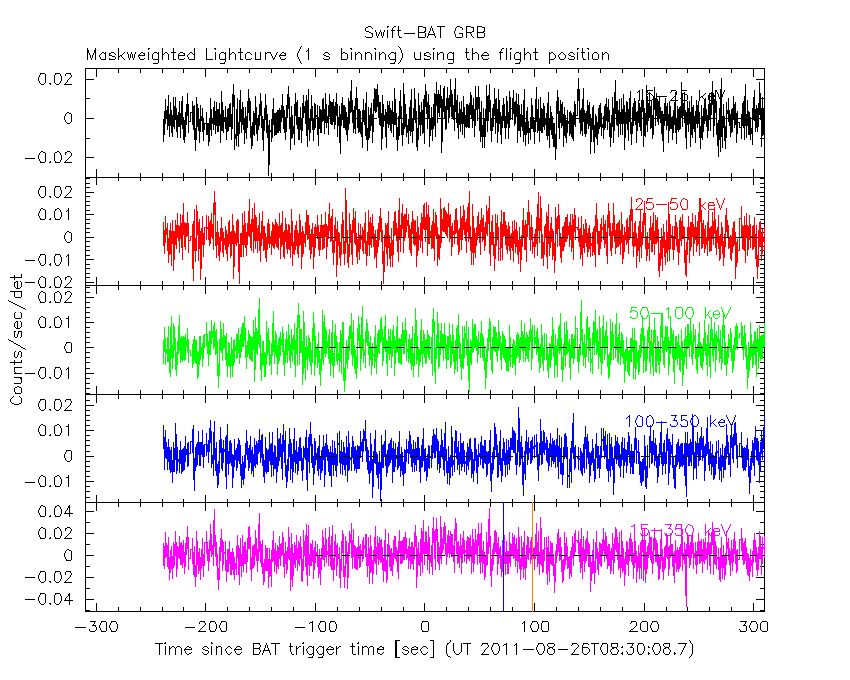
Lightcurves
Notes:
- 1) All plots contain as much data as has been downloaded to date.
- 2) The mask-weighted light curves are using the flight position.
- 3) Multiple plots of different time binning/intervals are shown to cover all scenarios of short/long GRBs, rate/image triggers, and real/false positives.
- 4) For all the mask-weighted lightcurves, the y-axis units are counts/sec/det where a det is 0.4 x 0.4 = 0.16 sq cm.
- 5) The verticle lines correspond to following: green dotted lines are T50 interval, black dotted lines are T90 interval, blue solid line(s) is a spacecraft slew start time, and orange solid line(s) is a spacecraft slew end time.
- 6) Time of each bin is in the middle of the bin.
1 s binning
From T0-310 s to T0+310 s
From T100_start - 20 s to T100_end + 30 s

Full time interval

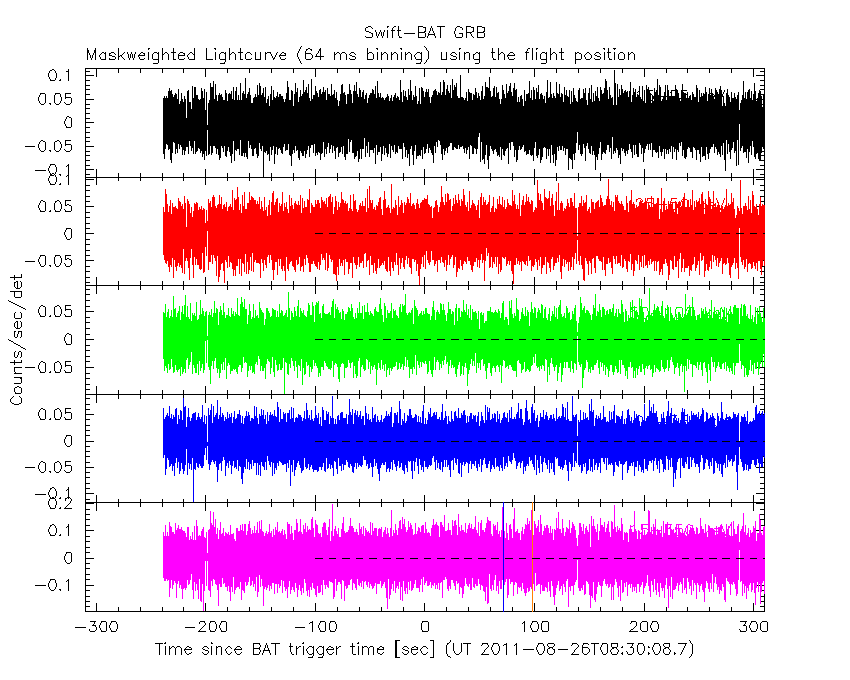
64 ms binning
Full time interval
From T100_start to T100_end
From T0-5 sec to T0+5 sec

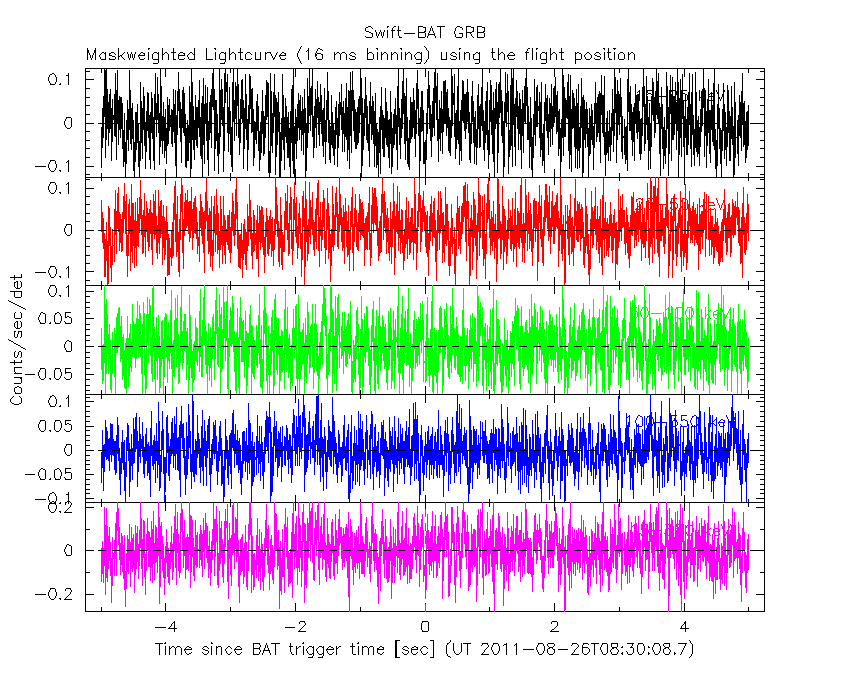
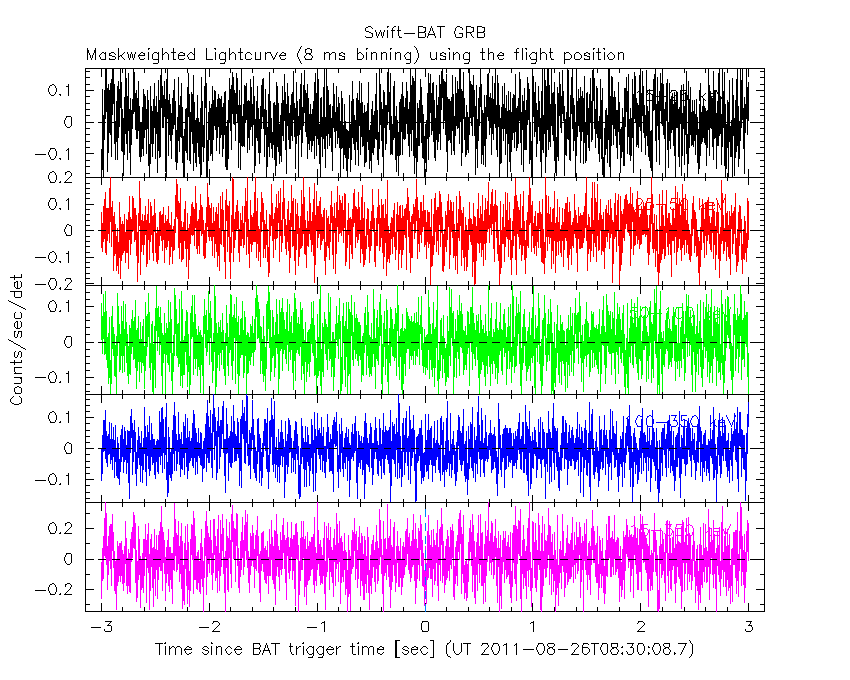
16 ms binning
From T100_start-5 s to T100_start+5 s
Blue+Cyan dotted lines: Time interval of the scaled map
From 0.000000 to 64.000000
8 ms binning
From T100_start-3 s to T100_start+3 s
Blue+Cyan dotted lines: Time interval of the scaled map
From 0.000000 to 64.000000
2 ms binning
From T100_start-1 s to T100_start+1 s

Blue+Cyan dotted lines: Time interval of the scaled map
From 0.000000 to 64.000000
SN=5 or 10 sec. binning (whichever binning is satisfied first)
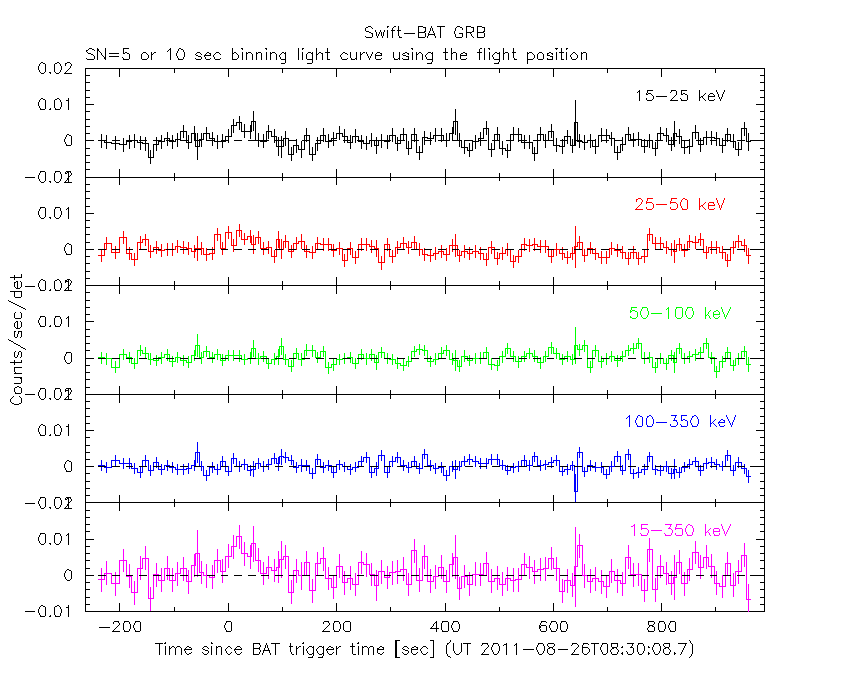
SN=5 or 10 sec. binning (T < 200 sec)

The mask-weighted light curves based on cleaned DPHs

Spectra
Notes:
- 1) The fitting includes the systematic errors.
- 2) For long bursts, a spectral fit of the pre-slew DRM will introduce some errors in both a spectral shape and a normalization if the PHA file contains a lot of the slew/post-slew time interval.
- 3) For fits to more complicated models (e.g. a power-law over a cutoff power-law), the BAT team has decided to require a chi-square improvement of more than 6 for each extra dof.
- 4) For short bursts (T90<1sec), the specrtum is also fit with Blackbody, OTTB, and Double Blackbody.
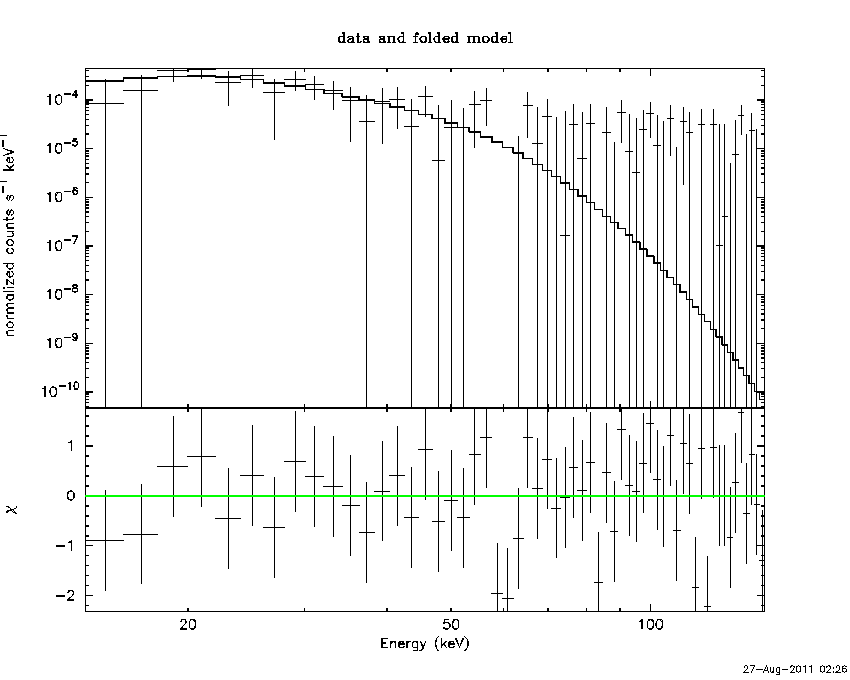
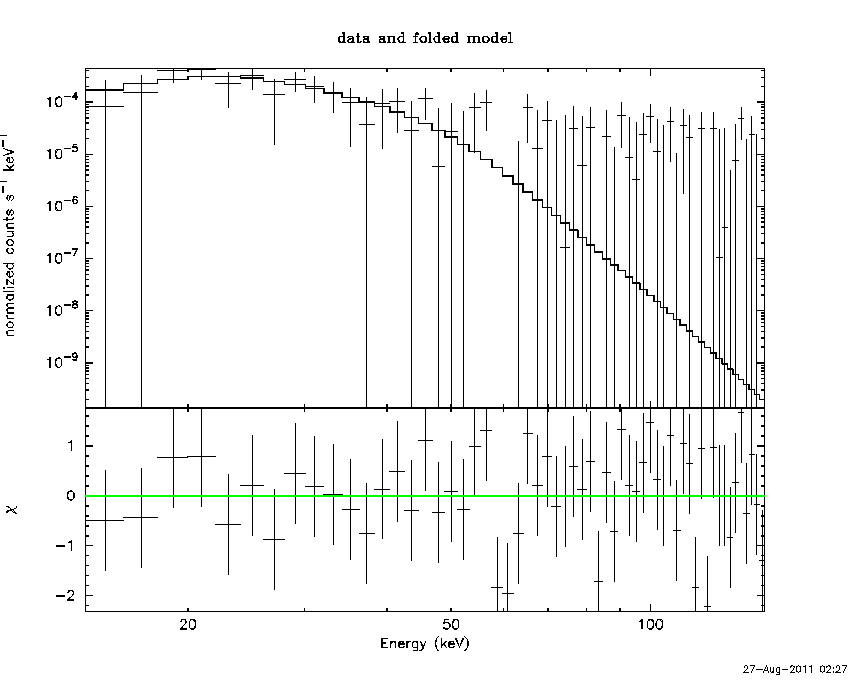
Time averaged spectrum fit using the pre-slew DRM
Power-law model

Multiple GTIs in the spectrum
tstart tstop
0.000000 49.210000
50.000000 64.000000

Spectral model in power-law:
------------------------------------------------------------
Parameters  : value       lower 90%   higher 90%
Photon index: 2.27690     ( -0.518346   0.603506 )
Norm@50keV  : 3.00048E-04    ( -0.000127572   0.000130351 )
------------------------------------------------------------
# Chi-Squared =          52.80 using 59 PHA bins.
# Reduced chi-squared =         0.9262 for     57 degrees of freedom
# Null hypothesis probability =   6.334541e-01

Photon flux (15-150 keV)    in 63.21 sec: 5.17673E-02 ( -0.0150574  0.0150871 ) ph/cm2/s
Energy fluence (15-150 keV)             : 1.80398e-07 ( -6.30402e-08  7.0031e-08 ) ergs/cm2
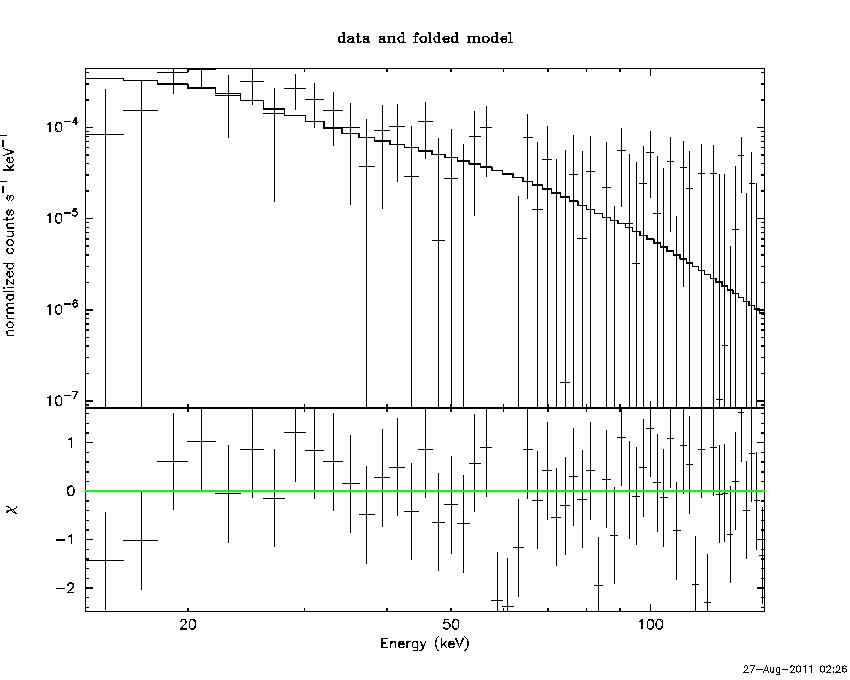
Cutoff power-law model

Multiple GTIs in the spectrum
tstart tstop
0.000000 49.210000
50.000000 64.000000
Spectral model in the cutoff power-law:
------------------------------------------------------------
Parameters  : value       lower 90%   higher 90%
Photon index: -4.76139     ( 3.44898   3.94805 )
Epeak [keV] : 28.3296      ( -5.56201 5.95468 )
Norm@50keV  : 23.3970    (     )
------------------------------------------------------------
# Chi-Squared =          46.78 using 59 PHA bins.
# Reduced chi-squared =         0.8354 for     56 degrees of freedom
# Null hypothesis probability =   8.050863e-01

Photon flux (15-150 keV)    in 63.21 sec: 4.87043E-02 ( -0.0138295  0.0140019 ) ph/cm2/s
Energy fluence (15-150 keV)             : 1.32889e-07 ( -3.93141e-08  4.38551e-08 ) ergs/cm2
Band function

Multiple GTIs in the spectrum
tstart tstop
0.000000 49.210000
50.000000 64.000000

Spectral model in the Band function:
------------------------------------------------------------
Parameters  : value       lower 90%   higher 90%
alpha       : 4.94271   ( -45.2772   -35.3242 )
beta        : -9.37023    ( 9.99772   19.9906 )
Epeak [keV] : 28.3679      ( -4.56119 5.28946 )
Norm@50keV   : 31.2373    ( -14.374   27.0311 )
------------------------------------------------------------
# Chi-Squared =          46.78 using 59 PHA bins.
# Reduced chi-squared =         0.8505 for     55 degrees of freedom
# Null hypothesis probability =   7.771203e-01

Photon flux (15-150 keV)    in 63.21 sec:  (    ) ph/cm2/s
Energy fluence (15-150 keV)             : 0 ( 0  0 ) ergs/cm2
Single BB
Spectral model blackbody:
------------------------------------------------------------
Parameters  : value    Lower 90%  Upper 90%
kT [keV]    : 7.18279  (-1.49201  1.92184)
R^2/D10^2   : 9.66996E-02  (-0.0611319   0.156423)
(R is the radius in km and D10 is the distance to the source in units of 10 kpc)
------------------------------------------------------------
# Chi-Squared =          47.57 using 59 PHA bins.
# Reduced chi-squared =         0.8345 for     57 degrees of freedom
# Null hypothesis probability =   8.089852e-01

Energy  Fluence     90% Error
[keV]   [erg/cm2]   [erg/cm2]
15- 25  5.199e-08   2.644e-08
25- 50  7.482e-08   4.510e-08
50-150  1.360e-08   1.054e-08
15-150  1.404e-07   8.552e-08
Thermal bremsstrahlung (OTTB)

Spectral model: thermal bremsstrahlung
------------------------------------------------------------
Parameters  : value         Lower 90%    Upper 90%
kT [keV]    : 33.1446       (-14.8155      41.7653)
Norm        : 0.392414       (-0.168284     0.30516)
------------------------------------------------------------
# Chi-Squared =          50.82 using 59 PHA bins.
# Reduced chi-squared =         0.8915 for     57 degrees of freedom
# Null hypothesis probability =   7.048946e-01

Energy  Fluence     90% Error
[keV]   [erg/cm2]   [erg/cm2]
15- 25  5.294e-08   2.551e-08
25- 50  6.377e-08   3.554e-08
50-150  3.965e-08   3.241e-08
15-150  1.564e-07   9.262e-08
Double BB

------------------------------------------------------------
Parameters  : value         Lower 90%    Upper 90%
kT1 [keV]   : 199.954        (      )
R1^2/D10^2  : 1.91185E-06        (-1.91082e-06      6.00218e-06)
kT2 [keV]   : 7.02629        (-7.02636      1.94074)
R2^2/D10^2  : 0.103926    (-0.0663065   0.172963)
------------------------------------------------------------
# Chi-Squared =          47.57 using 59 PHA bins.
# Chi-Squared =          47.25 using 59 PHA bins.
# Reduced chi-squared =         0.8649 for     55 degrees of freedom
# Reduced chi-squared =         0.8591 for     55 degrees of freedom
# Null hypothesis probability =   7.513747e-01
# Null hypothesis probability =   7.619013e-01

Energy  Fluence     90% Error
[keV]   [erg/cm2]   [erg/cm2]
15- 25  5.216e-08   2.470e-02
25- 50  7.466e-08   1.977e-01
50-150  1.346e-08   5.009e+00
15-150  1.403e-07   5.373e+00
Peak spectrum fit
Power-law model
Time interval is from   50.000 sec. to   64.000 sec.

Spectral model in power-law:
------------------------------------------------------------
Parameters  : value       lower 90%   higher 90%
Photon index: 2.27690     ( -0.518346   0.603506 )
Norm@50keV  : 3.00048E-04    ( -0.000127572   0.000130351 )
------------------------------------------------------------
# Chi-Squared =          52.80 using 59 PHA bins.
# Reduced chi-squared =         0.9262 for     57 degrees of freedom
# Null hypothesis probability =   6.334541e-01

Photon flux (15-150 keV)    in 63.21 sec: 5.17673E-02 ( -0.0150574  0.0150871 ) ph/cm2/s
Energy fluence (15-150 keV)             : 1.80398e-07 ( -6.30402e-08  7.0031e-08 ) ergs/cm2
Cutoff power-law model

Time interval is from   50.000 sec. to   64.000 sec.
Spectral model in the cutoff power-law:
------------------------------------------------------------
Parameters  : value       lower 90%   higher 90%
Photon index: -4.76139     ( 3.44898   3.94805 )
Epeak [keV] : 28.3296      ( -5.56201 5.95468 )
Norm@50keV  : 23.3970    (     )
------------------------------------------------------------
# Chi-Squared =          46.78 using 59 PHA bins.
# Reduced chi-squared =         0.8354 for     56 degrees of freedom
# Null hypothesis probability =   8.050863e-01

Photon flux (15-150 keV)    in 63.21 sec: 4.87043E-02 ( -0.0138295  0.0140019 ) ph/cm2/s
Energy fluence (15-150 keV)             : 1.32889e-07 ( -3.93141e-08  4.38551e-08 ) ergs/cm2
Band function
Time interval is from   50.000 sec. to   64.000 sec.

Spectral model in the Band function:
------------------------------------------------------------
Parameters  : value       lower 90%   higher 90%
alpha       : 4.94271   ( -45.3224   -35.3242 )
beta        : -9.37023    ( 9.99772   19.9906 )
Epeak [keV] : 28.3679      ( -4.56119 5.28946 )
Norm@50keV   : 31.2373    ( -14.374   27.0311 )
------------------------------------------------------------
# Chi-Squared =          46.78 using 59 PHA bins.
# Reduced chi-squared =         0.8505 for     55 degrees of freedom
# Null hypothesis probability =   7.771203e-01

Photon flux (15-150 keV)    in 63.21 sec:  (    ) ph/cm2/s
Energy fluence (15-150 keV)             : 0 ( 0  0 ) ergs/cm2
Single BB

Spectral model blackbody:
------------------------------------------------------------
Parameters  : value    Lower 90%  Upper 90%
kT [keV]    : 7.18279  (-1.49201  1.92184)
R^2/D10^2   : 9.66996E-02  (-0.0611319   0.156423)
(R is the radius in km and D10 is the distance to the source in units of 10 kpc)
------------------------------------------------------------
# Chi-Squared =          47.57 using 59 PHA bins.
# Reduced chi-squared =         0.8345 for     57 degrees of freedom
# Null hypothesis probability =   8.089852e-01

Energy  Fluence     90% Error
[keV]   [erg/cm2]   [erg/cm2]
15- 25  5.199e-08   3.095e-08
25- 50  7.482e-08   4.627e-08
50-150  1.360e-08   1.127e-08
15-150  1.404e-07   8.755e-08
Thermal bremsstrahlung (OTTB)

Spectral model: thermal bremsstrahlung
------------------------------------------------------------
Parameters  : value         Lower 90%    Upper 90%
kT [keV]    : 33.1446       (-14.8155      41.7653)
Norm        : 0.392414       (-0.168284     0.30516)
------------------------------------------------------------
# Chi-Squared =          50.82 using 59 PHA bins.
# Reduced chi-squared =         0.8915 for     57 degrees of freedom
# Null hypothesis probability =   7.048946e-01

Energy  Fluence     90% Error
[keV]   [erg/cm2]   [erg/cm2]
15- 25  5.294e-08   2.563e-08
25- 50  6.377e-08   3.820e-08
50-150  3.965e-08   3.373e-08
15-150  1.564e-07   8.763e-08
Double BB

------------------------------------------------------------
Parameters  : value         Lower 90%    Upper 90%
kT1 [keV]   : 199.954        (      )
R1^2/D10^2  : 1.91185E-06        (-1.91082e-06      6.00218e-06)
kT2 [keV]   : 7.02629        (-7.02636      1.94074)
R2^2/D10^2  : 0.103926    (-0.0663065   0.172963)
------------------------------------------------------------
# Chi-Squared =          47.57 using 59 PHA bins.
# Chi-Squared =          47.25 using 59 PHA bins.
# Reduced chi-squared =         0.8649 for     55 degrees of freedom
# Reduced chi-squared =         0.8591 for     55 degrees of freedom
# Null hypothesis probability =   7.513747e-01
# Null hypothesis probability =   7.619013e-01

Energy  Fluence     90% Error
[keV]   [erg/cm2]   [erg/cm2]
15- 25  5.216e-08   2.379e-02
25- 50  7.466e-08   1.856e-01
50-150  1.346e-08   4.491e+00
15-150  1.403e-07   5.019e+00
Pre-slew spectrum (Pre-slew PHA with pre-slew DRM)
Power-law model

Spectral model in power-law:
------------------------------------------------------------
Parameters  : value       lower 90%   higher 90%
Photon index: 2.27690     ( -0.518346   0.603506 )
Norm@50keV  : 3.00048E-04    ( -0.000127572   0.000130351 )
------------------------------------------------------------
# Chi-Squared =          52.80 using 59 PHA bins.
# Reduced chi-squared =         0.9262 for     57 degrees of freedom
# Null hypothesis probability =   6.334541e-01

Photon flux (15-150 keV)    in 63.21 sec: 5.17673E-02 ( -0.0150574  0.0150871 ) ph/cm2/s
Energy fluence (15-150 keV)             : 1.80398e-07 ( -6.30402e-08  7.0031e-08 ) ergs/cm2
Cutoff power-law model

Spectral model in the cutoff power-law:
------------------------------------------------------------
Parameters  : value       lower 90%   higher 90%
Photon index: -4.76139     ( 3.44898   3.94805 )
Epeak [keV] : 28.3296      ( -5.56201 5.95468 )
Norm@50keV  : 23.3970    (     )
------------------------------------------------------------
# Chi-Squared =          46.78 using 59 PHA bins.
# Reduced chi-squared =         0.8354 for     56 degrees of freedom
# Null hypothesis probability =   8.050863e-01

Photon flux (15-150 keV)    in 63.21 sec: 4.87043E-02 ( -0.0138295  0.0140019 ) ph/cm2/s
Energy fluence (15-150 keV)             : 1.32889e-07 ( -3.93141e-08  4.38551e-08 ) ergs/cm2
Band function

Spectral model in the Band function:
------------------------------------------------------------
Parameters  : value       lower 90%   higher 90%
alpha       : 4.94271   ( -45.3225   -35.3242 )
beta        : -9.37023    ( 9.99772   19.9906 )
Epeak [keV] : 28.3679      ( -4.56119 5.28946 )
Norm@50keV   : 31.2373    ( -14.374   27.0311 )
------------------------------------------------------------
# Chi-Squared =          46.78 using 59 PHA bins.
# Reduced chi-squared =         0.8505 for     55 degrees of freedom
# Null hypothesis probability =   7.771203e-01

Photon flux (15-150 keV)    in 63.21 sec:  (    ) ph/cm2/s
Energy fluence (15-150 keV)             : 0 ( 0  0 ) ergs/cm2
S(25-50 keV) vs. S(50-100 keV) plot

S(25-50 keV)  = 5.80257e-08
S(50-100 keV) = 4.78532e-08
T90 vs. Hardness ratio plot

T90                                   = 64 sec.
Hardness ratio (energy fluence ratio) = 0.82469
Color vs. Color plot

Count Ratio  (25-50 keV) / (15-25 keV) = 0.966352
Count Ratio (50-100 keV) / (15-25 keV) = 0.0878588
Mask shadow pattern
IMX = 4.162656584294525E-02, IMY = 4.574294596696297E-02
TIME vs. PHA plot around the trigger time

Blue+Cyan dotted lines: Time interval of the scaled map
From 0.000000 to 64.000000
TIME vs. DetID plot around the trigger time

Blue+Cyan dotted lines: Time interval of the scaled map
From 0.000000 to 64.000000
100 us light curve (15-350 keV)
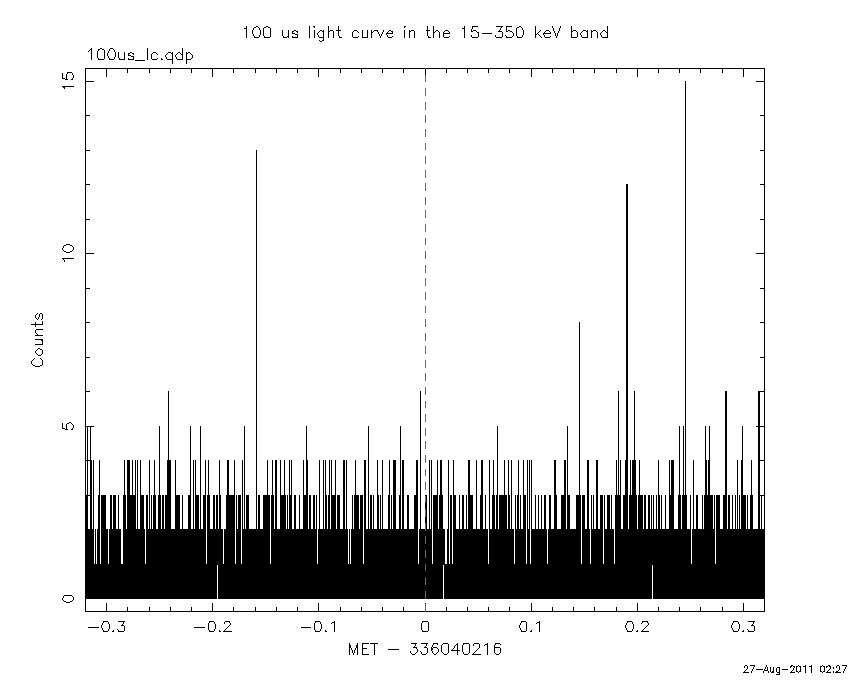
Blue+Cyan dotted lines: Time interval of the scaled map
From 0.000000 to 64.000000
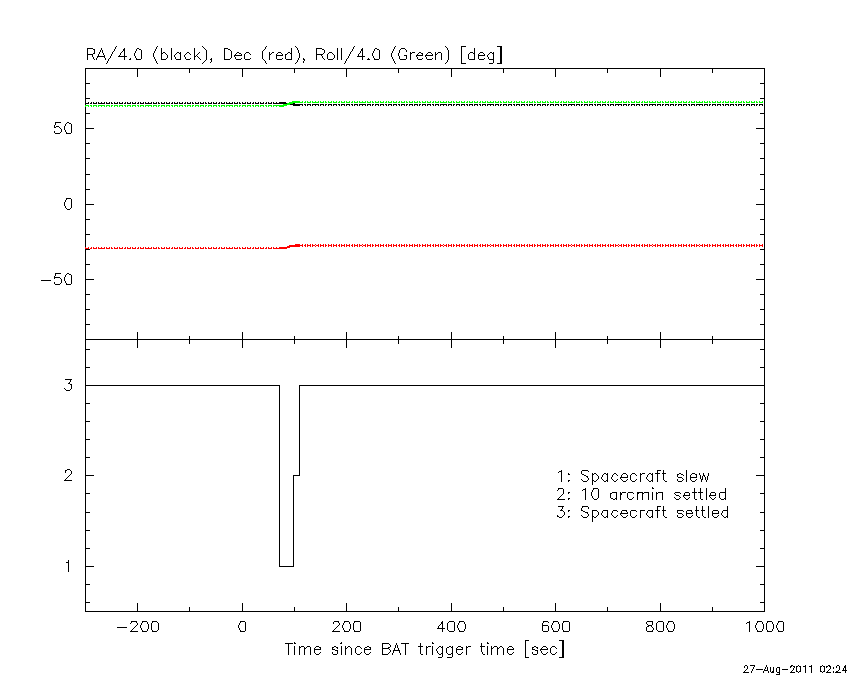
Spacecraft aspect plot
Bright source in the pre-burst/pre-slew/post-slew images
Pre-burst image of 15-350 keV band
Time interval of the image:
Pre-slew background subtracted image of 15-350 keV band
Time interval of the image:
0.000000 49.210000
50.000000 64.000000

# RAcent  DECcent POSerr Theta    Phi  PeakCts   SNR AngSep     Name
#  [deg]    [deg]    ['] [deg]  [deg]                   [']
244.9756 -15.6336    0.5  24.8  -52.3   2.4630  24.9    0.5	Sco X-1
256.0715 -37.8312    2.8  12.7 -125.9   0.3515   4.1    4.1	4U 1700-377
256.3297 -36.4600    4.4  11.8 -121.3   0.2263   2.6    5.6	GX 349+2
262.8329 -24.6149    8.7   6.2  -33.3   0.1148   1.3   12.4	GX 1+4
264.7070 -44.3082    3.9  15.2 -163.3   0.2417   2.9    8.6	4U 1735-44
268.4358  -1.3545    6.6  28.0   11.2   0.1807   1.7    7.2	SW J1753.5-0127
270.1346 -25.1697    4.3   4.8   39.8   0.2377   2.9    9.8	GX 5-1
270.1765 -25.6678    5.5   4.4   43.4   0.2248   2.7    8.2	GRS 1758-258
274.1872 -14.1544    0.0  16.4   32.9   0.1675   2.0   12.7	GX 17+2
275.7806 -30.4925    7.1   7.3  110.6  -0.1291  -1.6   10.6	H1820-303
285.1199 -24.9060    7.6  16.3   87.7   0.1521   1.5    4.6	HT1900.1-2455
288.7343  10.8921    3.0  45.1   39.3   1.1213   3.9    5.0	GRS 1915+105
269.7201   4.8130    2.6  34.2   13.2   0.4852   4.4 ------	UNKNOWN
250.1444  15.1024    2.5  47.4  -13.8   0.7339   4.7 ------	UNKNOWN
247.2337 -58.3321    2.2  32.2 -151.0   0.5154   5.1 ------	UNKNOWN
Post-slew image of 15-350 keV band
Time interval of the image:
97.900590 100.170000
101.000000 138.540000
140.000000 276.010000
277.000000 286.560000
288.000000 420.770000
421.000000 641.810000
643.000000 825.700000
827.000000 963.103600

# RAcent  DECcent POSerr Theta    Phi  PeakCts   SNR AngSep     Name
#  [deg]    [deg]    ['] [deg]  [deg]                   [']
244.9820 -15.6434    0.2  21.3  -61.0  30.4172  49.8    0.2	Sco X-1
255.9929 -37.8544    2.4  12.5 -149.3   2.4490   4.8    0.7	4U 1700-377
256.4900 -36.4716    2.1  11.2 -146.9   2.8595   5.6    3.9	GX 349+2
263.1717 -24.8733    7.7   2.6  -20.5   0.8837   1.5   11.7	GX 1+4
264.6125 -44.5998   14.0  17.2  178.5   0.3987   0.8   10.6	4U 1735-44
268.4543  -1.4869    2.7  26.2    9.3   2.4699   4.2    5.6	SW J1753.5-0127
270.1921 -25.0350    3.5   5.9   67.5   1.5627   3.4    5.7	GX 5-1
270.3817 -25.8447    4.4   5.8   75.6   1.2470   2.6    7.4	GRS 1758-258
273.9556 -14.0356    2.5  16.2   35.9   2.5445   4.6    2.9	GX 17+2
275.9032 -30.2625    3.5  10.7  108.0   1.7042   3.3    6.4	H1820-303
285.0716 -24.7721    4.2  18.9   86.4   1.6721   2.8    9.1	HT1900.1-2455
288.8280  10.9370    1.5  45.2   34.8  10.8366   7.5    1.8	GRS 1915+105
315.9607 -49.0816    3.7  45.0  132.8   7.7647   3.2 ------	UNKNOWN
277.3997 -23.7986    2.2  12.4   75.8   2.9521   5.3 ------	UNKNOWN
278.4159 -81.4522    4.5  54.4  176.9   6.1552   2.6 ------	UNKNOWN
243.1509 -52.4674    1.8  29.6 -154.2   3.5521   6.3 ------	UNKNOWN
255.4103  29.5264    2.8  57.5   -9.5  10.3701   4.1 ------	UNKNOWN
208.7714 -78.4200    2.6  56.5 -169.1  10.1468   4.5 ------	UNKNOWN
241.3289 -40.5445    2.0  23.0 -131.4   2.8142   5.8 ------	UNKNOWN
Plot creation:
Sat Aug 27 02:27:56 EDT 2011