Click here for the BAT GCN circular template
Image
Pre-slew 15.0-350.0 keV image (Event data)
#   RAcent    DECcent   POSerr    Theta     Phi              Peak Cts       SNR   Name
  310.8277    -0.7161   0.0086    32.9944    81.8430         2.2833218     22.433 TRIG_00503219

Foreground time interval of the image:
 -4.884  10.925 (delta_t =  15.809 [sec])
Background time interval of the image:
-414.675 -398.746 (delta_t =  15.930 [sec])
-239.776  -4.884 (delta_t = 234.892 [sec])
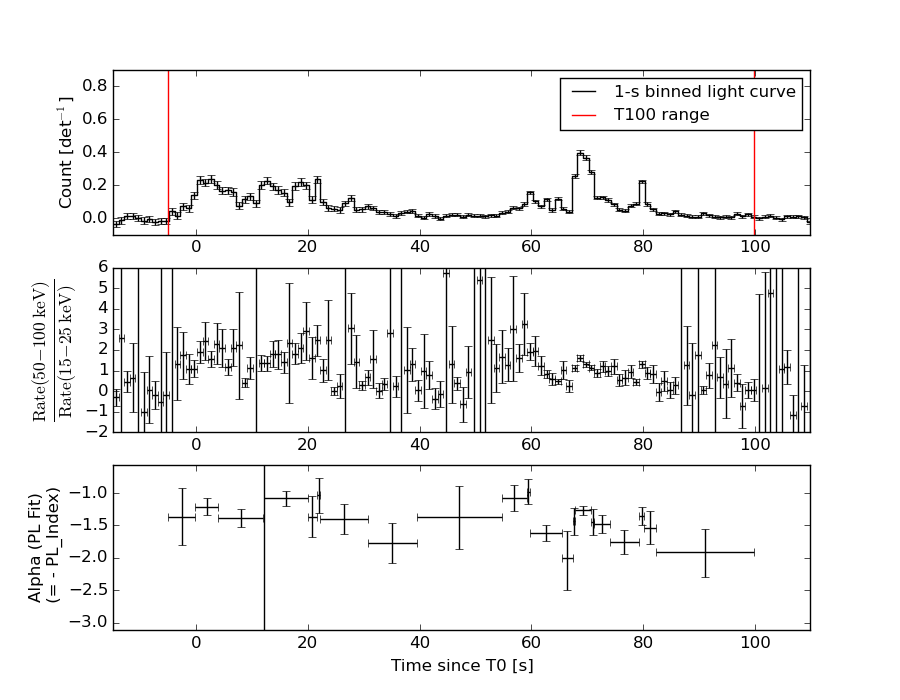
Lightcurves
Notes:
- 1) The mask-weighted light curves are using the flight position.
- 2) Multiple plots of different time binning/intervals are shown to cover all scenarios of short/long GRBs, rate/image triggers, and real/false positives.
- 3) For all the mask-weighted lightcurves, the y-axis units are counts/sec/det where a det is 0.4 x 0.4 = 0.16 sq cm.
- 4) The verticle lines correspond to following: green dotted lines are T50 interval, black dotted lines are T90 interval, blue solid line(s) is a spacecraft slew start time, and orange solid line(s) is a spacecraft slew end time.
- 5) Time of each bin is in the middle of the bin.
1 s binning
From T0-310 s to T0+310 s
From T100_start - 20 s to T100_end + 30 s
Full time interval

64 ms binning
Full time interval

From T100_start to T100_end
From T0-5 sec to T0+5 sec
16 ms binning
From T100_start-5 s to T100_start+5 s

Blue+Cyan dotted lines: Time interval of the scaled map
From 0.000000 to 1.024000
8 ms binning
From T100_start-3 s to T100_start+3 s

Blue+Cyan dotted lines: Time interval of the scaled map
From 0.000000 to 1.024000
2 ms binning
From T100_start-1 s to T100_start+1 s
Blue+Cyan dotted lines: Time interval of the scaled map
From 0.000000 to 1.024000
SN=5 or 10 sec. binning (whichever binning is satisfied first)
SN=5 or 10 sec. binning (T < 200 sec)
Quad-rate summed light curves (from T0-300s to T0+1000s)
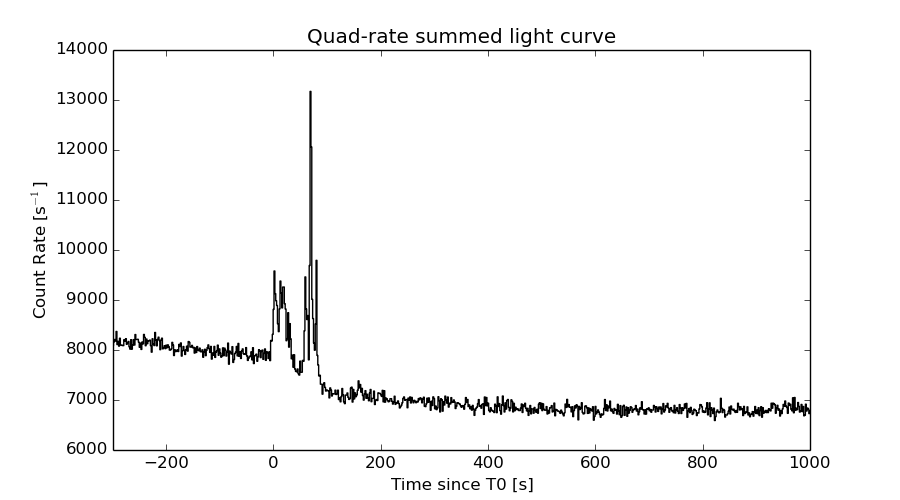
The mask-weighted light curves based on cleaned DPHs

Spectral Evolution
Spectra
Notes:
- 1) The fitting includes the systematic errors.
- 2) When the burst includes telescope slew time periods, the fitting uses an average response file made from multiple 5-s response files through out the slew time plus single time preiod for the non-slew times, and weighted by the total counts in the corresponding time period using addrmf. An average response file is needed becuase a spectral fit using the pre-slew DRM will introduce some errors in both a spectral shape and a normalization if the PHA file contains a lot of the slew/post-slew time interval.
- 3) For fits to more complicated models (e.g. a power-law over a cutoff power-law), the BAT team has decided to require a chi-square improvement of more than 6 for each extra dof.
Time averaged spectrum fit using the average DRM
Power-law model

Time interval is from   -4.884 sec. to   99.792 sec.

Spectral model in power-law:
------------------------------------------------------------
Parameters  : value       lower 90%   higher 90%
Photon index: 1.38617     ( -0.0534658   0.0533808 )
Norm@50keV  : 5.76658E-03    ( -0.000167168   0.000167167 )
------------------------------------------------------------
#Fit statistic : Chi-Squared =          73.06 using 59 PHA bins.
# Reduced chi-squared =          1.282 for     57 degrees of freedom
# Null hypothesis probability =   7.446894e-02

Photon flux (15-150 keV)    in 104.7 sec: 0.700090 ( -0.0219839  0.0220357 ) ph/cm2/s
Energy fluence (15-150 keV)             : 5.85068e-06 ( -1.80908e-07  1.81211e-07 ) ergs/cm2
Cutoff power-law model

Time interval is from   -4.884 sec. to   99.792 sec.
Spectral model in the cutoff power-law:
------------------------------------------------------------
Parameters  : value       lower 90%   higher 90%
Photon index: 0.979583     ( -0.229331   0.218081 )
Epeak [keV] : 138.238      ( -30.7882 91.7629 )
Norm@50keV  : 8.84714E-03    ( -0.00177124   0.00234102 )
------------------------------------------------------------
#Fit statistic : Chi-Squared =          62.52 using 59 PHA bins.
# Reduced chi-squared =          1.116 for     56 degrees of freedom
# Null hypothesis probability =   2.559859e-01

Photon flux (15-150 keV)    in 104.7 sec: 0.681478 ( -0.023858  0.023926 ) ph/cm2/s
Energy fluence (15-150 keV)             : 5.70126e-06 ( -2.00082e-07  1.99129e-07 ) ergs/cm2
Band function

Time interval is from   -4.884 sec. to   99.792 sec.

Spectral model in the Band function:
------------------------------------------------------------
Parameters  : value       lower 90%   higher 90%
alpha       : -0.978801   ( -0.200573   0.181292 )
beta        : -9.07059    ( 8.96033   18.9603 )
Epeak [keV] : 138.770      ( -18.0726 53.5243 )
Norm@50keV   : 8.83433E-03    ( -0.00104946   0.00132117 )
------------------------------------------------------------
#Fit statistic : Chi-Squared =          62.52 using 59 PHA bins.
# Reduced chi-squared =          1.137 for     55 degrees of freedom
# Null hypothesis probability =   2.267597e-01

Photon flux (15-150 keV)    in 104.7 sec:  (    ) ph/cm2/s
Energy fluence (15-150 keV)             : 0 ( 0  0 ) ergs/cm2
Single BB

Spectral model blackbody:
------------------------------------------------------------
Parameters  : value    Lower 90%  Upper 90%
kT [keV]    : 17.6698  (  )
R^2/D10^2   : 4.54251E-02  (   )
(R is the radius in km and D10 is the distance to the source in units of 10 kpc)
------------------------------------------------------------
#Fit statistic : Chi-Squared =         252.67 using 59 PHA bins.
# Reduced chi-squared =         4.4328 for     57 degrees of freedom
# Null hypothesis probability =   1.872493e-26

Energy  Fluence     90% Error
[keV]   [erg/cm2]   [erg/cm2]
15- 25  2.990e-07   1.717e-08
25- 50  1.364e-06   5.497e-08
50-150  3.075e-06   1.602e-07
15-150  4.738e-06   1.644e-07
Thermal bremsstrahlung (OTTB)

Spectral model: thermal bremsstrahlung
------------------------------------------------------------
Parameters  : value         Lower 90%    Upper 90%
kT [keV]    : 200.000       (      )
Norm        : 2.92814       (-0.0852406     0.0852119)
------------------------------------------------------------
#Fit statistic : Chi-Squared =          97.64 using 59 PHA bins.
# Reduced chi-squared =          1.713 for     57 degrees of freedom
# Null hypothesis probability =   6.518702e-04

Energy  Fluence     90% Error
[keV]   [erg/cm2]   [erg/cm2]
15- 25  7.634e-07   2.581e-08
25- 50  1.468e-06   4.502e-08
50-150  3.221e-06   1.063e-07
15-150  5.452e-06   1.769e-07
Double BB

Spectral model: bbodyrad<1> + bbodyrad<2>
------------------------------------------------------------
Parameters  : value         Lower 90%    Upper 90%
kT1 [keV]   : 7.75285        (-0.923437      1.01687)
R1^2/D10^2  : 0.433234        (-0.138876      0.227665)
kT2 [keV]   : 27.7074        (-2.66156      3.65067)
R2^2/D10^2  : 7.95721E-03    (-0.00286294   0.0036)
------------------------------------------------------------
#Fit statistic : Chi-Squared =          62.90 using 59 PHA bins.
# Reduced chi-squared =          1.144 for     55 degrees of freedom
# Null hypothesis probability =   2.168990e-01

Energy  Fluence     90% Error
[keV]   [erg/cm2]   [erg/cm2]
15- 25  5.861e-07   7.015e-08
25- 50  1.422e-06   1.063e-07
50-150  3.672e-06   3.774e-07
15-150  5.681e-06   3.937e-07
Peak spectrum fit
Power-law model

Time interval is from   68.040 sec. to   69.040 sec.

Spectral model in power-law:
------------------------------------------------------------
Parameters  : value       lower 90%   higher 90%
Photon index: 1.19585     ( -0.0915569   0.0910268 )
Norm@50keV  : 2.65235E-02    ( -0.00133959   0.00133959 )
------------------------------------------------------------
#Fit statistic : Chi-Squared =          52.17 using 59 PHA bins.
# Reduced chi-squared =         0.9153 for     57 degrees of freedom
# Null hypothesis probability =   6.564716e-01

Photon flux (15-150 keV)    in 1 sec: 3.11151 ( -0.162031  0.162214 ) ph/cm2/s
Energy fluence (15-150 keV)             : 2.69408e-07 ( -1.52365e-08  1.53007e-08 ) ergs/cm2
Cutoff power-law model

Time interval is from   68.040 sec. to   69.040 sec.
Spectral model in the cutoff power-law:
------------------------------------------------------------
Parameters  : value       lower 90%   higher 90%
Photon index: 1.09538     ( -0.357265   0.144135 )
Epeak [keV] : 491.384      ( -492.019 -492.019 )
Norm@50keV  : 2.95609E-02    ( -0.00410515   0.0133982 )
------------------------------------------------------------
#Fit statistic : Chi-Squared =          51.91 using 59 PHA bins.
# Reduced chi-squared =         0.9270 for     56 degrees of freedom
# Null hypothesis probability =   6.302821e-01

Photon flux (15-150 keV)    in 1 sec: 3.09612 ( -0.16958  0.16945 ) ph/cm2/s
Energy fluence (15-150 keV)             : 2.67788e-07 ( -1.6459e-08  8.179e-09 ) ergs/cm2
Band function

Time interval is from   68.040 sec. to   69.040 sec.

Spectral model in the Band function:
------------------------------------------------------------
Parameters  : value       lower 90%   higher 90%
alpha       : -0.982611   ( 0.829526   0.829526 )
beta        : -1.26970    ( 1.28525   0.175049 )
Epeak [keV] : 224.209      ( -208.289 -208.289 )
Norm@50keV   : 3.41516E-02    ( -0.00872001   0 )
------------------------------------------------------------
#Fit statistic : Chi-Squared =          51.71 using 59 PHA bins.
# Reduced chi-squared =         0.9402 for     55 degrees of freedom
# Null hypothesis probability =   6.010876e-01

Photon flux (15-150 keV)    in 1 sec:  (    ) ph/cm2/s
Energy fluence (15-150 keV)             : 0 ( 0  0 ) ergs/cm2
Single BB

Spectral model blackbody:
------------------------------------------------------------
Parameters  : value    Lower 90%  Upper 90%
kT [keV]    : 18.8652  (  )
R^2/D10^2   : 0.170673  (   )
(R is the radius in km and D10 is the distance to the source in units of 10 kpc)
------------------------------------------------------------
#Fit statistic : Chi-Squared =         131.51 using 59 PHA bins.
# Reduced chi-squared =         2.3072 for     57 degrees of freedom
# Null hypothesis probability =   8.042400e-08

Energy  Fluence     90% Error
[keV]   [erg/cm2]   [erg/cm2]
15- 25  1.197e-08   1.140e-09
25- 50  5.728e-08   4.285e-09
50-150  1.496e-07   1.300e-08
15-150  2.189e-07   1.420e-08
Thermal bremsstrahlung (OTTB)

Spectral model: thermal bremsstrahlung
------------------------------------------------------------
Parameters  : value         Lower 90%    Upper 90%
kT [keV]    : 200.000       (      )
Norm        : 12.8486       (-0.662481     0.662386)
------------------------------------------------------------
#Fit statistic : Chi-Squared =          94.42 using 59 PHA bins.
# Reduced chi-squared =          1.657 for     57 degrees of freedom
# Null hypothesis probability =   1.344970e-03

Energy  Fluence     90% Error
[keV]   [erg/cm2]   [erg/cm2]
15- 25  3.200e-08   1.895e-09
25- 50  6.156e-08   3.635e-09
50-150  1.350e-07   8.600e-09
15-150  2.286e-07   1.915e-08
Double BB

Spectral model: bbodyrad<1> + bbodyrad<2>
------------------------------------------------------------
Parameters  : value         Lower 90%    Upper 90%
kT1 [keV]   : 8.55697        (-1.99247      2.11656)
R1^2/D10^2  : 1.37903        (-0.638892      1.77205)
kT2 [keV]   : 34.9363        (-7.44805      15.8943)
R2^2/D10^2  : 1.93561E-02    (-0.0128911   0.0138603)
------------------------------------------------------------
#Fit statistic : Chi-Squared =          56.77 using 59 PHA bins.
# Reduced chi-squared =          1.032 for     55 degrees of freedom
# Null hypothesis probability =   4.088332e-01

Energy  Fluence     90% Error
[keV]   [erg/cm2]   [erg/cm2]
15- 25  2.246e-08   4.335e-09
25- 50  5.935e-08   1.018e-08
50-150  1.872e-07   5.789e-08
15-150  2.690e-07   6.200e-08
Pre-slew spectrum (Pre-slew PHA with pre-slew DRM)
Power-law model
Spectral model in power-law:
------------------------------------------------------------
Parameters  : value       lower 90%   higher 90%
Photon index: 1.31452     ( -0.106126   0.105481 )
Norm@50keV  : 9.34868E-03    ( -0.000587616   0.000587604 )
------------------------------------------------------------
#Fit statistic : Chi-Squared =          61.45 using 59 PHA bins.
# Reduced chi-squared =          1.078 for     57 degrees of freedom
# Null hypothesis probability =   3.198032e-01

Photon flux (15-150 keV)    in 15.81 sec: 1.11837 ( -0.0733807  0.0735093 ) ph/cm2/s
Energy fluence (15-150 keV)             : 1.45545e-06 ( -9.88977e-08  9.92814e-08 ) ergs/cm2
Cutoff power-law model
Spectral model in the cutoff power-law:
------------------------------------------------------------
Parameters  : value       lower 90%   higher 90%
Photon index: 0.455757     ( -0.507013   0.4539 )
Epeak [keV] : 96.2258      ( -18.0328 47.711 )
Norm@50keV  : 2.38578E-02    ( -0.00912147   0.0167786 )
------------------------------------------------------------
#Fit statistic : Chi-Squared =          50.03 using 59 PHA bins.
# Reduced chi-squared =         0.8934 for     56 degrees of freedom
# Null hypothesis probability =   6.990438e-01

Photon flux (15-150 keV)    in 15.81 sec: 1.07594 ( -0.07649  0.07661 ) ph/cm2/s
Energy fluence (15-150 keV)             : 1.38511e-06 ( -1.06814e-07  1.06934e-07 ) ergs/cm2
Band function

Spectral model in the Band function:
------------------------------------------------------------
Parameters  : value       lower 90%   higher 90%
alpha       : -0.455679   ( -0.37104   0.417493 )
beta        : -10.0000    ( 10   3.55271e-15 )
Epeak [keV] : 96.2089      ( -13.045 47.7081 )
Norm@50keV   : 2.38599E-02    ( -0.00910193   0.0167964 )
------------------------------------------------------------
#Fit statistic : Chi-Squared =          50.03 using 59 PHA bins.
# Reduced chi-squared =         0.9097 for     55 degrees of freedom
# Null hypothesis probability =   6.644377e-01

Photon flux (15-150 keV)    in 15.81 sec: 1.08389 (    ) ph/cm2/s
Energy fluence (15-150 keV)             : 1.38875e-06 ( 0  0 ) ergs/cm2
S(25-50 keV) vs. S(50-100 keV) plot
S(25-50 keV)  = 1.37e-06
S(50-100 keV) = 2.09e-06
T90 vs. Hardness ratio plot

T90                                   = 79.5679998993874 sec.
Hardness ratio (energy fluence ratio) = 1.52555
Color vs. Color plot

Count Ratio  (25-50 keV) / (15-25 keV) = 1.5237
Count Ratio (50-100 keV) / (15-25 keV) = 1.29902
Mask shadow pattern
IMX = 9.212154169850038E-02, IMY = -6.426994306230007E-01
TIME vs. PHA plot around the trigger time

Blue+Cyan dotted lines: Time interval of the scaled map
From 0.000000 to 1.024000
TIME vs. DetID plot around the trigger time

Blue+Cyan dotted lines: Time interval of the scaled map
From 0.000000 to 1.024000
100 us light curve (15-350 keV)
Blue+Cyan dotted lines: Time interval of the scaled map
From 0.000000 to 1.024000
Spacecraft aspect plot

Bright source in the pre-burst/pre-slew/post-slew images
Pre-burst image of 15-350 keV band
Time interval of the image:
-414.675400 -398.745800
-239.776000 -4.884000

# RAcent  DECcent POSerr Theta    Phi  PeakCts   SNR AngSep     Name
#  [deg]    [deg]    ['] [deg]  [deg]                   [']
244.9889 -15.6612    0.5  33.6 -101.0   7.9553  22.3    1.4	Sco X-1
254.5877  35.3196   16.5  49.6  -21.7  -0.2960  -0.7    6.5	Her X-1
256.0322 -37.8454   16.0  35.5 -144.2   0.1897   0.7    2.2	4U 1700-377
256.3969 -36.2965    4.2  34.2 -142.8   0.6652   2.7    7.8	GX 349+2
263.0639 -24.8926    6.8  22.0 -135.0   0.3512   1.7    9.3	GX 1+4
264.8158 -44.4396    7.7  37.7 -159.5   0.3942   1.5    3.2	4U 1735-44
268.2770  -1.5187    3.2  12.6  -51.4   0.6682   3.6    6.8	SW J1753.5-0127
270.3530 -25.0291    1.9  18.1 -150.8   1.1915   6.2    4.8	GX 5-1
270.3231 -25.6406    5.7  18.7 -151.6   0.4207   2.1    6.2	GRS 1758-258
274.0869 -13.8825    6.6   6.8 -134.8   0.3211   1.7   10.4	GX 17+2
275.8990 -30.2706    7.3  21.7 -169.2   0.3131   1.6    5.9	H1820-303
285.0790 -24.9581    7.4  17.3  164.4   0.3415   1.6    3.2	HT1900.1-2455
288.7985  10.9412    1.0  22.1   31.4   2.5201  11.6    0.3	GRS 1915+105
299.6388  35.1516    5.0  48.2   27.3   1.6365   2.3    3.8	Cyg X-1
262.9086 -33.7852    4.9  28.9 -147.9   0.4755   2.4    5.0	GX 354-0
318.6070 -36.5411    3.2  45.6  138.0   2.7992   3.6 ------	UNKNOWN
283.1147 -43.6548    2.8  35.1  178.6   1.0385   4.2 ------	UNKNOWN
273.0358  21.6521    2.8  30.9   -6.1   0.9476   4.2 ------	UNKNOWN
236.5852 -48.7102    2.8  53.3 -142.3   4.8006   4.0 ------	UNKNOWN
Pre-slew background subtracted image of 15-350 keV band
Time interval of the image:
-4.884000 10.924610

# RAcent  DECcent POSerr Theta    Phi  PeakCts   SNR AngSep     Name
#  [deg]    [deg]    ['] [deg]  [deg]                   [']
244.9528 -15.7493   42.1  33.7 -101.1   0.0205   0.3    6.7	Sco X-1
254.5877  35.3194   14.2  49.6  -21.7   0.0773   0.8    6.5	Her X-1
256.1082 -37.7258    4.9  35.4 -144.2   0.1356   2.3    9.1	4U 1700-377
256.4168 -36.5638    5.8  34.4 -143.2   0.1112   2.0    8.5	GX 349+2
262.9550 -24.8882    7.6  22.0 -134.8  -0.0695  -1.5    9.0	GX 1+4
264.9252 -44.6120    0.0  37.8 -159.7   0.1475   2.6   12.5	4U 1735-44
268.2131  -1.3152    0.0  12.8  -50.8   0.0451   1.1   12.4	SW J1753.5-0127
270.2745 -25.2275    4.4  18.3 -150.9   0.1122   2.7    8.9	GX 5-1
270.4625 -25.7442    4.1  18.7 -152.1   0.1318   3.1    8.6	GRS 1758-258
274.1513 -13.8960   33.3   6.8 -135.3  -0.0147  -0.3   11.9	GX 17+2
275.9188 -30.4533    5.9  21.8 -169.4  -0.0861  -2.0    5.2	H1820-303
285.1197 -24.8485   44.4  17.2  164.1  -0.0115  -0.3    6.3	HT1900.1-2455
288.7347  10.8380    5.3  22.0   31.4  -0.1067  -2.2    7.5	GRS 1915+105
299.4768  35.0738    0.0  48.0   27.2   0.4571   2.9    9.5	Cyg X-1
262.8407 -33.6835   23.6  28.9 -147.7  -0.0237  -0.5   11.7	GX 354-0
313.4288 -10.8628    2.8  34.3  100.7   0.4153   4.2 ------	UNKNOWN
310.8277  -0.7161    0.5  33.0   81.8   2.2833  22.4 ------	UNKNOWN
235.9632 -46.4358    2.1  52.4 -139.6   1.2068   5.6 ------	UNKNOWN
236.5813 -27.2293    2.3  43.8 -116.3   0.9107   5.1 ------	UNKNOWN
Post-slew image of 15-350 keV band
Time interval of the image:
65.324620 962.343100

# RAcent  DECcent POSerr Theta    Phi  PeakCts   SNR AngSep     Name
#  [deg]    [deg]    ['] [deg]  [deg]                   [']
270.3033 -25.1124    5.5  46.1 -128.8   3.2340   2.1    2.3	GX 5-1
270.1655 -25.5821   82.8  46.4 -129.3  -0.2314  -0.1   12.2	GRS 1758-258
274.0909 -14.1855    8.4  38.8 -115.6  -1.4233  -1.4   10.2	GX 17+2
276.0317 -30.3227    5.8  44.4 -138.7   1.8734   2.0    6.1	H1820-303
285.0902 -25.0028    3.3  34.8 -139.9   1.9416   3.5    5.7	HT1900.1-2455
288.8066  10.9551    0.9  24.8  -64.9   6.8805  12.3    0.8	GRS 1915+105
299.6237  35.2268    1.9  37.4  -18.7   3.2763   6.0    2.2	Cyg X-1
308.0940  40.9568    1.7  41.7   -6.7   4.5830   6.6    0.8	Cyg X-3
326.1258  38.4374    4.6  41.6   14.6   1.8646   2.5    7.3	Cyg X-2
344.2689  10.2047    3.0  35.0   67.4   4.3312   3.8 ------	UNKNOWN
341.1425  35.7567    3.3  46.1   31.1   4.5307   3.5 ------	UNKNOWN
313.1320 -18.9295    2.6  18.4  169.5   1.8011   4.4 ------	UNKNOWN
310.8196  -0.7528    1.4   0.0 -162.4   3.5420   8.3 ------	UNKNOWN
307.8151   8.1086    2.8   9.3  -22.3   1.6485   4.2 ------	UNKNOWN
285.1379   0.6280    2.9  25.7  -90.6   2.1925   4.0 ------	UNKNOWN
284.3243  46.5150    2.8  52.6  -26.3   4.9201   4.1 ------	UNKNOWN
270.7558 -45.2307    3.5  56.8 -150.7   8.6163   3.3 ------	UNKNOWN
269.6757  -4.4598    3.5  41.3  -99.5   7.9320   3.3 ------	UNKNOWN
Plot creation:
Sat May 30 21:36:43 EDT 2015