Click here for the BAT GCN circular template
Image
Pre-slew 15.0-350.0 keV image (Event data)
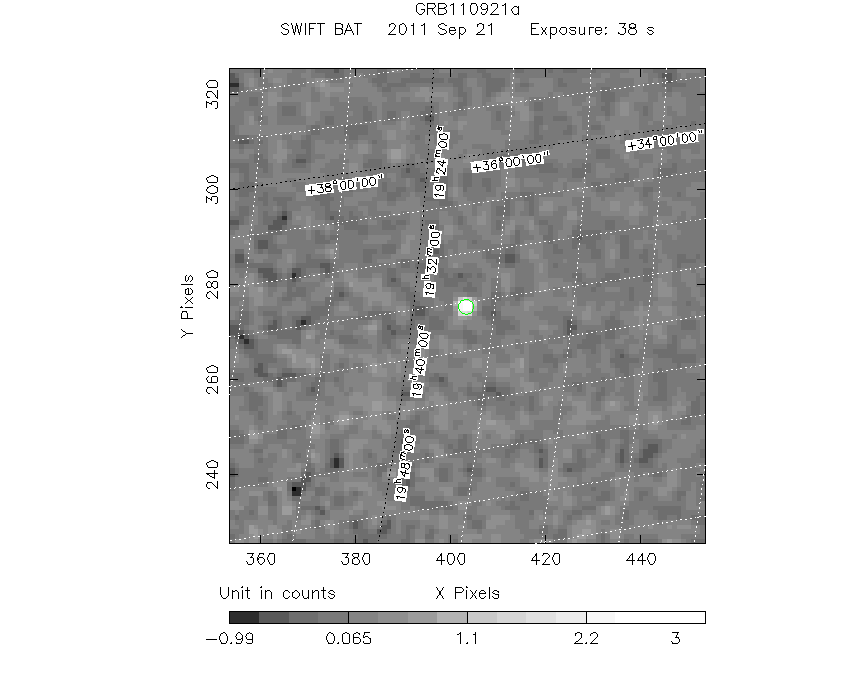
# RAcent DECcent POSerr Theta Phi Peak Cts SNR Name
294.0939 36.3576 0.0119 47.3802 22.9025 3.5894283 16.103 TRIG_00503652
Foreground time interval of the image:
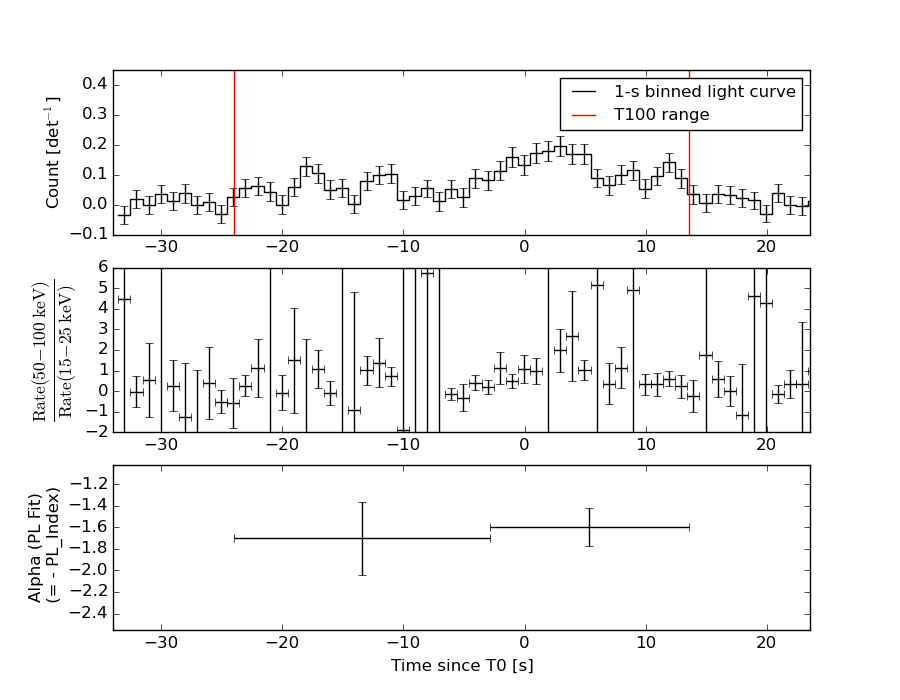
-24.032 13.576 (delta_t = 37.608 [sec])
Background time interval of the image:
-520.051 -503.794 (delta_t = 16.257 [sec])
-239.552 -24.032 (delta_t = 215.520 [sec])
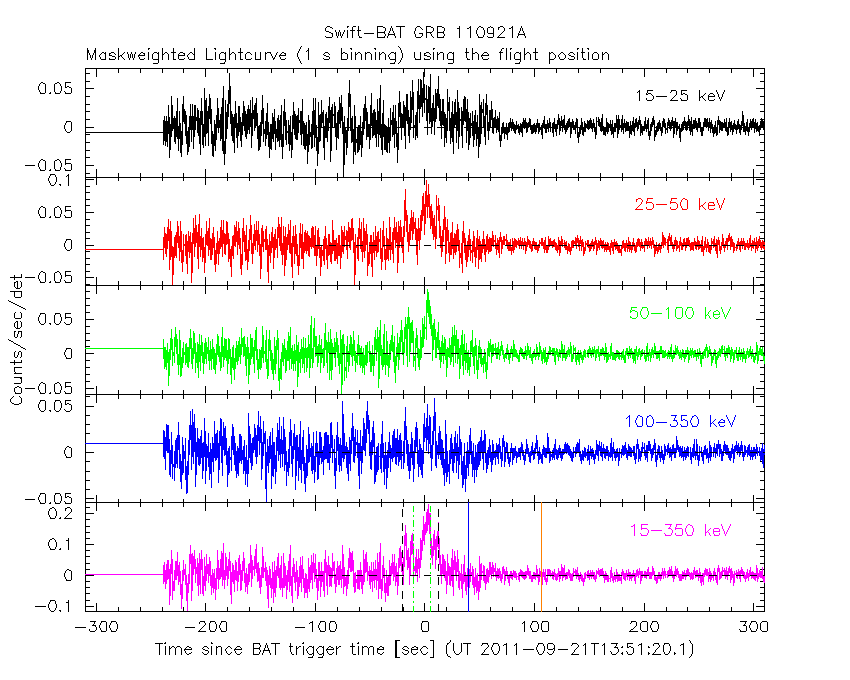
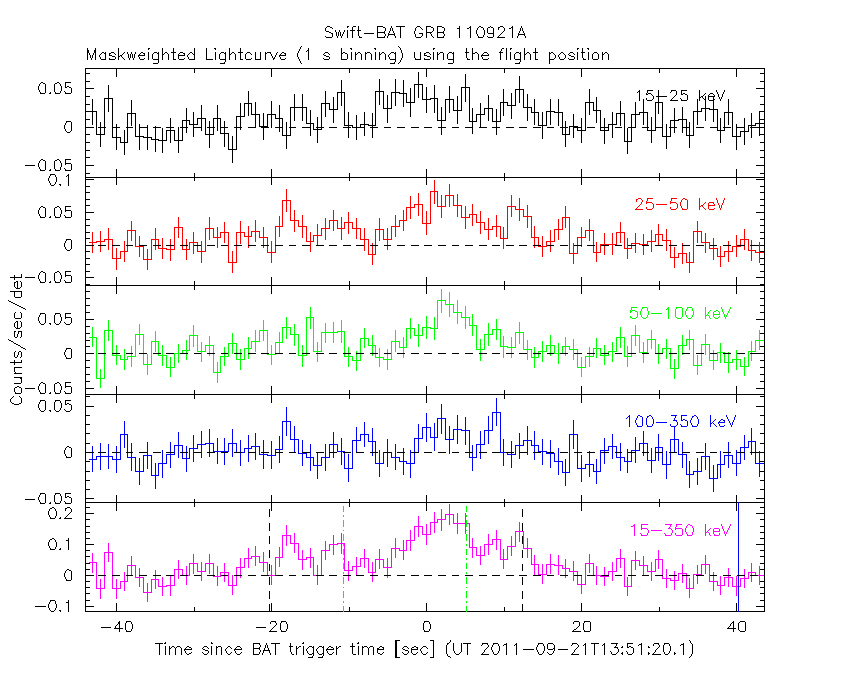
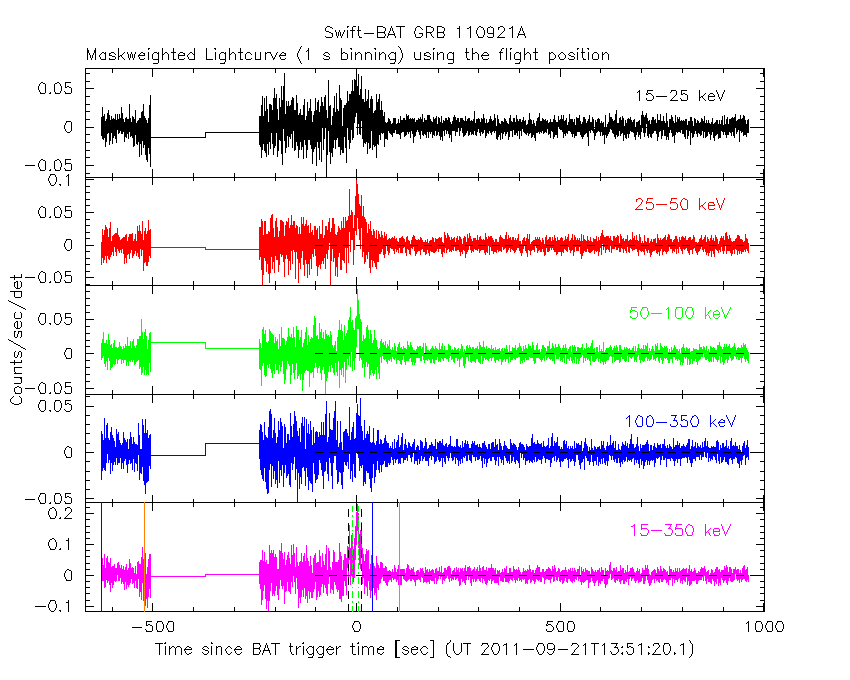
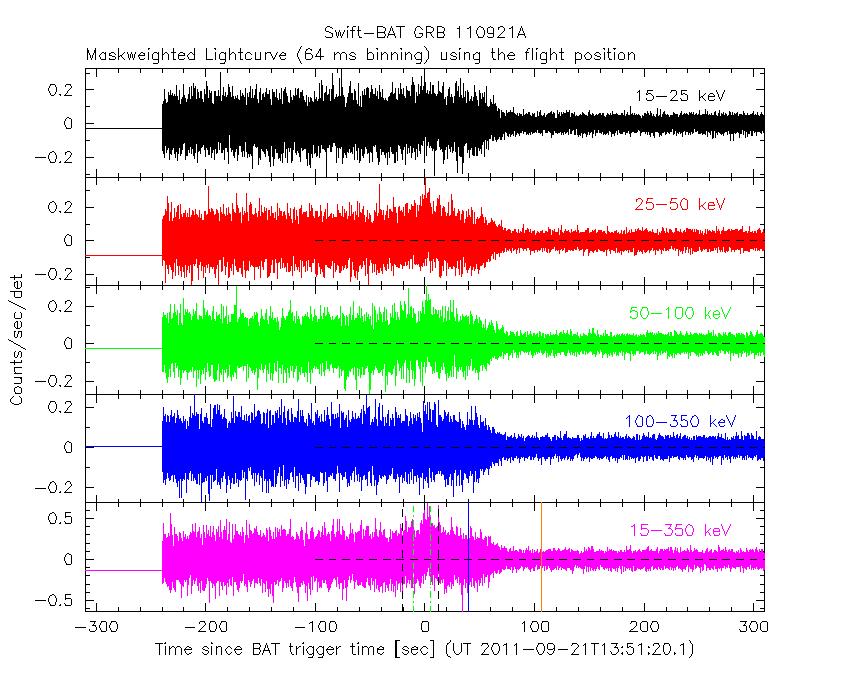
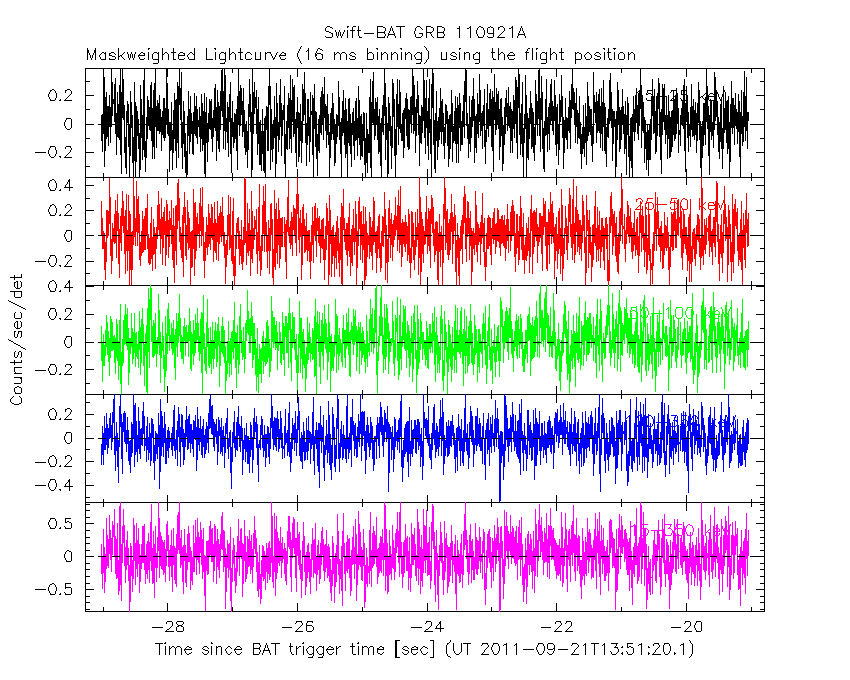
Lightcurves
Notes:
- 1) The mask-weighted light curves are using the flight position.
- 2) Multiple plots of different time binning/intervals are shown to cover all scenarios of short/long GRBs, rate/image triggers, and real/false positives.
- 3) For all the mask-weighted lightcurves, the y-axis units are counts/sec/det where a det is 0.4 x 0.4 = 0.16 sq cm.
- 4) The verticle lines correspond to following: green dotted lines are T50 interval, black dotted lines are T90 interval, blue solid line(s) is a spacecraft slew start time, and orange solid line(s) is a spacecraft slew end time.
- 5) Time of each bin is in the middle of the bin.
1 s binning
From T0-310 s to T0+310 s
From T100_start - 20 s to T100_end + 30 s
Full time interval
64 ms binning
Full time interval
From T100_start to T100_end
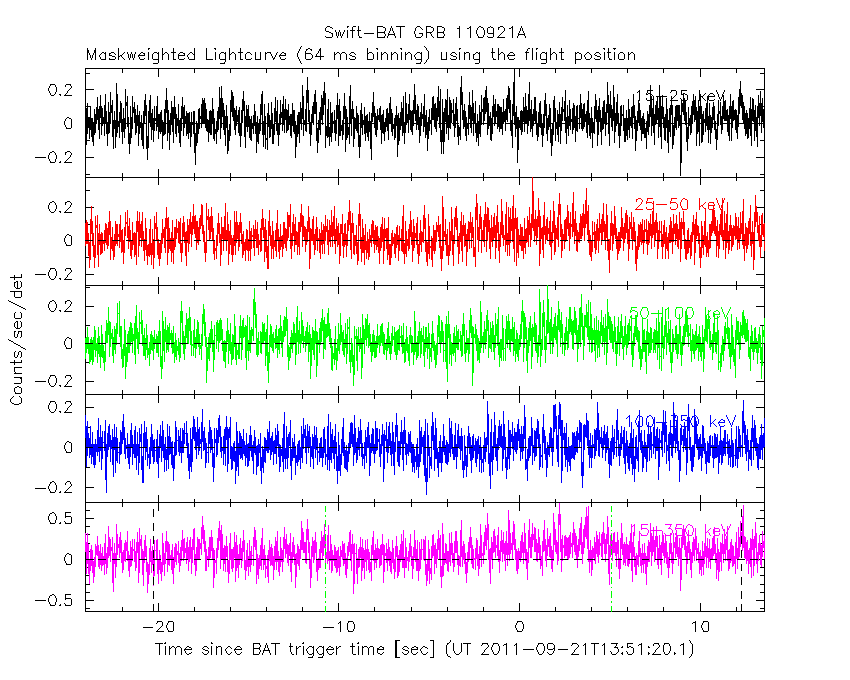
From T0-5 sec to T0+5 sec

16 ms binning
From T100_start-5 s to T100_start+5 s
Blue+Cyan dotted lines: Time interval of the scaled map
From 0.000000 to 4.096000
8 ms binning
From T100_start-3 s to T100_start+3 s

Blue+Cyan dotted lines: Time interval of the scaled map
From 0.000000 to 4.096000
2 ms binning
From T100_start-1 s to T100_start+1 s

Blue+Cyan dotted lines: Time interval of the scaled map
From 0.000000 to 4.096000
SN=5 or 10 sec. binning (whichever binning is satisfied first)
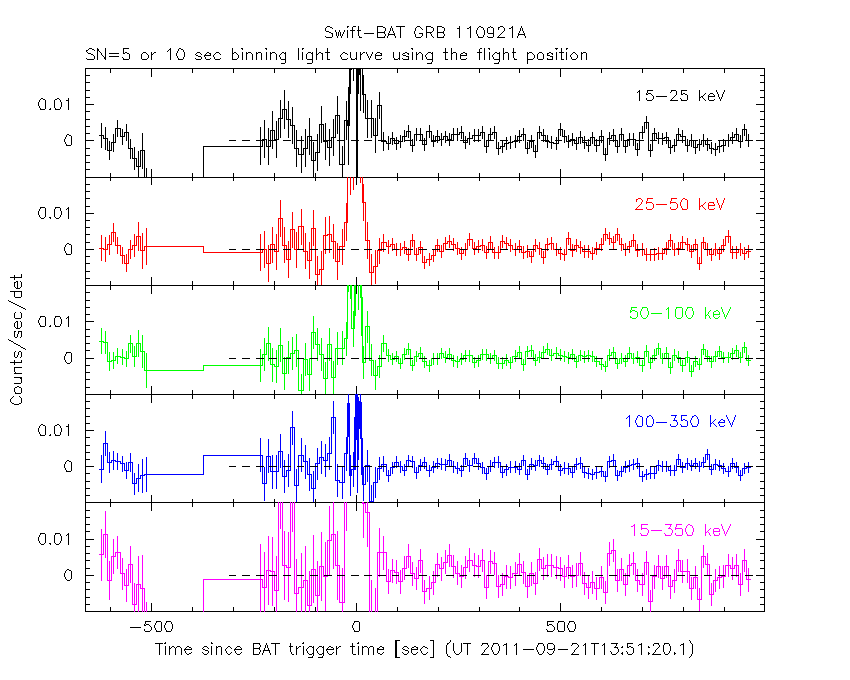
SN=5 or 10 sec. binning (T < 200 sec)

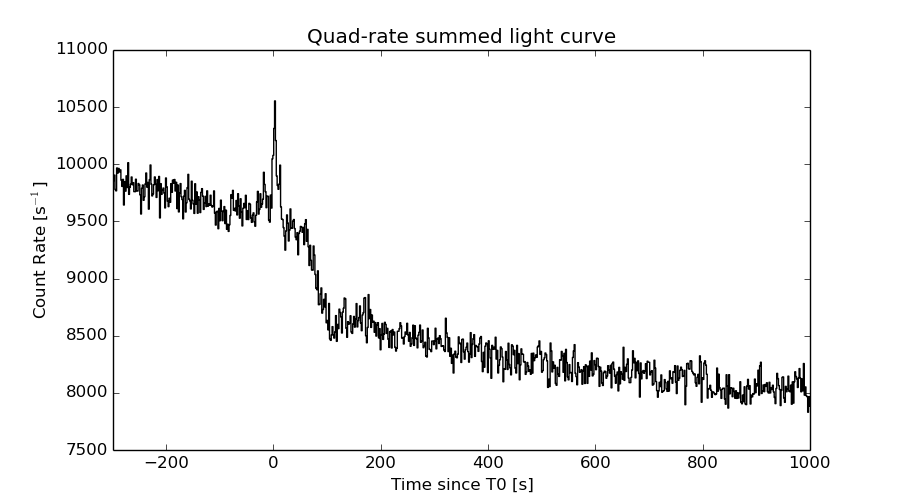
Quad-rate summed light curves (from T0-300s to T0+1000s)
The mask-weighted light curves based on cleaned DPHs

Spectral Evolution
Spectra
Notes:
- 1) The fitting includes the systematic errors.
- 2) When the burst includes telescope slew time periods, the fitting uses an average response file made from multiple 5-s response files through out the slew time plus single time preiod for the non-slew times, and weighted by the total counts in the corresponding time period using addrmf. An average response file is needed becuase a spectral fit using the pre-slew DRM will introduce some errors in both a spectral shape and a normalization if the PHA file contains a lot of the slew/post-slew time interval.
- 3) For fits to more complicated models (e.g. a power-law over a cutoff power-law), the BAT team has decided to require a chi-square improvement of more than 6 for each extra dof.
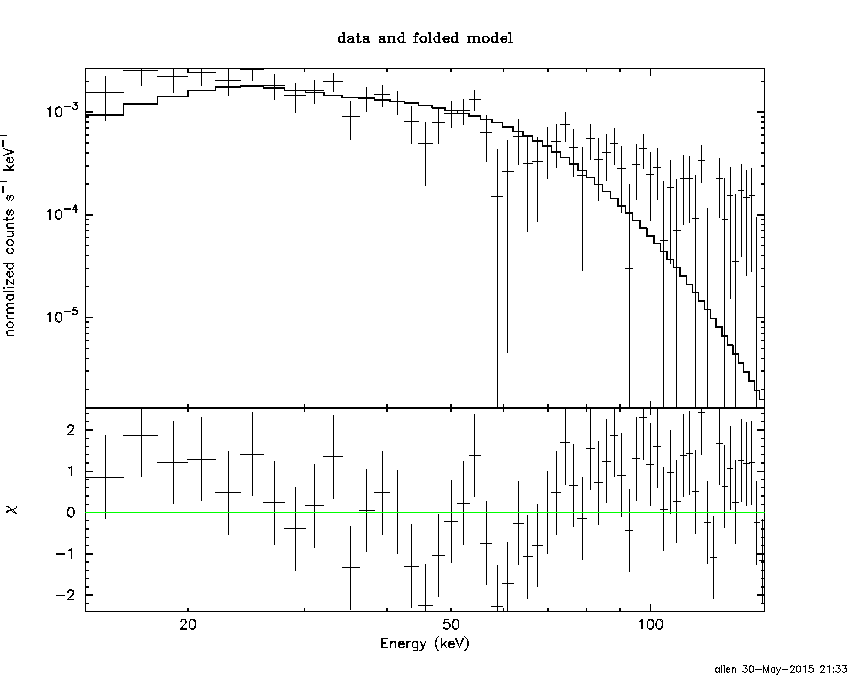
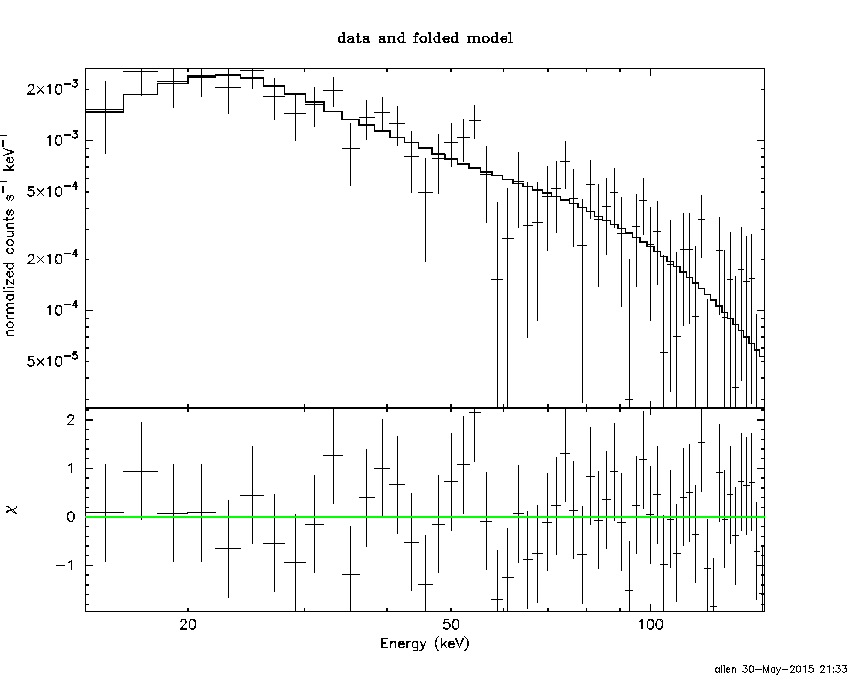
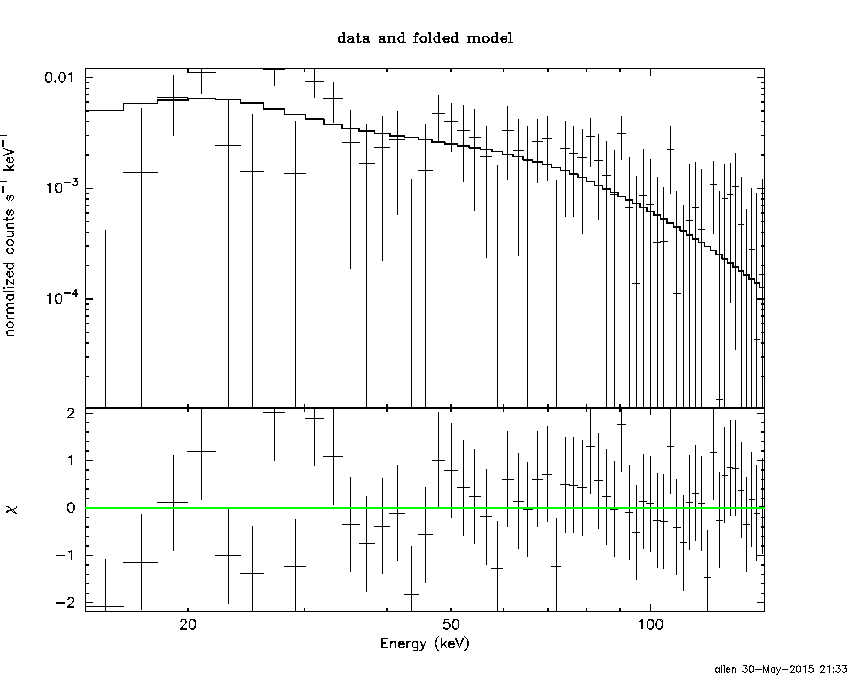
Time averaged spectrum fit using the average DRM
Power-law model

Time interval is from  -24.032 sec. to   13.576 sec.

Spectral model in power-law:
------------------------------------------------------------
Parameters  : value       lower 90%   higher 90%
Photon index: 1.64417     ( -0.167232   0.169438 )
Norm@50keV  : 6.19071E-03    ( -0.000596224   0.000591938 )
------------------------------------------------------------
#Fit statistic : Chi-Squared =          46.77 using 59 PHA bins.
# Reduced chi-squared =         0.8205 for     57 degrees of freedom
# Null hypothesis probability =   8.312955e-01

Photon flux (15-150 keV)    in 37.61 sec: 0.806810 ( -0.0777081  0.0780236 ) ph/cm2/s
Energy fluence (15-150 keV)             : 2.16672e-06 ( -2.20172e-07  2.21799e-07 ) ergs/cm2
Cutoff power-law model

Time interval is from  -24.032 sec. to   13.576 sec.
Spectral model in the cutoff power-law:
------------------------------------------------------------
Parameters  : value       lower 90%   higher 90%
Photon index: 1.64233     ( -0.591325   1.0978 )
Epeak [keV] : 9650.78      (   )
Norm@50keV  : 6.20451E-03    ( -0.00620457   0.00745246 )
------------------------------------------------------------
#Fit statistic : Chi-Squared =          46.76 using 59 PHA bins.
# Reduced chi-squared =         0.8351 for     56 degrees of freedom
# Null hypothesis probability =   8.056184e-01

Photon flux (15-150 keV)    in 37.61 sec: 0.804615 ( -0.080093  0.079654 ) ph/cm2/s
Energy fluence (15-150 keV)             : 2.15901e-06 ( -2.39771e-07  2.28849e-07 ) ergs/cm2
Band function

Time interval is from  -24.032 sec. to   13.576 sec.

Spectral model in the Band function:
------------------------------------------------------------
Parameters  : value       lower 90%   higher 90%
alpha       : -0.577876   ( 0.975816   0.975816 )
beta        : -1.74523    ( 1.73459   0.235193 )
Epeak [keV] : 43.7513      ( -43.6786 264.268 )
Norm@50keV   : 2.99942E-02    ( -0.0304277   568.198 )
------------------------------------------------------------
#Fit statistic : Chi-Squared =          46.02 using 59 PHA bins.
# Reduced chi-squared =         0.8367 for     55 degrees of freedom
# Null hypothesis probability =   8.004968e-01

Photon flux (15-150 keV)    in 37.61 sec:  (    ) ph/cm2/s
Energy fluence (15-150 keV)             : 0 ( 0  0 ) ergs/cm2
Single BB
Spectral model blackbody:
------------------------------------------------------------
Parameters  : value    Lower 90%  Upper 90%
kT [keV]    : 13.2395  (-1.62441  1.93002)
R^2/D10^2   : 0.134689  (-0.052372   0.0830208)
(R is the radius in km and D10 is the distance to the source in units of 10 kpc)
------------------------------------------------------------
#Fit statistic : Chi-Squared =          80.23 using 59 PHA bins.
# Reduced chi-squared =          1.408 for     57 degrees of freedom
# Null hypothesis probability =   2.296070e-02

Energy  Fluence     90% Error
[keV]   [erg/cm2]   [erg/cm2]
15- 25  1.882e-07   3.705e-08
25- 50  6.611e-07   8.049e-08
50-150  7.404e-07   1.519e-07
15-150  1.590e-06   2.003e-07
Thermal bremsstrahlung (OTTB)
Spectral model: thermal bremsstrahlung
------------------------------------------------------------
Parameters  : value         Lower 90%    Upper 90%
kT [keV]    : 162.721       (-58.2853      -162.718)
Norm        : 3.29093       (-0.344272     0.414521)
------------------------------------------------------------
#Fit statistic : Chi-Squared =          47.51 using 59 PHA bins.
# Reduced chi-squared =         0.8335 for     57 degrees of freedom
# Null hypothesis probability =   8.105795e-01

Energy  Fluence     90% Error
[keV]   [erg/cm2]   [erg/cm2]
15- 25  3.155e-07   6.520e-08
25- 50  5.916e-07   2.459e-07
50-150  1.206e-06   6.399e-07
15-150  2.114e-06   8.148e-07
Double BB
Spectral model: bbodyrad<1> + bbodyrad<2>
------------------------------------------------------------
Parameters  : value         Lower 90%    Upper 90%
kT1 [keV]   : 7.93226        (-1.57168      1.70277)
R1^2/D10^2  : 0.665071        (-0.322729      0.76476)
kT2 [keV]   : 35.9666        (-11.42      36.1381)
R2^2/D10^2  : 3.07331E-03    (-0.00257335   0.00808957)
------------------------------------------------------------
#Fit statistic : Chi-Squared =          44.38 using 59 PHA bins.
# Reduced chi-squared =         0.8070 for     55 degrees of freedom
# Null hypothesis probability =   8.463798e-01

Energy  Fluence     90% Error
[keV]   [erg/cm2]   [erg/cm2]
15- 25  3.036e-07   9.713e-08
25- 50  6.248e-07   1.891e-07
50-150  1.266e-06   5.969e-07
15-150  2.195e-06   7.970e-07
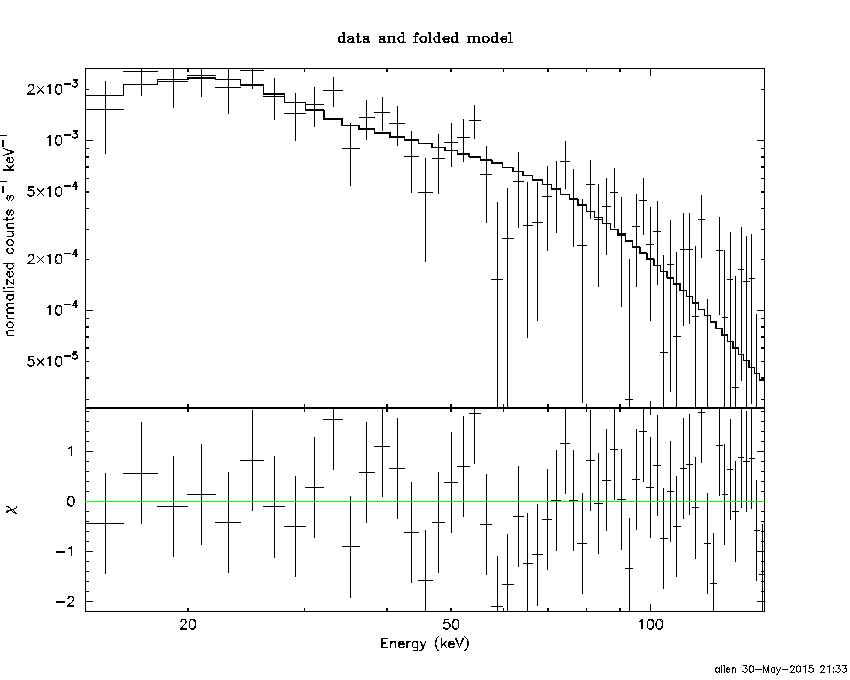
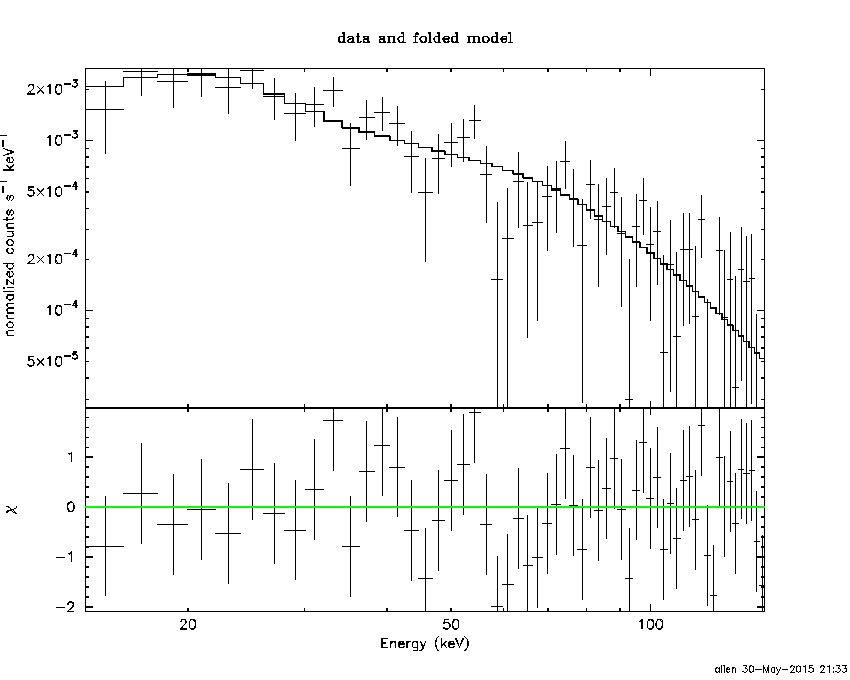
Peak spectrum fit
Power-law model
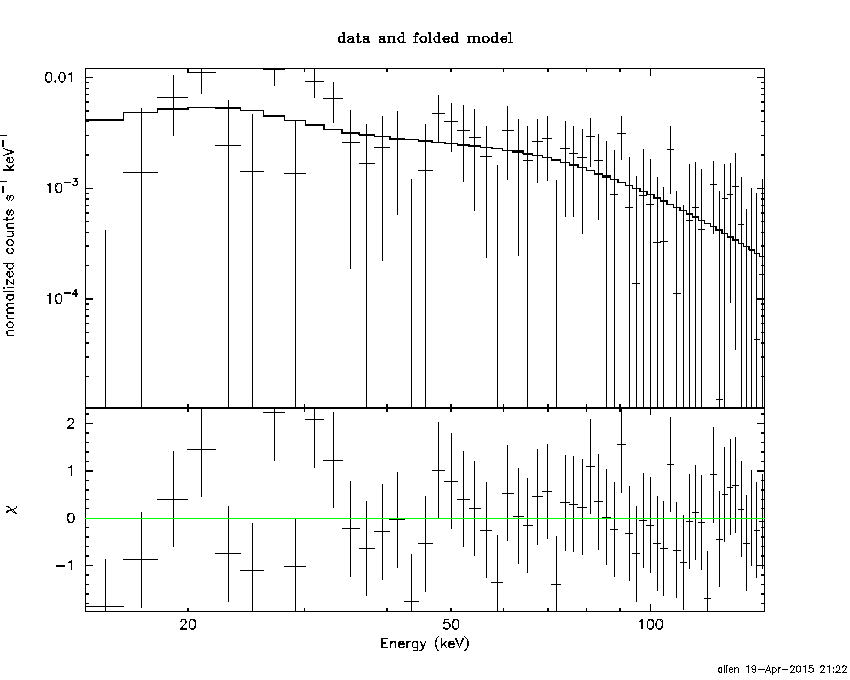
Time interval is from    2.872 sec. to    3.872 sec.

Spectral model in power-law:
------------------------------------------------------------
Parameters  : value       lower 90%   higher 90%
Photon index: 1.26426     ( -0.361508   0.350487 )
Norm@50keV  : 1.83657E-02    ( -0.00382191   0.00381775 )
------------------------------------------------------------
#Fit statistic : Chi-Squared =          44.21 using 59 PHA bins.
# Reduced chi-squared =         0.7756 for     57 degrees of freedom
# Null hypothesis probability =   8.921341e-01

Photon flux (15-150 keV)    in 1 sec: 2.17730 ( -0.476648  0.480657 ) ph/cm2/s
Energy fluence (15-150 keV)             : 1.83121e-07 ( -4.02126e-08  4.05447e-08 ) ergs/cm2
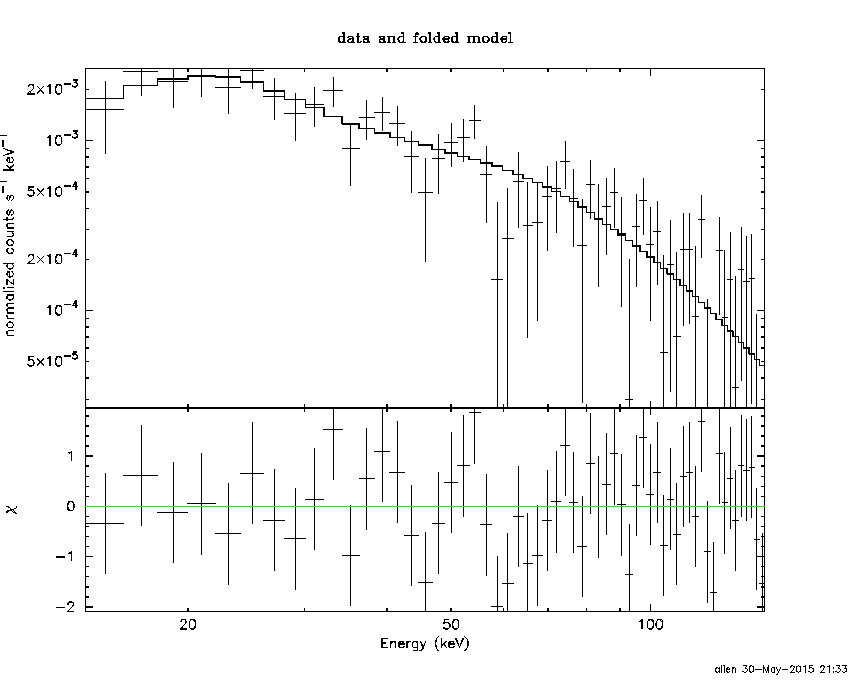
Cutoff power-law model
Time interval is from    2.872 sec. to    3.872 sec.
Spectral model in the cutoff power-law:
------------------------------------------------------------
Parameters  : value       lower 90%   higher 90%
Photon index: 0.748297     ( -1.71157   0.94306 )
Epeak [keV] : 133.060      ( -133.064 -133.064 )
Norm@50keV  : 3.20477E-02    ( -0.0170593   0.152793 )
------------------------------------------------------------
#Fit statistic : Chi-Squared =          43.77 using 59 PHA bins.
# Reduced chi-squared =         0.7817 for     56 degrees of freedom
# Null hypothesis probability =   8.825132e-01

Photon flux (15-150 keV)    in 1 sec: 2.13488 ( -0.48654  0.49185 ) ph/cm2/s
Energy fluence (15-150 keV)             : 1.78872e-07 ( -4.2838e-08  4.2277e-08 ) ergs/cm2
Band function

Time interval is from    2.872 sec. to    3.872 sec.

Spectral model in the Band function:
------------------------------------------------------------
Parameters  : value       lower 90%   higher 90%
alpha       : 5.00000   ( -5   -5 )
beta        : -1.46827    ( -0.531719   0.437739 )
Epeak [keV] : 31.8904      ( -31.8902 19.1946 )
Norm@50keV   : 387.986    ( -79.2563   6.54269e+06 )
------------------------------------------------------------
#Fit statistic : Chi-Squared =          42.38 using 59 PHA bins.
# Reduced chi-squared =         0.7705 for     55 degrees of freedom
# Null hypothesis probability =   8.934852e-01

Photon flux (15-150 keV)    in 1 sec:  (    ) ph/cm2/s
Energy fluence (15-150 keV)             : 0 ( 0  0 ) ergs/cm2
Single BB
Spectral model blackbody:
------------------------------------------------------------
Parameters  : value    Lower 90%  Upper 90%
kT [keV]    : 18.8871  (-4.44809  6.16958)
R^2/D10^2   : 0.120690  (-0.0742937   0.179148)
(R is the radius in km and D10 is the distance to the source in units of 10 kpc)
------------------------------------------------------------
#Fit statistic : Chi-Squared =          47.81 using 59 PHA bins.
# Reduced chi-squared =         0.8387 for     57 degrees of freedom
# Null hypothesis probability =   8.020346e-01

Energy  Fluence     90% Error
[keV]   [erg/cm2]   [erg/cm2]
15- 25  8.481e-09   3.803e-09
25- 50  4.062e-08   1.670e-08
50-150  1.064e-07   4.294e-08
15-150  1.555e-07   5.902e-08
Thermal bremsstrahlung (OTTB)
Spectral model: thermal bremsstrahlung
------------------------------------------------------------
Parameters  : value         Lower 90%    Upper 90%
kT [keV]    : 200.000       (      )
Norm        : 9.20239       (-1.9354     1.93515)
------------------------------------------------------------
#Fit statistic : Chi-Squared =          45.84 using 59 PHA bins.
# Reduced chi-squared =         0.8043 for     57 degrees of freedom
# Null hypothesis probability =   8.550968e-01

Energy  Fluence     90% Error
[keV]   [erg/cm2]   [erg/cm2]
15- 25  2.293e-08   1.370e-08
25- 50  4.410e-08   2.527e-08
50-150  9.673e-08   5.600e-08
15-150  1.638e-07   9.480e-08
Double BB
Spectral model: bbodyrad<1> + bbodyrad<2>
------------------------------------------------------------
Parameters  : value         Lower 90%    Upper 90%
kT1 [keV]   : 7.62658        (-3.47421      8.13661)
R1^2/D10^2  : 1.46791        (-1.27782      3.26388)
kT2 [keV]   : 29.6018        (-20.6948      -29.6763)
R2^2/D10^2  : 2.19149E-02    (-0.0213687   0.0725183)
------------------------------------------------------------
#Fit statistic : Chi-Squared =          42.89 using 59 PHA bins.
# Reduced chi-squared =         0.7798 for     55 degrees of freedom
# Null hypothesis probability =   8.824551e-01

Energy  Fluence     90% Error
[keV]   [erg/cm2]   [erg/cm2]
15- 25  1.789e-08   1.011e-08
25- 50  4.249e-08   2.292e-08
50-150  1.210e-07   6.575e-08
15-150  1.813e-07   9.775e-08
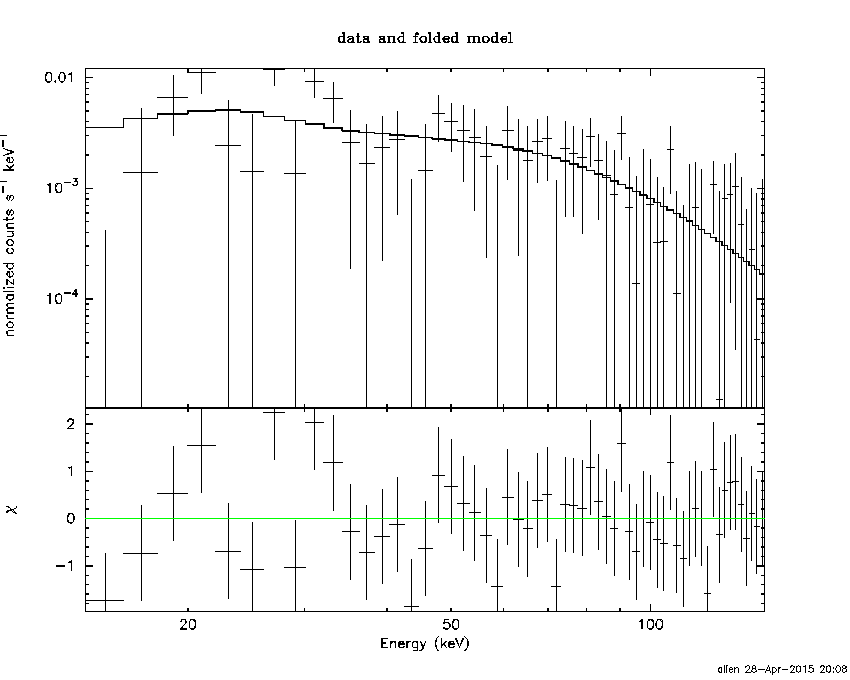
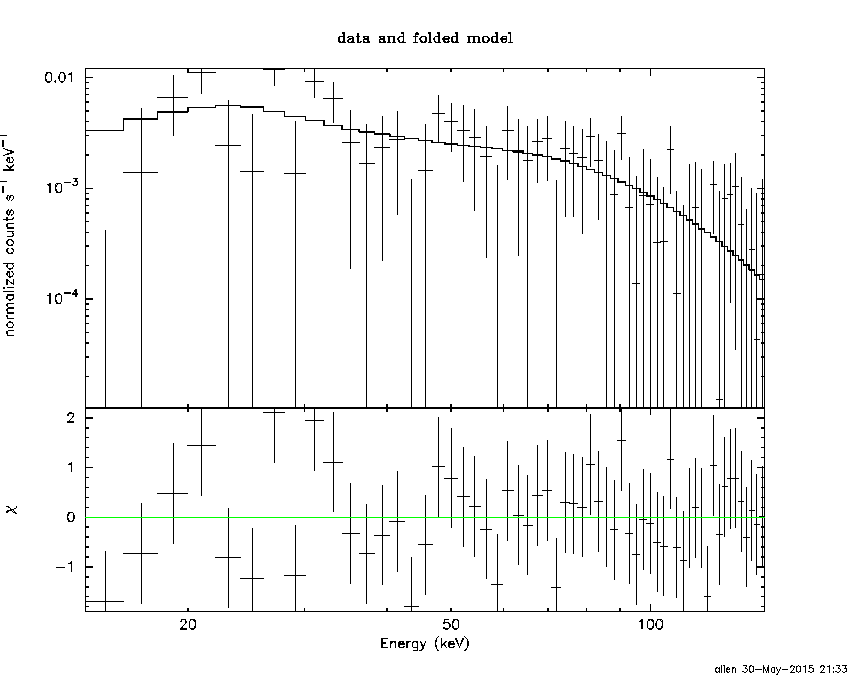
Pre-slew spectrum (Pre-slew PHA with pre-slew DRM)
Power-law model
Spectral model in power-law:
------------------------------------------------------------
Parameters  : value       lower 90%   higher 90%
Photon index: 1.64417     ( -0.167232   0.169438 )
Norm@50keV  : 6.19071E-03    ( -0.000596224   0.000591938 )
------------------------------------------------------------
#Fit statistic : Chi-Squared =          46.77 using 59 PHA bins.
# Reduced chi-squared =         0.8205 for     57 degrees of freedom
# Null hypothesis probability =   8.312955e-01

Photon flux (15-150 keV)    in 37.61 sec: 0.806810 ( -0.0777081  0.0780236 ) ph/cm2/s
Energy fluence (15-150 keV)             : 2.16672e-06 ( -2.20172e-07  2.21799e-07 ) ergs/cm2
Cutoff power-law model

Spectral model in the cutoff power-law:
------------------------------------------------------------
Parameters  : value       lower 90%   higher 90%
Photon index: 1.64233     ( -0.591325   1.0978 )
Epeak [keV] : 9650.78      (   )
Norm@50keV  : 6.20451E-03    ( -0.00620457   0.00745246 )
------------------------------------------------------------
#Fit statistic : Chi-Squared =          46.76 using 59 PHA bins.
# Reduced chi-squared =         0.8351 for     56 degrees of freedom
# Null hypothesis probability =   8.056184e-01

Photon flux (15-150 keV)    in 37.61 sec: 0.804615 ( -0.080093  0.079654 ) ph/cm2/s
Energy fluence (15-150 keV)             : 2.15901e-06 ( -2.39771e-07  2.28849e-07 ) ergs/cm2
Band function
Spectral model in the Band function:
------------------------------------------------------------
Parameters  : value       lower 90%   higher 90%
alpha       : -0.577876   ( 0.975816   0.975816 )
beta        : -1.74523    ( 1.73459   0.235193 )
Epeak [keV] : 43.7513      ( -43.6786 264.268 )
Norm@50keV   : 2.99942E-02    ( -0.0304277   568.188 )
------------------------------------------------------------
#Fit statistic : Chi-Squared =          46.02 using 59 PHA bins.
# Reduced chi-squared =         0.8367 for     55 degrees of freedom
# Null hypothesis probability =   8.004968e-01

Photon flux (15-150 keV)    in 37.61 sec:  (    ) ph/cm2/s
Energy fluence (15-150 keV)             : 0 ( 0  0 ) ergs/cm2
S(25-50 keV) vs. S(50-100 keV) plot
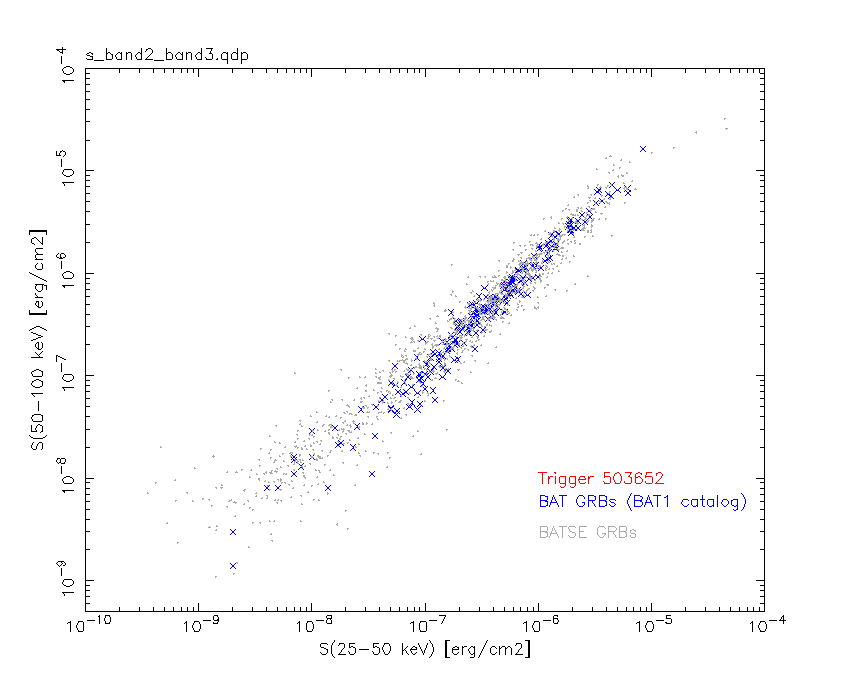
S(25-50 keV)  = 5.73e-07
S(50-100 keV) = 7.33e-07
T90 vs. Hardness ratio plot
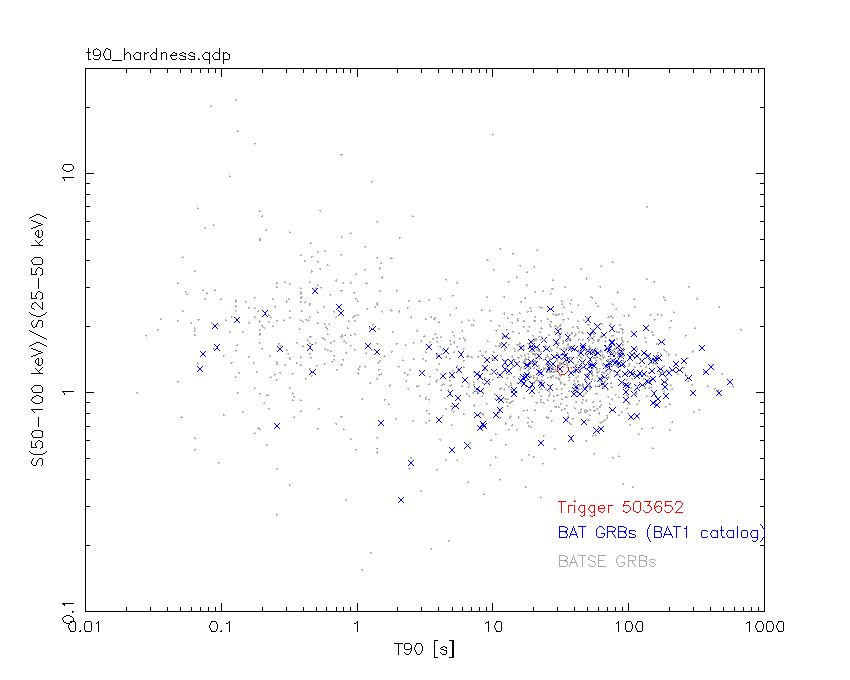
T90                                   = 32.5479999780655 sec.
Hardness ratio (energy fluence ratio) = 1.27923
Color vs. Color plot

Count Ratio  (25-50 keV) / (15-25 keV) = 1.47091
Count Ratio (50-100 keV) / (15-25 keV) = 1.03906
Mask shadow pattern
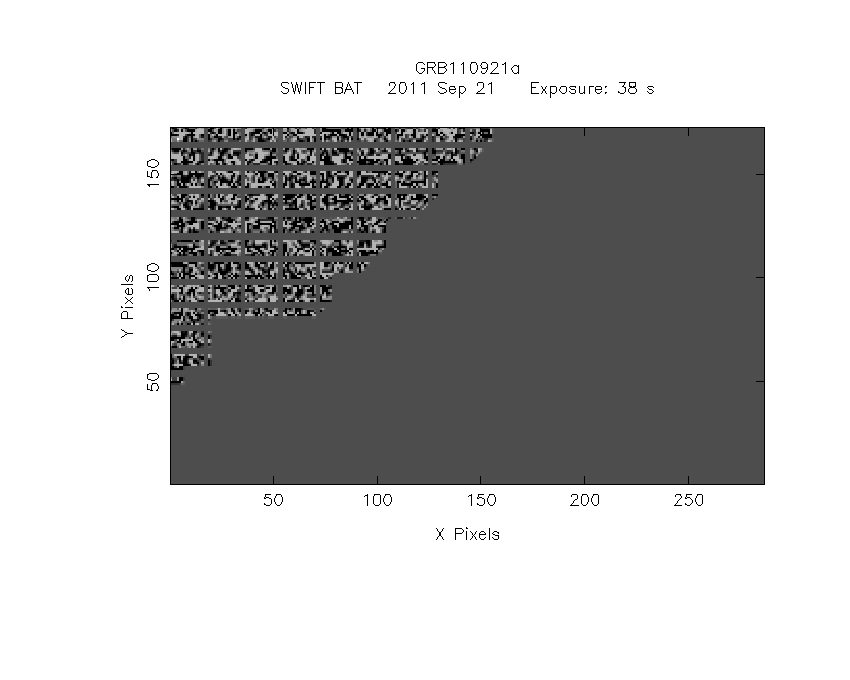
IMX = 1.001069459169128E+00, IMY = -4.229192195949183E-01
TIME vs. PHA plot around the trigger time
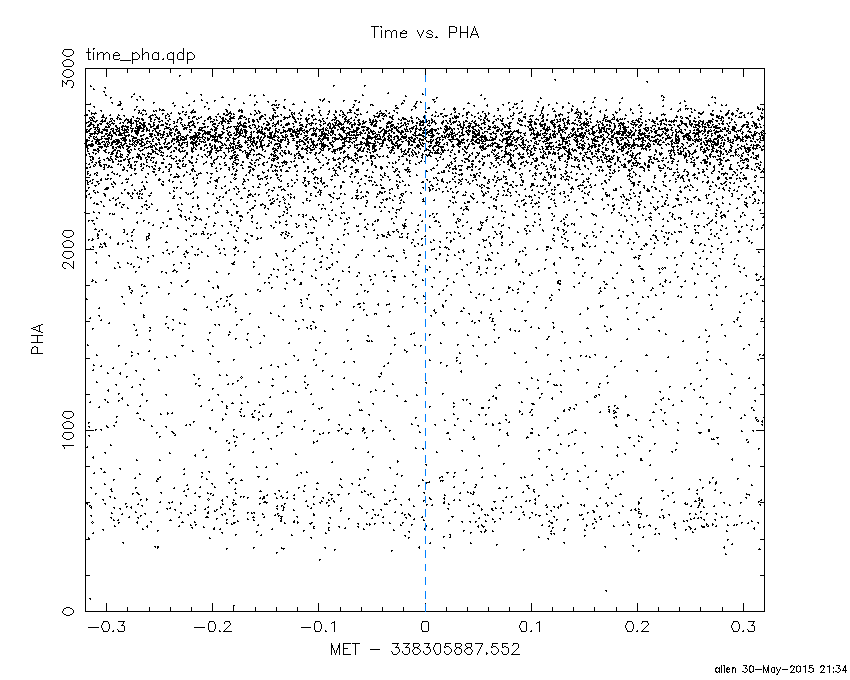
Blue+Cyan dotted lines: Time interval of the scaled map
From 0.000000 to 4.096000
TIME vs. DetID plot around the trigger time
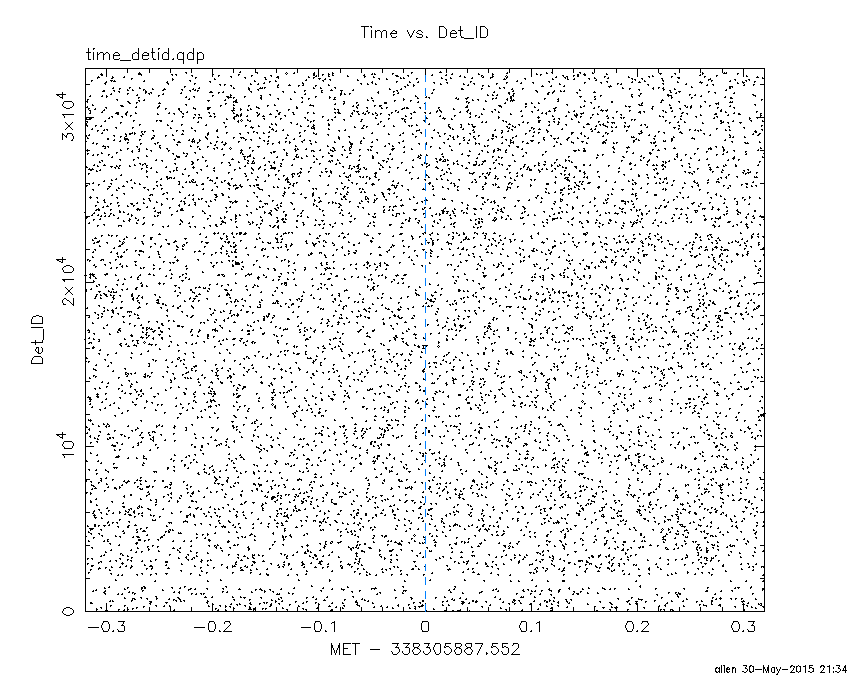
Blue+Cyan dotted lines: Time interval of the scaled map
From 0.000000 to 4.096000
100 us light curve (15-350 keV)
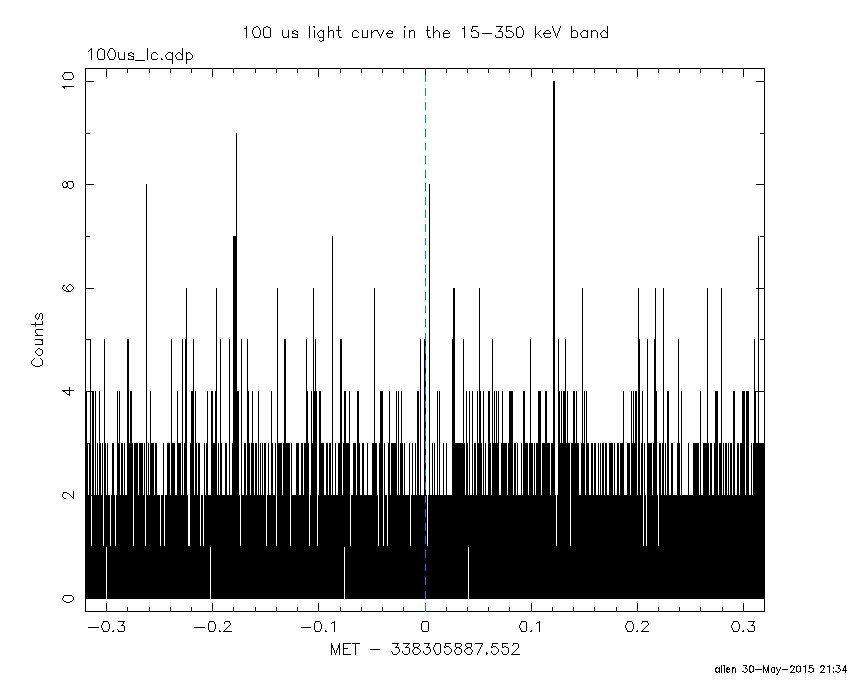
Blue+Cyan dotted lines: Time interval of the scaled map
From 0.000000 to 4.096000
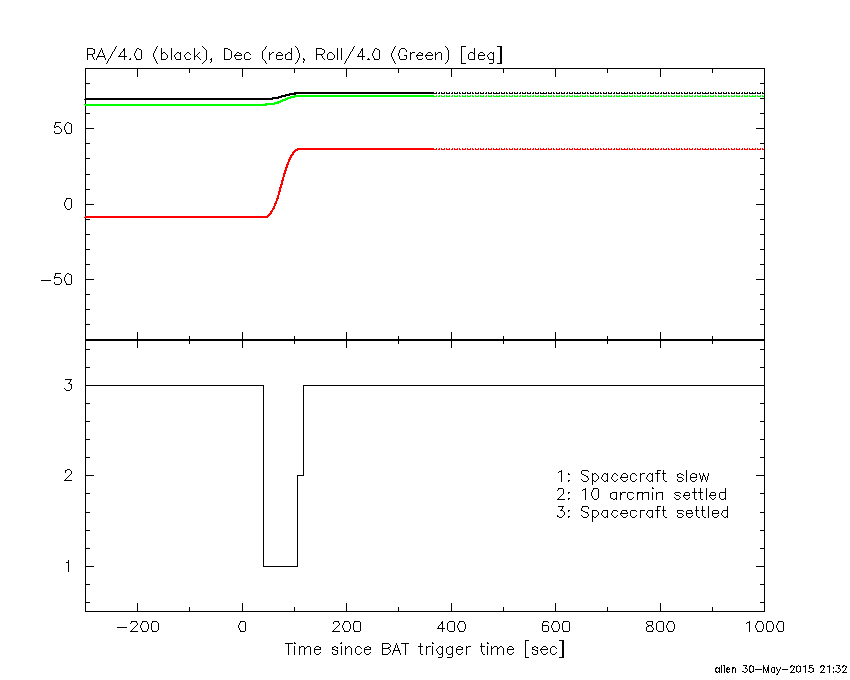
Spacecraft aspect plot
Bright source in the pre-burst/pre-slew/post-slew images
Pre-burst image of 15-350 keV band
Time interval of the image:
-520.051400 -503.794100
-239.552000 -24.032000

# RAcent  DECcent POSerr Theta    Phi  PeakCts   SNR AngSep     Name
#  [deg]    [deg]    ['] [deg]  [deg]                   [']
244.9820 -15.6490    0.4  33.6  -99.2  12.1027  30.7    0.5	Sco X-1
254.5872  35.3245   20.3  49.6  -19.9  -0.2879  -0.6    6.4	Her X-1
256.0451 -37.8123    2.1  35.5 -142.4   1.6442   5.4    3.4	4U 1700-377
256.5781 -36.2973   10.7  34.1 -141.3   0.3059   1.1   10.2	GX 349+2
263.1731 -24.8037    7.4  21.8 -133.2   0.3090   1.6    9.6	GX 1+4
264.7995 -44.3069    9.2  37.5 -157.6   0.3408   1.3    8.9	4U 1735-44
268.3449  -1.4690    3.7  12.6  -49.3   0.6051   3.1    1.7	SW J1753.5-0127
270.2791 -25.0663    1.9  18.2 -148.9   1.2325   6.0    0.8	GX 5-1
270.4626 -25.7392 1589.2  18.7 -150.3   0.0014   0.0    8.7	GRS 1758-258
274.0224 -13.9663    3.1   6.9 -133.2   0.7259   3.7    4.3	GX 17+2
275.9685 -30.4089    6.5  21.8 -167.7   0.3463   1.8    3.4	H1820-303
284.9993 -24.9378    4.5  17.3  166.4   0.5553   2.6    2.2	HT1900.1-2455
288.8117  10.9617    1.5  22.1   33.3   1.7343   7.7    1.3	GRS 1915+105
299.6095  35.2008    1.6  48.2   29.0   5.2239   7.0    0.9	Cyg X-1
262.9465 -33.9069    2.5  29.0 -146.4   1.0561   4.5    4.8	GX 354-0
273.5688   4.0979    3.0  13.8  -15.8   0.7284   3.8 ------	UNKNOWN
259.2876  43.1582    2.1  54.8  -11.2   3.9608   5.6 ------	UNKNOWN
Pre-slew background subtracted image of 15-350 keV band
Time interval of the image:
-24.032000 13.576000

# RAcent  DECcent POSerr Theta    Phi  PeakCts   SNR AngSep     Name
#  [deg]    [deg]    ['] [deg]  [deg]                   [']
244.8802 -15.7607    6.0  33.7  -99.3  -0.2839  -1.9    9.2	Sco X-1
254.5899  35.2775   10.9  49.6  -20.0   0.1725   1.1    7.6	Her X-1
255.9729 -37.7004   47.2  35.5 -142.2  -0.0246  -0.2    8.6	4U 1700-377
256.5963 -36.2994    0.0  34.1 -141.3  -0.0697  -0.7   10.7	GX 349+2
262.9850 -24.6871    6.7  21.9 -132.7   0.1358   1.7    3.7	GX 1+4
264.9016 -44.3131    0.0  37.5 -157.8  -0.1382  -1.4   10.7	4U 1735-44
268.2314  -1.6149    0.0  12.6  -50.1  -0.1373  -1.9   12.7	SW J1753.5-0127
270.1108 -24.9371    0.0  18.1 -148.3  -0.0642  -0.9   12.7	GX 5-1
270.4765 -25.8853    0.0  18.8 -150.5  -0.1851  -2.7   12.7	GRS 1758-258
274.1540 -13.9682    5.3   6.8 -134.0  -0.1598  -2.2    9.5	GX 17+2
275.8102 -30.2243    3.8  21.6 -167.3   0.2138   3.1   10.4	H1820-303
285.1914 -25.0163    6.2  17.4  165.9  -0.1380  -1.8   10.2	HT1900.1-2455
288.9229  11.1007    0.0  22.3   33.3   0.0549   0.7   11.8	GRS 1915+105
299.7477  35.0425    5.3  48.1   29.3  -0.6042  -2.2   12.3	Cyg X-1
262.9487 -33.8747    6.1  29.0 -146.3  -0.1608  -1.9    3.1	GX 354-0
294.0939  36.3576    0.7  47.4   22.9   3.5899  16.1 ------	UNKNOWN
Post-slew image of 15-350 keV band
Time interval of the image:
106.548600 962.498200

# RAcent  DECcent POSerr Theta    Phi  PeakCts   SNR AngSep     Name
#  [deg]    [deg]    ['] [deg]  [deg]                   [']
254.3777  35.3962    6.9  32.0  -96.1   1.4037   1.7    5.1	Her X-1
268.3664  -1.5655    7.0  44.9 -158.4   1.5496   1.7    6.8	SW J1753.5-0127
273.9276 -13.9087   18.2  53.8 -171.9   0.9586   0.6    8.9	GX 17+2
288.7984  10.9415    0.8  25.9  175.6   7.2047  14.7    0.2	GRS 1915+105
299.5833  35.1793    0.5   4.6   87.1   9.2749  21.8    1.4	Cyg X-1
308.1438  40.9499    1.6  11.9   46.7   3.2354   7.0    1.5	Cyg X-3
326.0523  38.3824    6.6  25.3   59.4   1.0346   1.7    6.7	Cyg X-2
348.5901  52.3375    3.1  41.0   33.0   3.5636   3.7 ------	UNKNOWN
 23.0655  72.4674    2.8  55.3    5.1   9.1259   4.0 ------	UNKNOWN
340.0968  70.1077    2.2  41.6    5.3   3.7802   5.1 ------	UNKNOWN
274.8096  17.9687    2.7  25.1 -148.5   2.0941   4.4 ------	UNKNOWN
248.0429  75.6101    3.8  44.5  -31.2   2.7016   3.1 ------	UNKNOWN
256.5340  34.8899    2.9  30.4  -97.8   2.5831   4.0 ------	UNKNOWN
220.1605  67.6812    4.8  50.7  -44.5   7.0642   2.4 ------	UNKNOWN
232.8930  56.1764    4.2  44.9  -60.1   6.5118   2.7 ------	UNKNOWN
250.0221   9.5927    3.0  48.0 -129.0   7.8074   3.8 ------	UNKNOWN
Plot creation:
Sat May 30 21:34:38 EDT 2015