Click here for the BAT GCN circular template
Image
Pre-slew 15.0-350.0 keV image (Event data)
#   RAcent    DECcent   POSerr    Theta     Phi              Peak Cts       SNR   Name
  257.7580    36.5550   0.0195    45.3239   -21.5819         1.0100310      9.904 TRIG_00504215

Foreground time interval of the image:
 -1.088  27.876 (delta_t =  28.964 [sec])
Background time interval of the image:
-239.200  -1.088 (delta_t = 238.112 [sec])
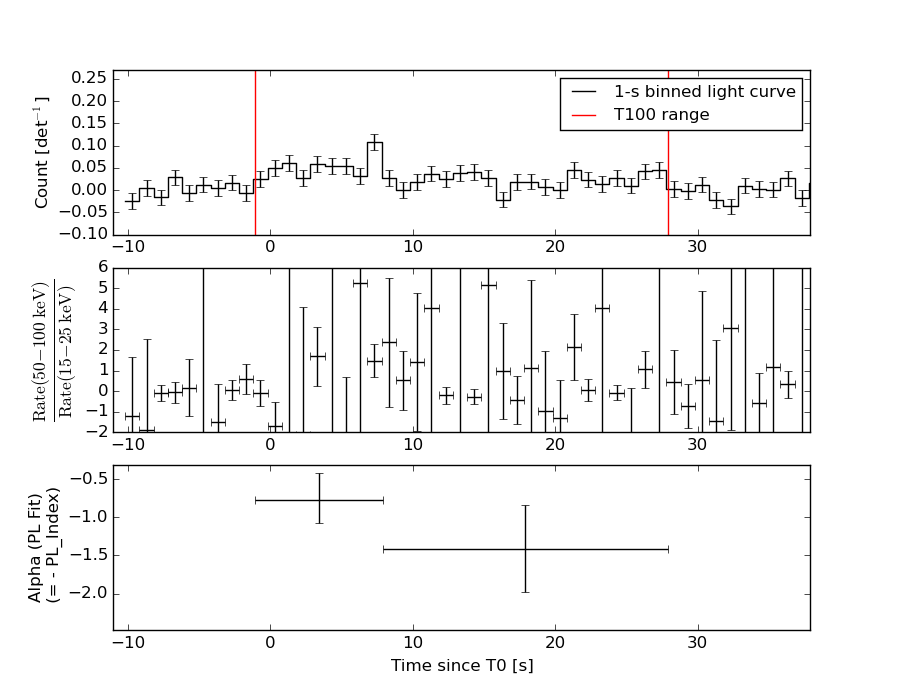
Lightcurves
Notes:
- 1) The mask-weighted light curves are using the flight position.
- 2) Multiple plots of different time binning/intervals are shown to cover all scenarios of short/long GRBs, rate/image triggers, and real/false positives.
- 3) For all the mask-weighted lightcurves, the y-axis units are counts/sec/det where a det is 0.4 x 0.4 = 0.16 sq cm.
- 4) The verticle lines correspond to following: green dotted lines are T50 interval, black dotted lines are T90 interval, blue solid line(s) is a spacecraft slew start time, and orange solid line(s) is a spacecraft slew end time.
- 5) Time of each bin is in the middle of the bin.
1 s binning
From T0-310 s to T0+310 s
From T100_start - 20 s to T100_end + 30 s
Full time interval

64 ms binning
Full time interval
From T100_start to T100_end
From T0-5 sec to T0+5 sec
16 ms binning
From T100_start-5 s to T100_start+5 s
Blue+Cyan dotted lines: Time interval of the scaled map
From 0.000000 to 8.192000
8 ms binning
From T100_start-3 s to T100_start+3 s
Blue+Cyan dotted lines: Time interval of the scaled map
From 0.000000 to 8.192000
2 ms binning
From T100_start-1 s to T100_start+1 s
Blue+Cyan dotted lines: Time interval of the scaled map
From 0.000000 to 8.192000
SN=5 or 10 sec. binning (whichever binning is satisfied first)
SN=5 or 10 sec. binning (T < 200 sec)
Quad-rate summed light curves (from T0-300s to T0+1000s)
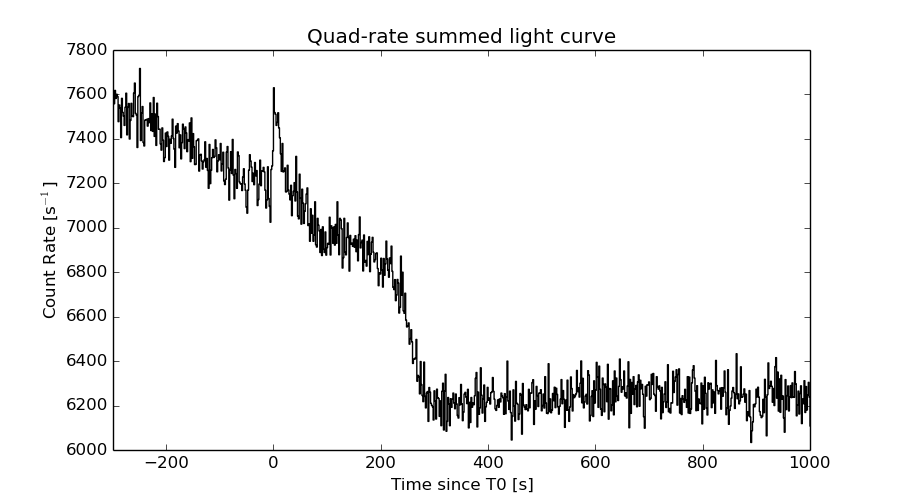
The mask-weighted light curves based on cleaned DPHs

Spectral Evolution
Spectra
Notes:
- 1) The fitting includes the systematic errors.
- 2) When the burst includes telescope slew time periods, the fitting uses an average response file made from multiple 5-s response files through out the slew time plus single time preiod for the non-slew times, and weighted by the total counts in the corresponding time period using addrmf. An average response file is needed becuase a spectral fit using the pre-slew DRM will introduce some errors in both a spectral shape and a normalization if the PHA file contains a lot of the slew/post-slew time interval.
- 3) For fits to more complicated models (e.g. a power-law over a cutoff power-law), the BAT team has decided to require a chi-square improvement of more than 6 for each extra dof.
Time averaged spectrum fit using the average DRM
Power-law model

Time interval is from   -1.088 sec. to   27.876 sec.

Spectral model in power-law:
------------------------------------------------------------
Parameters  : value       lower 90%   higher 90%
Photon index: 1.03884     ( -0.313208   0.289158 )
Norm@50keV  : 2.27228E-03    ( -0.000400974   0.000388798 )
------------------------------------------------------------
#Fit statistic : Chi-Squared =          44.98 using 59 PHA bins.
# Reduced chi-squared =         0.7891 for     57 degrees of freedom
# Null hypothesis probability =   8.754801e-01

Photon flux (15-150 keV)    in 28.96 sec: 0.262198 ( -0.0474578  0.0484652 ) ph/cm2/s
Energy fluence (15-150 keV)             : 7.02037e-07 ( -1.11026e-07  1.11195e-07 ) ergs/cm2
Cutoff power-law model
Time interval is from   -1.088 sec. to   27.876 sec.
Spectral model in the cutoff power-law:
------------------------------------------------------------
Parameters  : value       lower 90%   higher 90%
Photon index: 2.12650     (     )
Epeak [keV] : 43.6180      (   )
Norm@50keV  : 2.03014E-04    (     )
------------------------------------------------------------
#Fit statistic : Chi-Squared =          44.57 using 59 PHA bins.
# Reduced chi-squared =         0.7960 for     56 degrees of freedom
# Null hypothesis probability =   8.641337e-01

Photon flux (15-150 keV)    in 28.96 sec: 0.262117 ( -0.051197  0.048421 ) ph/cm2/s
Energy fluence (15-150 keV)             : 7.01287e-07 ( -1.13257e-07  1.12072e-07 ) ergs/cm2
Band function
Time interval is from   -1.088 sec. to   27.876 sec.

Spectral model in the Band function:
------------------------------------------------------------
Parameters  : value       lower 90%   higher 90%
alpha       : -0.834374   ( 0.834374   0.834374 )
beta        : -1.03884    ( 1.03884   0.313588 )
Epeak [keV] : 50.0868      ( -50.0868 -50.0868 )
Norm@50keV   : 3.97807E-03    ( -0.00206793   0 )
------------------------------------------------------------
#Fit statistic : Chi-Squared =          44.98 using 59 PHA bins.
# Reduced chi-squared =         0.8178 for     55 degrees of freedom
# Null hypothesis probability =   8.304188e-01

Photon flux (15-150 keV)    in 28.96 sec:  (    ) ph/cm2/s
Energy fluence (15-150 keV)             : 0 ( 0  0 ) ergs/cm2
Single BB
Spectral model blackbody:
------------------------------------------------------------
Parameters  : value    Lower 90%  Upper 90%
kT [keV]    : 25.2189  (-4.9955  7.26489)
R^2/D10^2   : 5.92243E-03  (-0.00323846   0.00625397)
(R is the radius in km and D10 is the distance to the source in units of 10 kpc)
------------------------------------------------------------
#Fit statistic : Chi-Squared =          51.61 using 59 PHA bins.
# Reduced chi-squared =         0.9055 for     57 degrees of freedom
# Null hypothesis probability =   6.766615e-01

Energy  Fluence     90% Error
[keV]   [erg/cm2]   [erg/cm2]
15- 25  1.886e-08   7.131e-09
25- 50  1.075e-07   3.197e-08
50-150  5.062e-07   1.497e-07
15-150  6.326e-07   1.629e-07
Thermal bremsstrahlung (OTTB)
Spectral model: thermal bremsstrahlung
------------------------------------------------------------
Parameters  : value         Lower 90%    Upper 90%
kT [keV]    : 200.000       (      )
Norm        : 1.17188       (-0.192023     0.191902)
------------------------------------------------------------
#Fit statistic : Chi-Squared =          54.97 using 59 PHA bins.
# Reduced chi-squared =         0.9643 for     57 degrees of freedom
# Null hypothesis probability =   5.517471e-01

Energy  Fluence     90% Error
[keV]   [erg/cm2]   [erg/cm2]
15- 25  8.451e-08   4.904e-08
25- 50  1.626e-07   9.228e-08
50-150  3.566e-07   1.992e-07
15-150  6.036e-07   3.401e-07
Double BB

Spectral model: bbodyrad<1> + bbodyrad<2>
------------------------------------------------------------
Parameters  : value         Lower 90%    Upper 90%
kT1 [keV]   : 8.57290        (-4.69967      8.61588)
R1^2/D10^2  : 0.103447        (-0.0652771      1.98266)
kT2 [keV]   : 37.7198        (-12.689      -37.72)
R2^2/D10^2  : 1.50220E-03    (-0.00144722   0.0042123)
------------------------------------------------------------
#Fit statistic : Chi-Squared =          44.82 using 59 PHA bins.
# Reduced chi-squared =         0.8149 for     55 degrees of freedom
# Null hypothesis probability =   8.347843e-01

Energy  Fluence     90% Error
[keV]   [erg/cm2]   [erg/cm2]
15- 25  5.004e-08   2.928e-08
25- 50  1.378e-07   7.386e-08
50-150  5.219e-07   2.877e-07
15-150  7.098e-07   3.658e-07
Peak spectrum fit
Power-law model
Time interval is from    6.840 sec. to    7.840 sec.

Spectral model in power-law:
------------------------------------------------------------
Parameters  : value       lower 90%   higher 90%
Photon index: 1.49836     ( -0.478356   0.468599 )
Norm@50keV  : 7.12026E-03    ( -0.00196869   0.00196751 )
------------------------------------------------------------
#Fit statistic : Chi-Squared =          59.60 using 59 PHA bins.
# Reduced chi-squared =          1.046 for     57 degrees of freedom
# Null hypothesis probability =   3.814083e-01

Photon flux (15-150 keV)    in 1 sec: 0.888486 ( -0.261379  0.265919 ) ph/cm2/s
Energy fluence (15-150 keV)             : 6.75651e-08 ( -1.94349e-08  1.96598e-08 ) ergs/cm2
Cutoff power-law model
Time interval is from    6.840 sec. to    7.840 sec.
Spectral model in the cutoff power-law:
------------------------------------------------------------
Parameters  : value       lower 90%   higher 90%
Photon index: 0.252120     ( -3.74543   1.61459 )
Epeak [keV] : 71.6772      ( -46.8861 -71.6767 )
Norm@50keV  : 2.90796E-02    ( -0.0290805   1.71167 )
------------------------------------------------------------
#Fit statistic : Chi-Squared =          58.62 using 59 PHA bins.
# Reduced chi-squared =          1.047 for     56 degrees of freedom
# Null hypothesis probability =   3.796965e-01

Photon flux (15-150 keV)    in 1 sec: 0.837960 ( -0.274609  0.27959 ) ph/cm2/s
Energy fluence (15-150 keV)             : 6.25261e-08 ( -2.10297e-08  2.09672e-08 ) ergs/cm2
Band function
Time interval is from    6.840 sec. to    7.840 sec.

Spectral model in the Band function:
------------------------------------------------------------
Parameters  : value       lower 90%   higher 90%
alpha       : 0.310206   ( 0.295054   4.95642 )
beta        : -2.21616    ( 2.09651   0.963005 )
Epeak [keV] : 59.9942      ( -59.688 162.221 )
Norm@50keV   : 6.05755E-02    ( -0.0630937   81.3166 )
------------------------------------------------------------
#Fit statistic : Chi-Squared =          58.40 using 59 PHA bins.
# Reduced chi-squared =          1.062 for     55 degrees of freedom
# Null hypothesis probability =   3.514912e-01

Photon flux (15-150 keV)    in 1 sec: 0.830561 (    ) ph/cm2/s
Energy fluence (15-150 keV)             : 6.31633e-08 ( 0  0 ) ergs/cm2
Single BB
Spectral model blackbody:
------------------------------------------------------------
Parameters  : value    Lower 90%  Upper 90%
kT [keV]    : 15.3225  (-3.94893  5.97386)
R^2/D10^2   : 9.65321E-02  (-0.0675752   0.18824)
(R is the radius in km and D10 is the distance to the source in units of 10 kpc)
------------------------------------------------------------
#Fit statistic : Chi-Squared =          59.54 using 59 PHA bins.
# Reduced chi-squared =          1.045 for     57 degrees of freedom
# Null hypothesis probability =   3.833072e-01

Energy  Fluence     90% Error
[keV]   [erg/cm2]   [erg/cm2]
15- 25  4.727e-09   2.812e-09
25- 50  1.915e-08   1.069e-08
50-150  3.089e-08   1.867e-08
15-150  5.476e-08   2.485e-08
Thermal bremsstrahlung (OTTB)
Spectral model: thermal bremsstrahlung
------------------------------------------------------------
Parameters  : value         Lower 90%    Upper 90%
kT [keV]    : 199.363       (-199.363      -199.363)
Norm        : 3.68812       (-1.0125     1.35822)
------------------------------------------------------------
#Fit statistic : Chi-Squared =          59.18 using 59 PHA bins.
# Reduced chi-squared =          1.038 for     57 degrees of freedom
# Null hypothesis probability =   3.957902e-01

Energy  Fluence     90% Error
[keV]   [erg/cm2]   [erg/cm2]
15- 25  9.184e-09   5.570e-09
25- 50  1.767e-08   1.048e-08
50-150  3.875e-08   2.281e-08
15-150  6.559e-08   3.861e-08
Double BB
Spectral model: bbodyrad<1> + bbodyrad<2>
------------------------------------------------------------
Parameters  : value         Lower 90%    Upper 90%
kT1 [keV]   : 10.8133        (-10.9466      8.42226)
R1^2/D10^2  : 0.234924        (-0.224553      -0.224553)
kT2 [keV]   : 32.2593        (-35.8641      -35.8641)
R2^2/D10^2  : 3.83524E-03    (-0.00238753   0.218557)
------------------------------------------------------------
#Fit statistic : Chi-Squared =          58.44 using 59 PHA bins.
# Reduced chi-squared =          1.063 for     55 degrees of freedom
# Null hypothesis probability =   3.502058e-01

Energy  Fluence     90% Error
[keV]   [erg/cm2]   [erg/cm2]
15- 25  6.315e-09   4.281e-09
25- 50  1.960e-08   1.162e-08
50-150  3.727e-08   2.292e-08
15-150  6.318e-08   3.905e-08
Pre-slew spectrum (Pre-slew PHA with pre-slew DRM)
Power-law model

Spectral model in power-law:
------------------------------------------------------------
Parameters  : value       lower 90%   higher 90%
Photon index: 1.03884     ( -0.313208   0.289158 )
Norm@50keV  : 2.27228E-03    ( -0.000400974   0.000388798 )
------------------------------------------------------------
#Fit statistic : Chi-Squared =          44.98 using 59 PHA bins.
# Reduced chi-squared =         0.7891 for     57 degrees of freedom
# Null hypothesis probability =   8.754801e-01

Photon flux (15-150 keV)    in 28.96 sec: 0.262198 ( -0.0474578  0.0484652 ) ph/cm2/s
Energy fluence (15-150 keV)             : 7.02037e-07 ( -1.11026e-07  1.11195e-07 ) ergs/cm2
Cutoff power-law model

Spectral model in the cutoff power-law:
------------------------------------------------------------
Parameters  : value       lower 90%   higher 90%
Photon index: 2.12650     (     )
Epeak [keV] : 43.6180      (   )
Norm@50keV  : 2.03014E-04    (     )
------------------------------------------------------------
#Fit statistic : Chi-Squared =          44.57 using 59 PHA bins.
# Reduced chi-squared =         0.7960 for     56 degrees of freedom
# Null hypothesis probability =   8.641337e-01

Photon flux (15-150 keV)    in 28.96 sec: 0.262117 ( -0.051197  0.048421 ) ph/cm2/s
Energy fluence (15-150 keV)             : 7.01287e-07 ( -1.13257e-07  1.12072e-07 ) ergs/cm2
Band function

Spectral model in the Band function:
------------------------------------------------------------
Parameters  : value       lower 90%   higher 90%
alpha       : -0.834374   ( 0.834374   0.834374 )
beta        : -1.03884    ( 1.03884   0.313588 )
Epeak [keV] : 50.0868      ( -50.0868 -50.0868 )
Norm@50keV   : 3.97807E-03    ( -0.00206793   0 )
------------------------------------------------------------
#Fit statistic : Chi-Squared =          44.98 using 59 PHA bins.
# Reduced chi-squared =         0.8178 for     55 degrees of freedom
# Null hypothesis probability =   8.304188e-01

Photon flux (15-150 keV)    in 28.96 sec:  (    ) ph/cm2/s
Energy fluence (15-150 keV)             : 0 ( 0  0 ) ergs/cm2
S(25-50 keV) vs. S(50-100 keV) plot
S(25-50 keV)  = 1.33e-07
S(50-100 keV) = 2.60e-07
T90 vs. Hardness ratio plot

T90                                   = 20.879999935627 sec.
Hardness ratio (energy fluence ratio) = 1.95489
Color vs. Color plot

Count Ratio  (25-50 keV) / (15-25 keV) = 1.85652
Count Ratio (50-100 keV) / (15-25 keV) = 2.45206
Mask shadow pattern
IMX = 9.404664190719637E-01, IMY = 3.720125006224086E-01
TIME vs. PHA plot around the trigger time

Blue+Cyan dotted lines: Time interval of the scaled map
From 0.000000 to 8.192000
TIME vs. DetID plot around the trigger time
Blue+Cyan dotted lines: Time interval of the scaled map
From 0.000000 to 8.192000
100 us light curve (15-350 keV)
Blue+Cyan dotted lines: Time interval of the scaled map
From 0.000000 to 8.192000
Spacecraft aspect plot
Bright source in the pre-burst/pre-slew/post-slew images
Pre-burst image of 15-350 keV band
Time interval of the image:
-239.200000 -1.088000

# RAcent  DECcent POSerr Theta    Phi  PeakCts   SNR AngSep     Name
#  [deg]    [deg]    ['] [deg]  [deg]                   [']
244.9737 -15.6398    0.7  38.2 -106.2   7.5940  15.5    0.3	Sco X-1
254.3376  35.2743    6.3  46.0  -25.8   0.6915   1.8    7.2	Her X-1
256.0084 -37.8603    2.0  42.0 -143.8   1.9391   5.8    1.4	4U 1700-377
256.4275 -36.4212   11.1  40.7 -142.8   0.3436   1.0    0.4	GX 349+2
263.1000 -24.6516   10.0  28.1 -136.7   0.2605   1.1    7.5	GX 1+4
264.8339 -44.6046    4.6  44.2 -157.3   0.8233   2.5   10.1	4U 1735-44
268.4534  -1.5914    5.2  13.2  -78.7   0.4467   2.2    9.8	SW J1753.5-0127
270.1457 -25.1807   35.7  24.8 -149.1  -0.0615  -0.3    9.7	GX 5-1
270.2788 -25.7149    5.1  25.2 -150.0   0.4712   2.5    2.1	GRS 1758-258
274.0864 -14.0327    2.7  13.3 -141.1   0.8013   4.3    4.7	GX 17+2
275.7523 -30.2267    4.3  27.8 -163.6   0.5252   2.7   12.3	H1820-303
285.1763 -24.9370    5.2  22.2  176.9   0.4264   2.2    7.7	HT1900.1-2455
288.8247  11.0430    2.2  15.8   32.7   0.9931   5.3    6.1	GRS 1915+105
299.6490  35.2070    2.7  41.8   27.9   1.6623   4.3    2.9	Cyg X-1
308.0385  40.9720   10.3  50.1   31.6   1.1954   1.1    3.5	Cyg X-3
262.8656 -33.8040    4.6  35.4 -147.1   0.6221   2.5    6.4	GX 354-0
319.6476   6.5064    2.9  39.2   81.5   2.9757   4.0 ------	UNKNOWN
255.1444  23.3479    2.7  36.8  -37.4   1.2174   4.3 ------	UNKNOWN
Pre-slew background subtracted image of 15-350 keV band
Time interval of the image:
-1.088000 27.876000

# RAcent  DECcent POSerr Theta    Phi  PeakCts   SNR AngSep     Name
#  [deg]    [deg]    ['] [deg]  [deg]                   [']
245.0152 -15.5218    6.7  38.1 -106.0   0.2585   1.7    7.4	Sco X-1
254.5883  35.3853    7.9  45.9  -25.4  -0.1654  -1.5    6.9	Her X-1
256.0210 -37.8038    9.5  42.0 -143.8   0.1232   1.2    2.9	4U 1700-377
256.5989 -36.5064   10.1  40.7 -143.1   0.1115   1.1    9.3	GX 349+2
262.8699 -24.7004    6.0  28.2 -136.4  -0.1285  -1.9    8.0	GX 1+4
264.8418 -44.5156   36.2  44.1 -157.3  -0.0299  -0.3    5.8	4U 1735-44
268.2278  -1.5767    6.0  13.4  -78.8   0.1054   1.9   11.2	SW J1753.5-0127
270.2130 -25.2174    3.5  24.8 -149.3   0.2087   3.3    9.1	GX 5-1
270.2498 -25.8899   24.7  25.4 -150.1   0.0287   0.5    9.3	GRS 1758-258
274.0944 -14.1126   31.7  13.4 -141.4  -0.0197  -0.4    6.9	GX 17+2
275.7547 -30.2471    6.6  27.8 -163.6  -0.1026  -1.7   11.4	H1820-303
285.0615 -25.0626   50.4  22.4  177.2   0.0134   0.2    8.6	HT1900.1-2455
288.7713  10.8509   16.8  15.6   32.9   0.0409   0.7    5.9	GRS 1915+105
299.4391  35.2110   16.9  41.7   27.7   0.0752   0.7    7.4	Cyg X-1
308.1278  40.9424    2.3  50.1   31.7   1.3535   5.0    1.0	Cyg X-3
262.8258 -33.7592   43.3  35.4 -147.0   0.0199   0.3    9.3	GX 354-0
257.7591  36.5542    1.2  45.3  -21.6   1.0245  10.0 ------	UNKNOWN
Post-slew image of 15-350 keV band
Time interval of the image:
359.100600 962.835500

# RAcent  DECcent POSerr Theta    Phi  PeakCts   SNR AngSep     Name
#  [deg]    [deg]    ['] [deg]  [deg]                   [']
 31.9618 -16.5955    2.3  10.5  122.9   1.4641   5.0 ------	UNKNOWN
 45.3241 -13.3780    2.9  18.2  169.3   1.1540   4.0 ------	UNKNOWN
327.8559 -43.5322    2.7  53.8   -0.0   4.2199   4.3 ------	UNKNOWN
 85.3579   2.8486    3.2  59.1 -166.1   8.5270   3.6 ------	UNKNOWN
 83.1840 -16.3163    4.0  48.0 -146.4   2.5072   2.9 ------	UNKNOWN
  1.7016 -75.3596    4.1  50.6  -44.6   4.8919   2.9 ------	UNKNOWN
 51.8836 -69.3882    3.7  43.8  -64.0   5.6062   3.2 ------	UNKNOWN
Plot creation:
Sat May 30 21:32:22 EDT 2015