Special notes of this burst
Image
Pre-slew 15.0-350.0 keV image (Event data)
# RAcent DECcent POSerr Theta Phi Peak Cts SNR Name
223.3108 -19.7241 0.0191 38.1802 -43.5380 1.1572308 10.092 TRIG_00504779
Foreground time interval of the image:
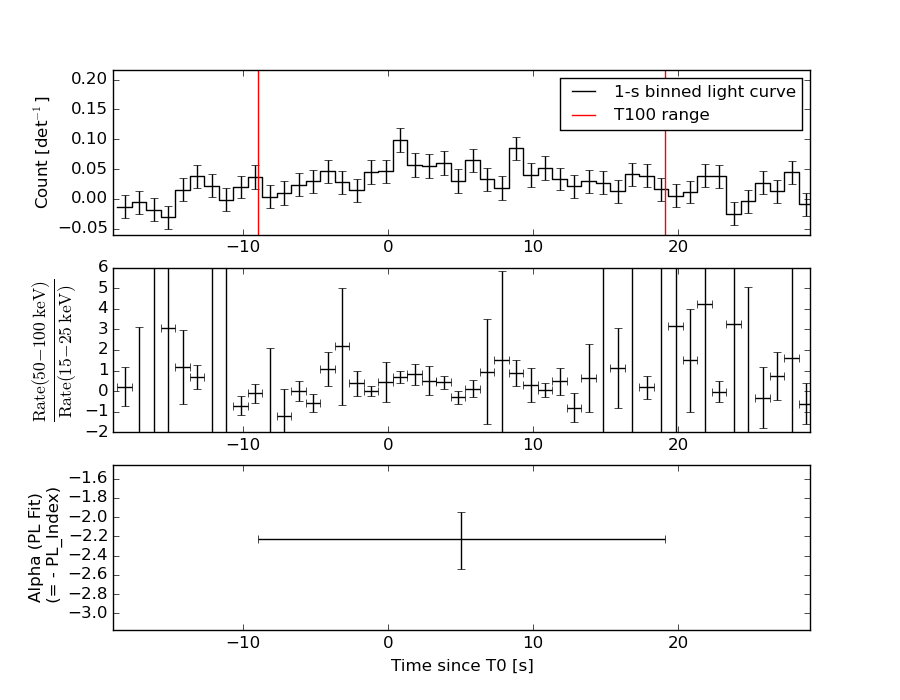
-9.000 19.100 (delta_t = 28.100 [sec])
Background time interval of the image:
-239.664 -9.000 (delta_t = 230.664 [sec])
Lightcurves
Notes:
- 1) The mask-weighted light curves are using the flight position.
- 2) Multiple plots of different time binning/intervals are shown to cover all scenarios of short/long GRBs, rate/image triggers, and real/false positives.
- 3) For all the mask-weighted lightcurves, the y-axis units are counts/sec/det where a det is 0.4 x 0.4 = 0.16 sq cm.
- 4) The verticle lines correspond to following: green dotted lines are T50 interval, black dotted lines are T90 interval, blue solid line(s) is a spacecraft slew start time, and orange solid line(s) is a spacecraft slew end time.
- 5) Time of each bin is in the middle of the bin.
1 s binning
From T0-310 s to T0+310 s
From T100_start - 20 s to T100_end + 30 s
Full time interval
64 ms binning
Full time interval
From T100_start to T100_end
From T0-5 sec to T0+5 sec
16 ms binning
From T100_start-5 s to T100_start+5 s
Blue+Cyan dotted lines: Time interval of the scaled map
From 0.000000 to 8.192000
8 ms binning
From T100_start-3 s to T100_start+3 s
Blue+Cyan dotted lines: Time interval of the scaled map
From 0.000000 to 8.192000
2 ms binning
From T100_start-1 s to T100_start+1 s
Blue+Cyan dotted lines: Time interval of the scaled map
From 0.000000 to 8.192000
SN=5 or 10 sec. binning (whichever binning is satisfied first)
SN=5 or 10 sec. binning (T < 200 sec)
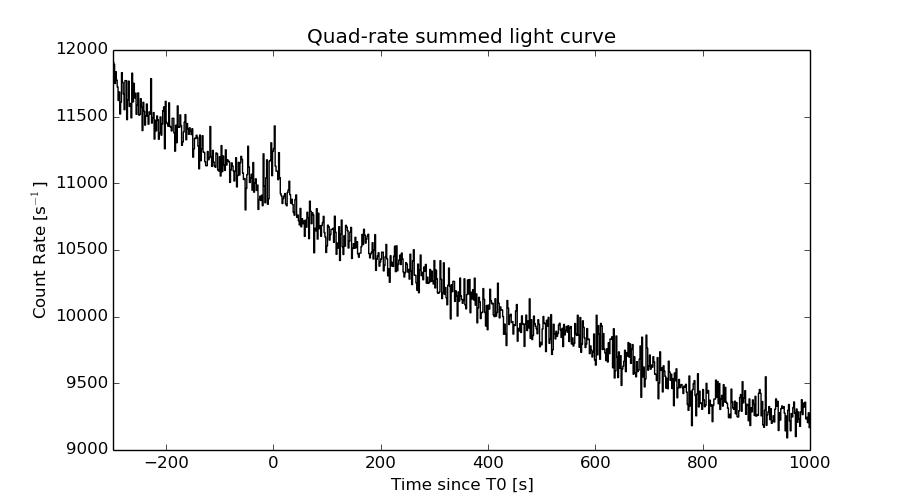
Quad-rate summed light curves (from T0-300s to T0+1000s)
Spectral Evolution
Spectra
Notes:
- 1) The fitting includes the systematic errors.
- 2) When the burst includes telescope slew time periods, the fitting uses an average response file made from multiple 5-s response files through out the slew time plus single time preiod for the non-slew times, and weighted by the total counts in the corresponding time period using addrmf. An average response file is needed becuase a spectral fit using the pre-slew DRM will introduce some errors in both a spectral shape and a normalization if the PHA file contains a lot of the slew/post-slew time interval.
- 3) For fits to more complicated models (e.g. a power-law over a cutoff power-law), the BAT team has decided to require a chi-square improvement of more than 6 for each extra dof.
Time averaged spectrum fit using the average DRM
Power-law model
Time interval is from   -9.000 sec. to   19.100 sec.

Spectral model in power-law:
------------------------------------------------------------
Parameters  : value       lower 90%   higher 90%
Photon index: 2.22991     ( -0.280834   0.307855 )
Norm@50keV  : 2.16764E-03    ( -0.000455995   0.000445367 )
------------------------------------------------------------
#Fit statistic : Chi-Squared =          72.37 using 59 PHA bins.
# Reduced chi-squared =          1.270 for     57 degrees of freedom
# Null hypothesis probability =   8.244209e-02

Photon flux (15-150 keV)    in 28.1 sec: 0.364599 ( -0.0506845  0.0506848 ) ph/cm2/s
Energy fluence (15-150 keV)             : 5.75215e-07 ( -9.961e-08  1.04133e-07 ) ergs/cm2
Cutoff power-law model

Time interval is from   -9.000 sec. to   19.100 sec.
Spectral model in the cutoff power-law:
------------------------------------------------------------
Parameters  : value       lower 90%   higher 90%
Photon index: 1.73854     ( -1.74134   0.301183 )
Epeak [keV] : 19.6648      (   )
Norm@50keV  : 4.38266E-03    (     )
------------------------------------------------------------
#Fit statistic : Chi-Squared =          71.90 using 59 PHA bins.
# Reduced chi-squared =          1.284 for     56 degrees of freedom
# Null hypothesis probability =   7.472815e-02

Photon flux (15-150 keV)    in 28.1 sec: 0.357553 ( -0.053252  0.051893 ) ph/cm2/s
Energy fluence (15-150 keV)             : 5.39593e-07 ( -1.18228e-07  1.29836e-07 ) ergs/cm2
Band function
Time interval is from   -9.000 sec. to   19.100 sec.

Spectral model in the Band function:
------------------------------------------------------------
Parameters  : value       lower 90%   higher 90%
alpha       : -1.25108   ( 1.20066   1.20066 )
beta        : -2.57964    ( 2.59021   0.589448 )
Epeak [keV] : 25.1738      ( -25.9408 9.23247 )
Norm@50keV   : 9.52997E-03    ( -0.0110223   1047.37 )
------------------------------------------------------------
#Fit statistic : Chi-Squared =          71.45 using 59 PHA bins.
# Reduced chi-squared =          1.299 for     55 degrees of freedom
# Null hypothesis probability =   6.716452e-02

Photon flux (15-150 keV)    in 28.1 sec:  (    ) ph/cm2/s
Energy fluence (15-150 keV)             : 5.43075e-07 ( 0  0 ) ergs/cm2
Single BB
Spectral model blackbody:
------------------------------------------------------------
Parameters  : value    Lower 90%  Upper 90%
kT [keV]    : 7.95384  (-1.17696  1.4028)
R^2/D10^2   : 0.403988  (-0.194413   0.371026)
(R is the radius in km and D10 is the distance to the source in units of 10 kpc)
------------------------------------------------------------
#Fit statistic : Chi-Squared =          78.89 using 59 PHA bins.
# Reduced chi-squared =          1.384 for     57 degrees of freedom
# Null hypothesis probability =   2.904661e-02

Energy  Fluence     90% Error
[keV]   [erg/cm2]   [erg/cm2]
15- 25  1.293e-07   3.588e-08
25- 50  2.240e-07   5.145e-08
50-150  5.772e-08   2.586e-08
15-150  4.111e-07   8.444e-08
Thermal bremsstrahlung (OTTB)
Spectral model: thermal bremsstrahlung
------------------------------------------------------------
Parameters  : value         Lower 90%    Upper 90%
kT [keV]    : 43.1468       (-13.8664      25.2626)
Norm        : 2.23604       (-0.538416     0.786131)
------------------------------------------------------------
#Fit statistic : Chi-Squared =          72.10 using 59 PHA bins.
# Reduced chi-squared =          1.265 for     57 degrees of freedom
# Null hypothesis probability =   8.577146e-02

Energy  Fluence     90% Error
[keV]   [erg/cm2]   [erg/cm2]
15- 25  1.478e-07   2.943e-08
25- 50  2.007e-07   3.914e-08
50-150  1.683e-07   7.102e-08
15-150  5.168e-07   1.055e-07
Double BB
Spectral model: bbodyrad<1> + bbodyrad<2>
------------------------------------------------------------
Parameters  : value         Lower 90%    Upper 90%
kT1 [keV]   : 6.24948        (-3.21031      1.74461)
R1^2/D10^2  : 0.897159        (-0.532785      11.3165)
kT2 [keV]   : 24.0255        (-15.4972      -24.046)
R2^2/D10^2  : 2.93886E-03    (-0.00290952   0.149079)
------------------------------------------------------------
#Fit statistic : Chi-Squared =          71.80 using 59 PHA bins.
# Reduced chi-squared =          1.305 for     55 degrees of freedom
# Null hypothesis probability =   6.367580e-02

Energy  Fluence     90% Error
[keV]   [erg/cm2]   [erg/cm2]
15- 25  1.468e-07   6.833e-08
25- 50  1.976e-07   9.941e-08
50-150  2.182e-07   1.368e-07
15-150  5.627e-07   2.574e-07
Peak spectrum fit
Power-law model

Time interval is from    0.772 sec. to    1.772 sec.

Spectral model in power-law:
------------------------------------------------------------
Parameters  : value       lower 90%   higher 90%
Photon index: 1.94431     ( -0.46406   0.534014 )
Norm@50keV  : 7.73783E-03    ( -0.00250112   0.00231668 )
------------------------------------------------------------
#Fit statistic : Chi-Squared =          46.60 using 59 PHA bins.
# Reduced chi-squared =         0.8176 for     57 degrees of freedom
# Null hypothesis probability =   8.356509e-01

Photon flux (15-150 keV)    in 1 sec: 1.13194 ( -0.267954  0.268051 ) ph/cm2/s
Energy fluence (15-150 keV)             : 7.11963e-08 ( -2.07663e-08  2.18811e-08 ) ergs/cm2
Cutoff power-law model
Time interval is from    0.772 sec. to    1.772 sec.
Spectral model in the cutoff power-law:
------------------------------------------------------------
Parameters  : value       lower 90%   higher 90%
Photon index: 1.94097     ( -1.55667   1.49411 )
Epeak [keV] : 316.591      (   )
Norm@50keV  : 7.74287E-03    (     )
------------------------------------------------------------
#Fit statistic : Chi-Squared =          46.61 using 59 PHA bins.
# Reduced chi-squared =         0.8322 for     56 degrees of freedom
# Null hypothesis probability =   8.102559e-01

Photon flux (15-150 keV)    in 1 sec: 1.13195 ( -0.268822  0.26779 ) ph/cm2/s
Energy fluence (15-150 keV)             : 7.09094e-08 ( -2.13374e-08  2.1928e-08 ) ergs/cm2
Band function

Time interval is from    0.772 sec. to    1.772 sec.

Spectral model in the Band function:
------------------------------------------------------------
Parameters  : value       lower 90%   higher 90%
alpha       : -4.89282   ( 4.89282   4.89282 )
beta        : -1.94433    ( -0.534012   0.464073 )
Epeak [keV] : 56.0948      ( -56.0948 -56.0948 )
Norm@50keV   : 1.05167    ( -0.339938   0.31487 )
------------------------------------------------------------
#Fit statistic : Chi-Squared =          46.60 using 59 PHA bins.
# Reduced chi-squared =         0.8473 for     55 degrees of freedom
# Null hypothesis probability =   7.825980e-01

Photon flux (15-150 keV)    in 1 sec:  (    ) ph/cm2/s
Energy fluence (15-150 keV)             : 0 ( 0  0 ) ergs/cm2
Single BB
Spectral model blackbody:
------------------------------------------------------------
Parameters  : value    Lower 90%  Upper 90%
kT [keV]    : 11.1428  (-4.14638  5.59871)
R^2/D10^2   : 0.332248  (-0.250398   1.58509)
(R is the radius in km and D10 is the distance to the source in units of 10 kpc)
------------------------------------------------------------
#Fit statistic : Chi-Squared =          54.52 using 59 PHA bins.
# Reduced chi-squared =         0.9565 for     57 degrees of freedom
# Null hypothesis probability =   5.686486e-01

Energy  Fluence     90% Error
[keV]   [erg/cm2]   [erg/cm2]
15- 25  8.641e-09   5.211e-09
25- 50  2.484e-08   1.246e-08
50-150  1.759e-08   1.206e-08
15-150  5.107e-08   2.787e-08
Thermal bremsstrahlung (OTTB)
Spectral model: thermal bremsstrahlung
------------------------------------------------------------
Parameters  : value         Lower 90%    Upper 90%
kT [keV]    : 82.3707       (-46.443      -82.3711)
Norm        : 5.20189       (-1.55573     2.79398)
------------------------------------------------------------
#Fit statistic : Chi-Squared =          47.35 using 59 PHA bins.
# Reduced chi-squared =         0.8307 for     57 degrees of freedom
# Null hypothesis probability =   8.152362e-01

Energy  Fluence     90% Error
[keV]   [erg/cm2]   [erg/cm2]
15- 25  1.352e-08   7.752e-09
25- 50  2.241e-08   1.296e-08
50-150  3.226e-08   2.611e-08
15-150  6.820e-08   4.007e-08
Double BB
Spectral model: bbodyrad<1> + bbodyrad<2>
------------------------------------------------------------
Parameters  : value         Lower 90%    Upper 90%
kT1 [keV]   : 3.99948        (-1.74124      2.62002)
R1^2/D10^2  : 14.9425        (-13.276      334.956)
kT2 [keV]   : 19.3224        (-6.87176      16.5562)
R2^2/D10^2  : 3.73199E-02    (-0.0328846   0.0645795)
------------------------------------------------------------
#Fit statistic : Chi-Squared =          45.32 using 59 PHA bins.
# Reduced chi-squared =         0.8240 for     55 degrees of freedom
# Null hypothesis probability =   8.209594e-01

Energy  Fluence     90% Error
[keV]   [erg/cm2]   [erg/cm2]
15- 25  1.630e-08   9.285e-09
25- 50  1.815e-08   9.675e-09
50-150  3.652e-08   2.355e-08
15-150  7.097e-08   3.667e-08
Pre-slew spectrum (Pre-slew PHA with pre-slew DRM)
Power-law model
Spectral model in power-law:
------------------------------------------------------------
Parameters  : value       lower 90%   higher 90%
Photon index: 2.22991     ( -0.280834   0.307855 )
Norm@50keV  : 2.16764E-03    ( -0.000455995   0.000445367 )
------------------------------------------------------------
#Fit statistic : Chi-Squared =          72.37 using 59 PHA bins.
# Reduced chi-squared =          1.270 for     57 degrees of freedom
# Null hypothesis probability =   8.244209e-02

Photon flux (15-150 keV)    in 28.1 sec: 0.364599 ( -0.0506845  0.0506848 ) ph/cm2/s
Energy fluence (15-150 keV)             : 5.75215e-07 ( -9.961e-08  1.04133e-07 ) ergs/cm2
Cutoff power-law model

Spectral model in the cutoff power-law:
------------------------------------------------------------
Parameters  : value       lower 90%   higher 90%
Photon index: 1.73854     ( -1.74134   0.301183 )
Epeak [keV] : 19.6648      (   )
Norm@50keV  : 4.38266E-03    (     )
------------------------------------------------------------
#Fit statistic : Chi-Squared =          71.90 using 59 PHA bins.
# Reduced chi-squared =          1.284 for     56 degrees of freedom
# Null hypothesis probability =   7.472815e-02

Photon flux (15-150 keV)    in 28.1 sec: 0.357553 ( -0.053252  0.051893 ) ph/cm2/s
Energy fluence (15-150 keV)             : 5.39593e-07 ( -1.18228e-07  1.29836e-07 ) ergs/cm2
Band function

Spectral model in the Band function:
------------------------------------------------------------
Parameters  : value       lower 90%   higher 90%
alpha       : -1.25108   ( 1.20066   1.20066 )
beta        : -2.57964    ( 2.59021   0.589448 )
Epeak [keV] : 25.1738      ( -25.9408 9.23247 )
Norm@50keV   : 9.52997E-03    ( -0.0110223   1157.45 )
------------------------------------------------------------
#Fit statistic : Chi-Squared =          71.45 using 59 PHA bins.
# Reduced chi-squared =          1.299 for     55 degrees of freedom
# Null hypothesis probability =   6.716452e-02

Photon flux (15-150 keV)    in 28.1 sec:  (    ) ph/cm2/s
Energy fluence (15-150 keV)             : 5.43075e-07 ( 0  0 ) ergs/cm2
S(25-50 keV) vs. S(50-100 keV) plot
S(25-50 keV)  = 1.83e-07
S(50-100 keV) = 1.56e-07
T90 vs. Hardness ratio plot
T90                                   = 23.2119999527931 sec.
Hardness ratio (energy fluence ratio) = 0.852459
Color vs. Color plot
Count Ratio  (25-50 keV) / (15-25 keV) = 1.00299
Count Ratio (50-100 keV) / (15-25 keV) = 0.358958
Mask shadow pattern
IMX = 5.700477327966055E-01, IMY = 5.416741843497430E-01
TIME vs. PHA plot around the trigger time
Blue+Cyan dotted lines: Time interval of the scaled map
From 0.000000 to 8.192000
TIME vs. DetID plot around the trigger time
Blue+Cyan dotted lines: Time interval of the scaled map
From 0.000000 to 8.192000
100 us light curve (15-350 keV)
Blue+Cyan dotted lines: Time interval of the scaled map
From 0.000000 to 8.192000
Spacecraft aspect plot

Bright source in the pre-burst/pre-slew/post-slew images
Pre-burst image of 15-350 keV band
Time interval of the image:
-239.664000 -9.000000

# RAcent  DECcent POSerr Theta    Phi  PeakCts   SNR AngSep     Name
#  [deg]    [deg]    ['] [deg]  [deg]                   [']
170.5846 -60.6217    4.6  29.8 -154.1   0.6390   2.5    7.9	Cen X-3
186.5075 -62.8260    2.1  22.0 -154.9   1.4389   5.6    5.3	GX 301-2
244.9895 -15.6370    0.4  43.3  -12.0   9.8029  26.5    0.6	Sco X-1
255.9867 -37.8443 2387.6  25.8   18.7   0.0010   0.0    0.0	4U 1700-377
256.4363 -36.4195   75.4  27.2   17.8   0.0388   0.2    0.2	GX 349+2
262.8972 -24.5687    0.0  40.3   16.3   0.4607   1.2   12.2	GX 1+4
264.6259 -44.5837   86.0  24.7   40.6   0.0373   0.1    9.5	4U 1735-44
270.4108 -25.0113    7.9  43.2   25.7   0.7541   1.5    8.0	GX 5-1
270.4371 -25.7776    3.6  42.5   26.3   1.6191   3.2    7.6	GRS 1758-258
275.9282 -30.2282    4.6  41.4   36.0   1.3329   2.5    8.3	H1820-303
263.1303 -34.0089    0.0  32.2   24.6   0.7777   2.5   12.6	GX 354-0
111.0452 -53.8029    3.0  58.3 -175.5   5.9858   3.8 ------	UNKNOWN
120.8609 -48.6194    2.9  59.0 -166.1   6.9386   4.0 ------	UNKNOWN
Pre-slew background subtracted image of 15-350 keV band
Time interval of the image:
-9.000000 19.100000

# RAcent  DECcent POSerr Theta    Phi  PeakCts   SNR AngSep     Name
#  [deg]    [deg]    ['] [deg]  [deg]                   [']
170.6217 -60.7374    0.0  29.8 -154.4  -0.0108  -0.1   11.3	Cen X-3
186.7446 -62.7017    6.5  21.9 -154.6   0.1249   1.8    4.8	GX 301-2
244.9402 -15.4732    4.4  43.5  -12.1  -0.2987  -2.7   10.3	Sco X-1
255.8958 -37.8512    7.6  25.8   18.6  -0.1170  -1.5    4.3	4U 1700-377
256.2369 -36.5338    0.0  27.1   17.6  -0.0942  -1.2   11.7	GX 349+2
263.0106 -24.7384  177.6  40.2   16.6  -0.0073  -0.1    0.4	GX 1+4
264.8656 -44.3726    4.3  25.0   40.5   0.2146   2.7    7.0	4U 1735-44
270.1459 -24.9383    3.9  43.1   25.3   0.4206   2.9   11.3	GX 5-1
270.2612 -25.6089    7.1  42.6   26.0   0.2388   1.6    8.4	GRS 1758-258
275.7489 -30.2096    0.0  41.4   35.8   0.2702   1.8   13.1	H1820-303
262.9029 -33.9481    7.4  32.1   24.2  -0.1483  -1.6    8.0	GX 354-0
223.3108 -19.7241    1.1  38.2  -43.5   1.1572  10.1 ------	UNKNOWN
176.5594 -33.4647    2.7  43.2 -112.6   1.1997   4.2 ------	UNKNOWN
Post-slew image of 15-350 keV band
Time interval of the image:
-239.664000 962.409800

# RAcent  DECcent POSerr Theta    Phi  PeakCts   SNR AngSep     Name
#  [deg]    [deg]    ['] [deg]  [deg]                   [']
170.3990 -60.6859    3.6  29.9 -154.3   2.7954   3.2    4.5	Cen X-3
186.5820 -62.8087    1.6  22.0 -154.9   6.4255   7.1    3.1	GX 301-2
244.9881 -15.6383    0.3  43.3  -12.0  48.1737  37.8    0.5	Sco X-1
256.1170 -38.0256    0.0  25.7   19.2   1.8952   2.2   12.5	4U 1700-377
256.4360 -36.4192   11.3  27.2   17.8   0.9148   1.0    0.2	GX 349+2
263.1291 -24.7699   16.9  40.2   16.8  -0.8545  -0.7    6.7	GX 1+4
264.7228 -44.5268    7.3  24.8   40.6   1.6172   1.6    4.7	4U 1735-44
270.3846 -25.0465    9.4  43.1   25.7   2.0539   1.2    5.8	GX 5-1
270.4353 -25.7674    2.3  42.5   26.3   7.9435   4.9    7.3	GRS 1758-258
275.8712 -30.2223    5.2  41.4   35.9   3.9928   2.2    9.1	H1820-303
262.9872 -33.8587   17.7  32.3   24.2   0.6738   0.7    1.4	GX 354-0
259.0499 -36.8240    2.5  28.0   22.1   4.0354   4.6 ------	UNKNOWN
260.9477  -7.6031    2.4  55.3    5.1  18.7592   4.7 ------	UNKNOWN
110.9747 -53.8403    4.6  58.3 -175.5  15.6440   2.5 ------	UNKNOWN
120.7813 -48.6394    3.2  59.1 -166.2  26.4519   3.6 ------	UNKNOWN
230.1477  -3.0230    2.9  54.5  -33.0  19.0423   4.0 ------	UNKNOWN
221.0080  -7.4099    3.3  50.7  -44.8  14.7335   3.5 ------	UNKNOWN
Plot creation:
Sat May 30 21:30:32 EDT 2015