Click here for the BAT GCN circular template
Image
Pre-slew 15.0-350.0 keV image (Event data)
#   RAcent    DECcent   POSerr    Theta     Phi              Peak Cts       SNR   Name
   60.4377   -32.7078   0.0085    45.6811   139.4474         5.0664471     22.870 TRIG_00505054

Foreground time interval of the image:
 -2.636  12.173 (delta_t =  14.809 [sec])
Background time interval of the image:
-239.728  -2.636 (delta_t = 237.092 [sec])
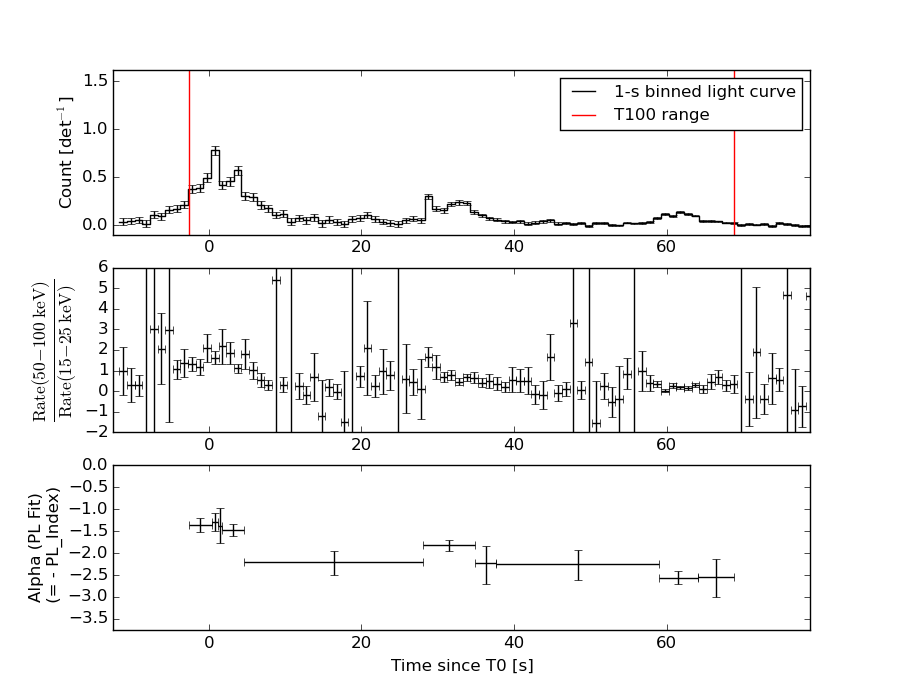
Lightcurves
Notes:
- 1) The mask-weighted light curves are using the flight position.
- 2) Multiple plots of different time binning/intervals are shown to cover all scenarios of short/long GRBs, rate/image triggers, and real/false positives.
- 3) For all the mask-weighted lightcurves, the y-axis units are counts/sec/det where a det is 0.4 x 0.4 = 0.16 sq cm.
- 4) The verticle lines correspond to following: green dotted lines are T50 interval, black dotted lines are T90 interval, blue solid line(s) is a spacecraft slew start time, and orange solid line(s) is a spacecraft slew end time.
- 5) Time of each bin is in the middle of the bin.
1 s binning
From T0-310 s to T0+310 s

From T100_start - 20 s to T100_end + 30 s

Full time interval

64 ms binning
Full time interval
From T100_start to T100_end
From T0-5 sec to T0+5 sec
16 ms binning
From T100_start-5 s to T100_start+5 s

Blue+Cyan dotted lines: Time interval of the scaled map
From 0.000000 to 1.024000
8 ms binning
From T100_start-3 s to T100_start+3 s

Blue+Cyan dotted lines: Time interval of the scaled map
From 0.000000 to 1.024000
2 ms binning
From T100_start-1 s to T100_start+1 s
Blue+Cyan dotted lines: Time interval of the scaled map
From 0.000000 to 1.024000
SN=5 or 10 sec. binning (whichever binning is satisfied first)
SN=5 or 10 sec. binning (T < 200 sec)

Quad-rate summed light curves (from T0-300s to T0+1000s)
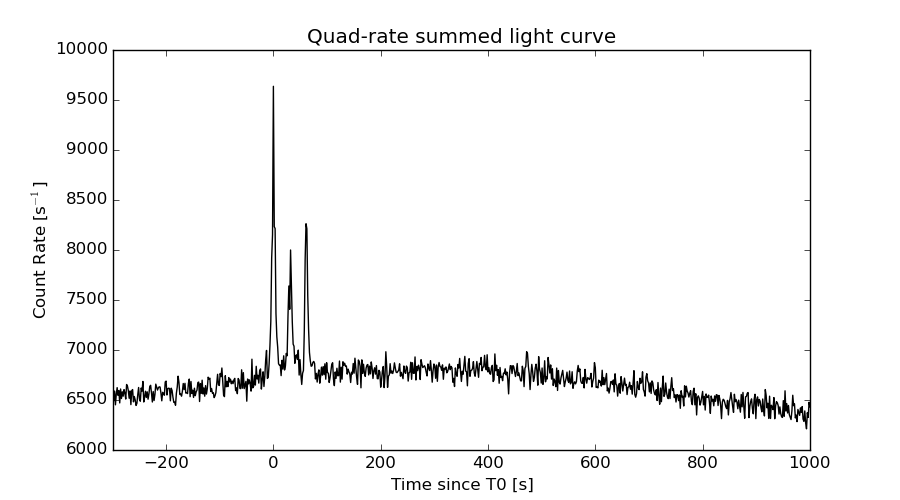
The mask-weighted light curves based on cleaned DPHs

Spectral Evolution
Spectra
Notes:
- 1) The fitting includes the systematic errors.
- 2) When the burst includes telescope slew time periods, the fitting uses an average response file made from multiple 5-s response files through out the slew time plus single time preiod for the non-slew times, and weighted by the total counts in the corresponding time period using addrmf. An average response file is needed becuase a spectral fit using the pre-slew DRM will introduce some errors in both a spectral shape and a normalization if the PHA file contains a lot of the slew/post-slew time interval.
- 3) For fits to more complicated models (e.g. a power-law over a cutoff power-law), the BAT team has decided to require a chi-square improvement of more than 6 for each extra dof.
Time averaged spectrum fit using the average DRM
Power-law model

Time interval is from   -2.636 sec. to   68.788 sec.

Spectral model in power-law:
------------------------------------------------------------
Parameters  : value       lower 90%   higher 90%
Photon index: 1.81649     ( -0.0855838   0.0867478 )
Norm@50keV  : 7.90984E-03    ( -0.000389179   0.000386842 )
------------------------------------------------------------
#Fit statistic : Chi-Squared =          49.77 using 59 PHA bins.
# Reduced chi-squared =         0.8731 for     57 degrees of freedom
# Null hypothesis probability =   7.405679e-01

Photon flux (15-150 keV)    in 71.42 sec: 1.09701 ( -0.0525975  0.0527164 ) ph/cm2/s
Energy fluence (15-150 keV)             : 5.19796e-06 ( -2.59356e-07  2.60465e-07 ) ergs/cm2
Cutoff power-law model

Time interval is from   -2.636 sec. to   68.788 sec.
Spectral model in the cutoff power-law:
------------------------------------------------------------
Parameters  : value       lower 90%   higher 90%
Photon index: 1.69746     ( -0.340919   0.330563 )
Epeak [keV] : 122.519      ( -59.4084 -122.575 )
Norm@50keV  : 9.11670E-03    ( -0.0013253   0.00445073 )
------------------------------------------------------------
#Fit statistic : Chi-Squared =          49.37 using 59 PHA bins.
# Reduced chi-squared =         0.8817 for     56 degrees of freedom
# Null hypothesis probability =   7.220665e-01

Photon flux (15-150 keV)    in 71.42 sec: 1.08921 ( -0.05626  0.02826 ) ph/cm2/s
Energy fluence (15-150 keV)             : 5.14838e-06 ( -2.957e-07  2.91808e-07 ) ergs/cm2
Band function

Time interval is from   -2.636 sec. to   68.788 sec.

Spectral model in the Band function:
------------------------------------------------------------
Parameters  : value       lower 90%   higher 90%
alpha       : -7.33776E-02   ( -2.40664   3.85004 )
beta        : -1.92937    ( -0.147205   0.129513 )
Epeak [keV] : 33.8706      ( -9.15859 34.9952 )
Norm@50keV   : 0.114018    ( -0.113273   152.981 )
------------------------------------------------------------
#Fit statistic : Chi-Squared =          45.58 using 59 PHA bins.
# Reduced chi-squared =         0.8287 for     55 degrees of freedom
# Null hypothesis probability =   8.135480e-01

Photon flux (15-150 keV)    in 71.42 sec:  (    ) ph/cm2/s
Energy fluence (15-150 keV)             : 5.07243e-06 ( -5.07193e-06  -2.77938e-07 ) ergs/cm2
Single BB

Spectral model blackbody:
------------------------------------------------------------
Parameters  : value    Lower 90%  Upper 90%
kT [keV]    : 12.1071  (  )
R^2/D10^2   : 0.243385  (   )
(R is the radius in km and D10 is the distance to the source in units of 10 kpc)
------------------------------------------------------------
#Fit statistic : Chi-Squared =         174.85 using 59 PHA bins.
# Reduced chi-squared =         3.0675 for     57 degrees of freedom
# Null hypothesis probability =   6.750156e-14

Energy  Fluence     90% Error
[keV]   [erg/cm2]   [erg/cm2]
15- 25  5.393e-07   4.514e-08
25- 50  1.715e-06   8.785e-08
50-150  1.520e-06   1.686e-07
15-150  3.775e-06   2.035e-07
Thermal bremsstrahlung (OTTB)

Spectral model: thermal bremsstrahlung
------------------------------------------------------------
Parameters  : value         Lower 90%    Upper 90%
kT [keV]    : 99.9632       (-12.4206      31.4878)
Norm        : 4.79126       (-0.409685     0.287028)
------------------------------------------------------------
#Fit statistic : Chi-Squared =          53.20 using 59 PHA bins.
# Reduced chi-squared =         0.9333 for     57 degrees of freedom
# Null hypothesis probability =   6.184518e-01

Energy  Fluence     90% Error
[keV]   [erg/cm2]   [erg/cm2]
15- 25  8.944e-07   7.713e-08
25- 50  1.546e-06   8.749e-08
50-150  2.506e-06   6.846e-07
15-150  4.946e-06   7.299e-07
Double BB

Spectral model: bbodyrad<1> + bbodyrad<2>
------------------------------------------------------------
Parameters  : value         Lower 90%    Upper 90%
kT1 [keV]   : 7.05510        (-0.785941      0.836239)
R1^2/D10^2  : 1.37516        (-0.444724      0.723364)
kT2 [keV]   : 27.5658        (-4.5156      7.07867)
R2^2/D10^2  : 8.60415E-03    (-0.00466248   0.00806269)
------------------------------------------------------------
#Fit statistic : Chi-Squared =          45.02 using 59 PHA bins.
# Reduced chi-squared =         0.8185 for     55 degrees of freedom
# Null hypothesis probability =   8.294024e-01

Energy  Fluence     90% Error
[keV]   [erg/cm2]   [erg/cm2]
15- 25  8.685e-07   1.196e-07
25- 50  1.558e-06   1.611e-07
50-150  2.710e-06   6.506e-07
15-150  5.137e-06   8.038e-07
Peak spectrum fit
Power-law model

Time interval is from    0.044 sec. to    1.044 sec.

Spectral model in power-law:
------------------------------------------------------------
Parameters  : value       lower 90%   higher 90%
Photon index: 1.25893     ( -0.184942   0.182546 )
Norm@50keV  : 5.42177E-02    ( -0.00594418   0.00594416 )
------------------------------------------------------------
#Fit statistic : Chi-Squared =          68.24 using 59 PHA bins.
# Reduced chi-squared =          1.197 for     57 degrees of freedom
# Null hypothesis probability =   1.464039e-01

Photon flux (15-150 keV)    in 1 sec: 6.42187 ( -0.73032  0.731948 ) ph/cm2/s
Energy fluence (15-150 keV)             : 5.41344e-07 ( -6.44109e-08  6.47456e-08 ) ergs/cm2
Cutoff power-law model

Time interval is from    0.044 sec. to    1.044 sec.
Spectral model in the cutoff power-law:
------------------------------------------------------------
Parameters  : value       lower 90%   higher 90%
Photon index: 1.01167     ( -0.730325   0.346306 )
Epeak [keV] : 212.693      ( -212.745 -212.745 )
Norm@50keV  : 7.15550E-02    ( -0.0266655   0.0869649 )
------------------------------------------------------------
#Fit statistic : Chi-Squared =          67.81 using 59 PHA bins.
# Reduced chi-squared =          1.211 for     56 degrees of freedom
# Null hypothesis probability =   1.338923e-01

Photon flux (15-150 keV)    in 1 sec: 6.37577 ( -0.7391  0.74073 ) ph/cm2/s
Energy fluence (15-150 keV)             : 5.34825e-07 ( -6.8582e-08  6.7367e-08 ) ergs/cm2
Band function
Time interval is from    0.044 sec. to    1.044 sec.

Spectral model in the Band function:
------------------------------------------------------------
Parameters  : value       lower 90%   higher 90%
alpha       : 5.00000   ( -14.2971   -5 )
beta        : -1.49618    ( -0.31282   0.242483 )
Epeak [keV] : 31.8943      ( -6.74956 5.63055 )
Norm@50keV   : 1167.76    ( -126.263   3574.94 )
------------------------------------------------------------
#Fit statistic : Chi-Squared =          61.93 using 59 PHA bins.
# Reduced chi-squared =          1.126 for     55 degrees of freedom
# Null hypothesis probability =   2.425901e-01

Photon flux (15-150 keV)    in 1 sec:  (    ) ph/cm2/s
Energy fluence (15-150 keV)             : 0 ( 0  0 ) ergs/cm2
Single BB

Spectral model blackbody:
------------------------------------------------------------
Parameters  : value    Lower 90%  Upper 90%
kT [keV]    : 17.3948  (-2.8162  3.4322)
R^2/D10^2   : 0.459682  (-0.205893   0.374011)
(R is the radius in km and D10 is the distance to the source in units of 10 kpc)
------------------------------------------------------------
#Fit statistic : Chi-Squared =          88.60 using 59 PHA bins.
# Reduced chi-squared =          1.554 for     57 degrees of freedom
# Null hypothesis probability =   4.645858e-03

Energy  Fluence     90% Error
[keV]   [erg/cm2]   [erg/cm2]
15- 25  2.814e-08   6.545e-09
25- 50  1.268e-07   2.391e-08
50-150  2.759e-07   6.130e-08
15-150  4.308e-07   6.895e-08
Thermal bremsstrahlung (OTTB)

Spectral model: thermal bremsstrahlung
------------------------------------------------------------
Parameters  : value         Lower 90%    Upper 90%
kT [keV]    : 200.000       (      )
Norm        : 26.8109       (-2.9829     2.98269)
------------------------------------------------------------
#Fit statistic : Chi-Squared =          74.65 using 59 PHA bins.
# Reduced chi-squared =          1.310 for     57 degrees of freedom
# Null hypothesis probability =   5.837821e-02

Energy  Fluence     90% Error
[keV]   [erg/cm2]   [erg/cm2]
15- 25  6.678e-08   2.305e-08
25- 50  1.285e-07   7.015e-08
50-150  2.817e-07   1.538e-07
15-150  4.770e-07   2.462e-07
Double BB

Spectral model: bbodyrad<1> + bbodyrad<2>
------------------------------------------------------------
Parameters  : value         Lower 90%    Upper 90%
kT1 [keV]   : 9.29163        (-1.98496      1.87702)
R1^2/D10^2  : 2.78961        (-1.46259      2.50017)
kT2 [keV]   : 45.2347        (-16.3042      134.648)
R2^2/D10^2  : 1.65852E-02    (-0.0139367   0.0501527)
------------------------------------------------------------
#Fit statistic : Chi-Squared =          62.01 using 59 PHA bins.
# Reduced chi-squared =          1.127 for     55 degrees of freedom
# Null hypothesis probability =   2.405067e-01

Energy  Fluence     90% Error
[keV]   [erg/cm2]   [erg/cm2]
15- 25  5.163e-08   2.232e-08
25- 50  1.345e-07   5.269e-08
50-150  3.557e-07   1.823e-07
15-150  5.419e-07   2.361e-07
Pre-slew spectrum (Pre-slew PHA with pre-slew DRM)
Power-law model

Spectral model in power-law:
------------------------------------------------------------
Parameters  : value       lower 90%   higher 90%
Photon index: 1.55710     ( -0.0953858   0.095841 )
Norm@50keV  : 2.30627E-02    ( -0.00129996   0.00129773 )
------------------------------------------------------------
#Fit statistic : Chi-Squared =          65.01 using 59 PHA bins.
# Reduced chi-squared =          1.141 for     57 degrees of freedom
# Null hypothesis probability =   2.178019e-01

Photon flux (15-150 keV)    in 14.81 sec: 2.92564 ( -0.170131  0.17043 ) ph/cm2/s
Energy fluence (15-150 keV)             : 3.21226e-06 ( -1.92893e-07  1.93484e-07 ) ergs/cm2
Cutoff power-law model

Spectral model in the cutoff power-law:
------------------------------------------------------------
Parameters  : value       lower 90%   higher 90%
Photon index: 1.25020     ( -0.397238   0.344633 )
Epeak [keV] : 124.354      ( -44.1598 -124.356 )
Norm@50keV  : 3.28644E-02    ( -0.0103898   0.0185805 )
------------------------------------------------------------
#Fit statistic : Chi-Squared =          62.98 using 59 PHA bins.
# Reduced chi-squared =          1.125 for     56 degrees of freedom
# Null hypothesis probability =   2.430331e-01

Photon flux (15-150 keV)    in 14.81 sec: 2.88756 ( -0.17575  0.17598 ) ph/cm2/s
Energy fluence (15-150 keV)             : 3.15296e-06 ( -2.08999e-07  2.07533e-07 ) ergs/cm2
Band function

Spectral model in the Band function:
------------------------------------------------------------
Parameters  : value       lower 90%   higher 90%
alpha       : 2.05035   ( -1.40217   4.10258 )
beta        : -1.73883    ( -0.173161   0.144462 )
Epeak [keV] : 33.8275      ( -9.181 14.0437 )
Norm@50keV   : 6.06427    ( -6.06443   348.429 )
------------------------------------------------------------
#Fit statistic : Chi-Squared =          55.40 using 59 PHA bins.
# Reduced chi-squared =          1.007 for     55 degrees of freedom
# Null hypothesis probability =   4.596853e-01

Photon flux (15-150 keV)    in 14.81 sec:  (    ) ph/cm2/s
Energy fluence (15-150 keV)             : 3.12066e-06 ( -3.12056e-06  -1.95477e-07 ) ergs/cm2
S(25-50 keV) vs. S(50-100 keV) plot
S(25-50 keV)  = 1.47e-06
S(50-100 keV) = 1.67e-06
T90 vs. Hardness ratio plot

T90                                   = 62.8479999303818 sec.
Hardness ratio (energy fluence ratio) = 1.13605
Color vs. Color plot
Count Ratio  (25-50 keV) / (15-25 keV) = 1.31174
Count Ratio (50-100 keV) / (15-25 keV) = 0.82054
Mask shadow pattern

IMX = -7.780904702911140E-01, IMY = -6.657892182733026E-01
TIME vs. PHA plot around the trigger time
Blue+Cyan dotted lines: Time interval of the scaled map
From 0.000000 to 1.024000
TIME vs. DetID plot around the trigger time
Blue+Cyan dotted lines: Time interval of the scaled map
From 0.000000 to 1.024000
100 us light curve (15-350 keV)

Blue+Cyan dotted lines: Time interval of the scaled map
From 0.000000 to 1.024000
Spacecraft aspect plot

Bright source in the pre-burst/pre-slew/post-slew images
Pre-burst image of 15-350 keV band
Time interval of the image:
-239.728000 -2.636000

# RAcent  DECcent POSerr Theta    Phi  PeakCts   SNR AngSep     Name
#  [deg]    [deg]    ['] [deg]  [deg]                   [']
 31.8570 -39.6562    2.8  33.3  106.5   1.5645   4.2 ------	UNKNOWN
 47.4952 -61.1413    2.6  16.3  148.5   0.7845   4.5 ------	UNKNOWN
303.9087 -37.2138    3.4  49.3   -2.7   1.3780   3.4 ------	UNKNOWN
294.7679 -53.9718    3.1  37.1  -22.1   0.8511   3.7 ------	UNKNOWN
114.4976 -35.5144    3.2  59.1 -166.1   4.4739   3.6 ------	UNKNOWN
192.4066 -77.7178    2.5  30.3  -97.9   1.2993   4.7 ------	UNKNOWN
Pre-slew background subtracted image of 15-350 keV band
Time interval of the image:
-2.636000 12.172600

# RAcent  DECcent POSerr Theta    Phi  PeakCts   SNR AngSep     Name
#  [deg]    [deg]    ['] [deg]  [deg]                   [']
 60.4377 -32.7078    0.5  45.7  139.4   5.0665  22.9 ------	UNKNOWN
 13.9409 -42.0485    2.4  29.9   81.0   0.4162   4.9 ------	UNKNOWN
284.5861 -34.9864    1.9  57.3  -19.7   1.0849   5.9 ------	UNKNOWN
281.4736 -33.8542    1.9  59.3  -22.0   1.4178   5.9 ------	UNKNOWN
Post-slew image of 15-350 keV band
Time interval of the image:
80.172600 962.308800

# RAcent  DECcent POSerr Theta    Phi  PeakCts   SNR AngSep     Name
#  [deg]    [deg]    ['] [deg]  [deg]                   [']
 65.3180  18.9413    2.8  51.9  153.5  10.2703   4.1 ------	UNKNOWN
 99.9367  12.8206    3.0  59.1 -166.0  13.1385   3.9 ------	UNKNOWN
 66.0306 -75.5682    2.7  42.9  -34.3   3.6012   4.3 ------	UNKNOWN
110.9752 -58.7295    3.8  42.3  -68.8   7.0719   3.0 ------	UNKNOWN
Plot creation:
Sat May 30 21:28:44 EDT 2015