Click here for the BAT GCN circular template
Image
Pre-slew 15.0-350.0 keV image (Event data)

#   RAcent    DECcent   POSerr    Theta     Phi              Peak Cts       SNR   Name
  153.8310    27.4722   0.0188    32.1492    15.4431         1.3166812     10.234 TRIG_00505646

Foreground time interval of the image:
 35.444 112.301 (delta_t =  76.857 [sec])
Background time interval of the image:
-656.599 -640.504 (delta_t =  16.095 [sec])
-239.000  35.444 (delta_t = 274.444 [sec])
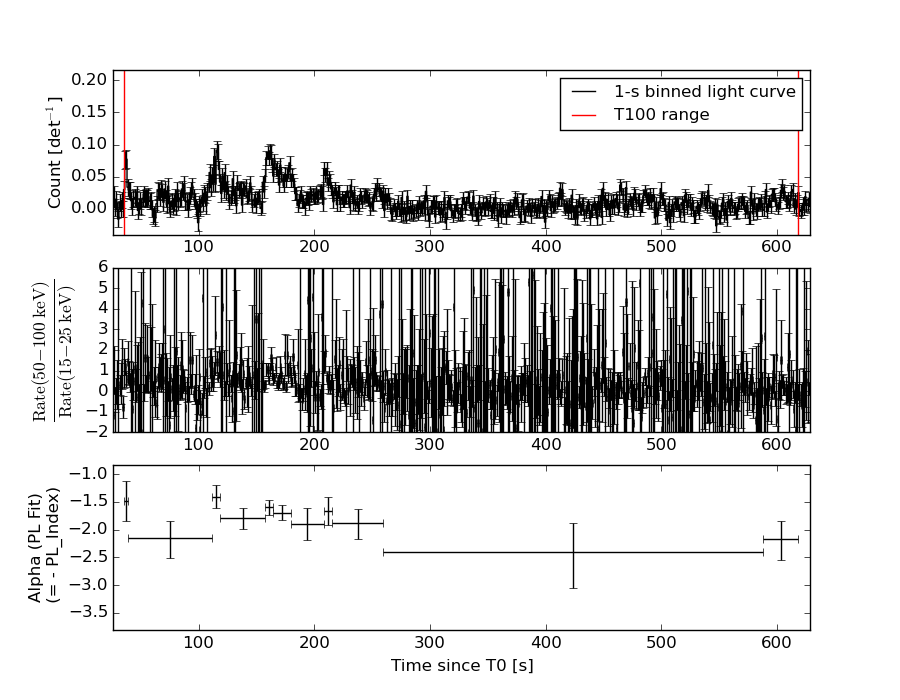
Lightcurves
Notes:
- 1) The mask-weighted light curves are using the flight position.
- 2) Multiple plots of different time binning/intervals are shown to cover all scenarios of short/long GRBs, rate/image triggers, and real/false positives.
- 3) For all the mask-weighted lightcurves, the y-axis units are counts/sec/det where a det is 0.4 x 0.4 = 0.16 sq cm.
- 4) The verticle lines correspond to following: green dotted lines are T50 interval, black dotted lines are T90 interval, blue solid line(s) is a spacecraft slew start time, and orange solid line(s) is a spacecraft slew end time.
- 5) Time of each bin is in the middle of the bin.
1 s binning
From T0-310 s to T0+310 s

From T100_start - 20 s to T100_end + 30 s
Full time interval

64 ms binning
Full time interval
From T100_start to T100_end
From T0-5 sec to T0+5 sec

16 ms binning
From T100_start-5 s to T100_start+5 s
8 ms binning
From T100_start-3 s to T100_start+3 s

2 ms binning
From T100_start-1 s to T100_start+1 s

SN=5 or 10 sec. binning (whichever binning is satisfied first)
SN=5 or 10 sec. binning (T < 200 sec)

Quad-rate summed light curves (from T0-300s to T0+1000s)
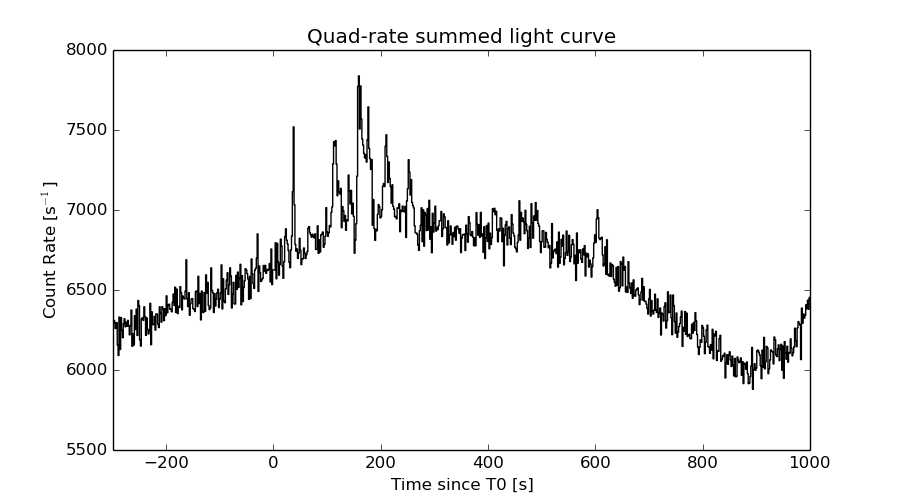
The mask-weighted light curves based on cleaned DPHs

Spectral Evolution
Spectra
Notes:
- 1) The fitting includes the systematic errors.
- 2) When the burst includes telescope slew time periods, the fitting uses an average response file made from multiple 5-s response files through out the slew time plus single time preiod for the non-slew times, and weighted by the total counts in the corresponding time period using addrmf. An average response file is needed becuase a spectral fit using the pre-slew DRM will introduce some errors in both a spectral shape and a normalization if the PHA file contains a lot of the slew/post-slew time interval.
- 3) For fits to more complicated models (e.g. a power-law over a cutoff power-law), the BAT team has decided to require a chi-square improvement of more than 6 for each extra dof.
Time averaged spectrum fit using the average DRM
Power-law model

Time interval is from   35.444 sec. to  618.580 sec.

Spectral model in power-law:
------------------------------------------------------------
Parameters  : value       lower 90%   higher 90%
Photon index: 1.90940     ( -0.118481   0.121234 )
Norm@50keV  : 7.27698E-04    ( -5.12663e-05   5.05068e-05 )
------------------------------------------------------------
#Fit statistic : Chi-Squared =          43.50 using 59 PHA bins.
# Reduced chi-squared =         0.7632 for     57 degrees of freedom
# Null hypothesis probability =   9.060429e-01

Photon flux (15-150 keV)    in 583.1 sec: 0.104851 ( -0.00621083  0.0062213 ) ph/cm2/s
Energy fluence (15-150 keV)             : 3.90145e-06 ( -2.67743e-07  2.71048e-07 ) ergs/cm2
Cutoff power-law model

Time interval is from   35.444 sec. to  618.580 sec.
Spectral model in the cutoff power-law:
------------------------------------------------------------
Parameters  : value       lower 90%   higher 90%
Photon index: 2.03150     (     )
Epeak [keV] : 14.8476      (   )
Norm@50keV  : 6.23135E-04    (     )
------------------------------------------------------------
#Fit statistic : Chi-Squared =          42.86 using 59 PHA bins.
# Reduced chi-squared =         0.7654 for     56 degrees of freedom
# Null hypothesis probability =   9.015292e-01

Photon flux (15-150 keV)    in 583.1 sec: 0.104806 (    ) ph/cm2/s
Energy fluence (15-150 keV)             : 3.8891e-06 ( -2.592e-07  2.77987e-07 ) ergs/cm2
Band function

Time interval is from   35.444 sec. to  618.580 sec.

Spectral model in the Band function:
------------------------------------------------------------
Parameters  : value       lower 90%   higher 90%
alpha       : 4.97759   ( -4.97759   -4.97759 )
beta        : -1.93067    ( -0.128972   0.123663 )
Epeak [keV] : 18.6176      ( -18.6176 3.66302 )
Norm@50keV   : 717.544    ( -41.6064   761176 )
------------------------------------------------------------
#Fit statistic : Chi-Squared =          43.05 using 59 PHA bins.
# Reduced chi-squared =         0.7827 for     55 degrees of freedom
# Null hypothesis probability =   8.789478e-01

Photon flux (15-150 keV)    in 583.1 sec:  (    ) ph/cm2/s
Energy fluence (15-150 keV)             : 0 ( 0  0 ) ergs/cm2
Single BB

Spectral model blackbody:
------------------------------------------------------------
Parameters  : value    Lower 90%  Upper 90%
kT [keV]    : 10.6784  (  )
R^2/D10^2   : 3.58322E-02  (   )
(R is the radius in km and D10 is the distance to the source in units of 10 kpc)
------------------------------------------------------------
#Fit statistic : Chi-Squared =         133.65 using 59 PHA bins.
# Reduced chi-squared =         2.3448 for     57 degrees of freedom
# Null hypothesis probability =   4.248126e-08

Energy  Fluence     90% Error
[keV]   [erg/cm2]   [erg/cm2]
15- 25  4.946e-07   5.507e-08
25- 50  1.345e-06   8.834e-08
50-150  8.465e-07   1.405e-07
15-150  2.686e-06   2.032e-07
Thermal bremsstrahlung (OTTB)

Spectral model: thermal bremsstrahlung
------------------------------------------------------------
Parameters  : value         Lower 90%    Upper 90%
kT [keV]    : 84.9480       (-17.5157      25.6466)
Norm        : 0.472987       (-0.0440391     0.0516405)
------------------------------------------------------------
#Fit statistic : Chi-Squared =          51.94 using 59 PHA bins.
# Reduced chi-squared =         0.9112 for     57 degrees of freedom
# Null hypothesis probability =   6.649320e-01

Energy  Fluence     90% Error
[keV]   [erg/cm2]   [erg/cm2]
15- 25  7.180e-07   7.201e-08
25- 50  1.199e-06   7.085e-08
50-150  1.760e-06   5.656e-07
15-150  3.677e-06   5.962e-07
Double BB

Spectral model: bbodyrad<1> + bbodyrad<2>
------------------------------------------------------------
Parameters  : value         Lower 90%    Upper 90%
kT1 [keV]   : 5.54423        (-0.930058      1.08887)
R1^2/D10^2  : 0.337280        (-0.164105      0.370852)
kT2 [keV]   : 22.7700        (-4.48337      7.76759)
R2^2/D10^2  : 1.67986E-03    (-0.00106186   0.00211688)
------------------------------------------------------------
#Fit statistic : Chi-Squared =          47.99 using 59 PHA bins.
# Reduced chi-squared =         0.8726 for     55 degrees of freedom
# Null hypothesis probability =   7.371638e-01

Energy  Fluence     90% Error
[keV]   [erg/cm2]   [erg/cm2]
15- 25  8.031e-07   1.321e-07
25- 50  1.093e-06   1.936e-07
50-150  1.972e-06   5.184e-07
15-150  3.867e-06   7.537e-07
Peak spectrum fit
Power-law model

Time interval is from  115.228 sec. to  116.228 sec.

Spectral model in power-law:
------------------------------------------------------------
Parameters  : value       lower 90%   higher 90%
Photon index: 1.49703     ( -0.332414   0.346407 )
Norm@50keV  : 7.20667E-03    ( -0.00145783   0.00143573 )
------------------------------------------------------------
#Fit statistic : Chi-Squared =          47.88 using 59 PHA bins.
# Reduced chi-squared =         0.8400 for     57 degrees of freedom
# Null hypothesis probability =   7.998111e-01

Photon flux (15-150 keV)    in 1 sec: 0.898958 ( -0.175715  0.176058 ) ph/cm2/s
Energy fluence (15-150 keV)             : 6.83997e-08 ( -1.50191e-08  1.52629e-08 ) ergs/cm2
Cutoff power-law model

Time interval is from  115.228 sec. to  116.228 sec.
Spectral model in the cutoff power-law:
------------------------------------------------------------
Parameters  : value       lower 90%   higher 90%
Photon index: 1.02786     ( -1.6546   1.37524 )
Epeak [keV] : 109.968      ( -109.976 -109.976 )
Norm@50keV  : 1.21651E-02    (     )
------------------------------------------------------------
#Fit statistic : Chi-Squared =          47.49 using 59 PHA bins.
# Reduced chi-squared =         0.8481 for     56 degrees of freedom
# Null hypothesis probability =   7.836524e-01

Photon flux (15-150 keV)    in 1 sec: 0.882703 ( -0.183093  0.181227 ) ph/cm2/s
Energy fluence (15-150 keV)             : 6.70188e-08 ( -1.53346e-08  1.57494e-08 ) ergs/cm2
Band function

Time interval is from  115.228 sec. to  116.228 sec.

Spectral model in the Band function:
------------------------------------------------------------
Parameters  : value       lower 90%   higher 90%
alpha       : -0.931850   ( -1.5124   1.54843 )
beta        : -9.36499    ( 9.37127   19.3713 )
Epeak [keV] : 100.206      ( -43.7745 -100.417 )
Norm@50keV   : 1.35254E-02    ( -0.00763048   0 )
------------------------------------------------------------
#Fit statistic : Chi-Squared =          47.51 using 59 PHA bins.
# Reduced chi-squared =         0.8638 for     55 degrees of freedom
# Null hypothesis probability =   7.534020e-01

Photon flux (15-150 keV)    in 1 sec: 0.880302 (    ) ph/cm2/s
Energy fluence (15-150 keV)             : 0 ( 0  0 ) ergs/cm2
Single BB

Spectral model blackbody:
------------------------------------------------------------
Parameters  : value    Lower 90%  Upper 90%
kT [keV]    : 16.8896  (-3.44763  4.47409)
R^2/D10^2   : 6.97073E-02  (-0.0388913   0.0832243)
(R is the radius in km and D10 is the distance to the source in units of 10 kpc)
------------------------------------------------------------
#Fit statistic : Chi-Squared =          52.26 using 59 PHA bins.
# Reduced chi-squared =         0.9168 for     57 degrees of freedom
# Null hypothesis probability =   6.532327e-01

Energy  Fluence     90% Error
[keV]   [erg/cm2]   [erg/cm2]
15- 25  4.057e-09   1.674e-09
25- 50  1.786e-08   6.238e-09
50-150  3.629e-08   1.481e-08
15-150  5.820e-08   1.878e-08
Thermal bremsstrahlung (OTTB)

Spectral model: thermal bremsstrahlung
------------------------------------------------------------
Parameters  : value         Lower 90%    Upper 90%
kT [keV]    : 199.350       (-103.82      -199.36)
Norm        : 3.69026       (-0.709841     0.7106)
------------------------------------------------------------
#Fit statistic : Chi-Squared =          47.73 using 59 PHA bins.
# Reduced chi-squared =         0.8373 for     57 degrees of freedom
# Null hypothesis probability =   8.042933e-01

Energy  Fluence     90% Error
[keV]   [erg/cm2]   [erg/cm2]
15- 25  9.189e-09   5.305e-09
25- 50  1.768e-08   1.005e-08
50-150  3.877e-08   2.221e-08
15-150  6.563e-08   3.812e-08
Double BB

Spectral model: bbodyrad<1> + bbodyrad<2>
------------------------------------------------------------
Parameters  : value         Lower 90%    Upper 90%
kT1 [keV]   : 3.35493        (-1.77762      2.97134)
R1^2/D10^2  : 18.9233        (-17.9612      3293.29)
kT2 [keV]   : 20.2146        (-4.62238      7.42525)
R2^2/D10^2  : 3.44321E-02    (-0.0230056   0.0530922)
------------------------------------------------------------
#Fit statistic : Chi-Squared =          44.34 using 59 PHA bins.
# Reduced chi-squared =         0.8061 for     55 degrees of freedom
# Null hypothesis probability =   8.476692e-01

Energy  Fluence     90% Error
[keV]   [erg/cm2]   [erg/cm2]
15- 25  9.559e-09   4.941e-09
25- 50  1.500e-08   8.340e-09
50-150  4.111e-08   2.402e-08
15-150  6.567e-08   3.505e-08
Pre-slew spectrum (Pre-slew PHA with pre-slew DRM)
Power-law model

Spectral model in power-law:
------------------------------------------------------------
Parameters  : value       lower 90%   higher 90%
Photon index: 2.02914     ( -0.266774   0.292246 )
Norm@50keV  : 1.04619E-03    ( -0.000190089   0.000180424 )
------------------------------------------------------------
#Fit statistic : Chi-Squared =          37.40 using 59 PHA bins.
# Reduced chi-squared =         0.6562 for     57 degrees of freedom
# Null hypothesis probability =   9.791764e-01

Photon flux (15-150 keV)    in 76.86 sec: 0.159069 ( -0.0203183  0.0203223 ) ph/cm2/s
Energy fluence (15-150 keV)             : 7.42798e-07 ( -1.20394e-07  1.23993e-07 ) ergs/cm2
Cutoff power-law model

Spectral model in the cutoff power-law:
------------------------------------------------------------
Parameters  : value       lower 90%   higher 90%
Photon index: 2.08841     (     )
Epeak [keV] : 42.4829      (   )
Norm@50keV  : 9.27564E-04    (     )
------------------------------------------------------------
#Fit statistic : Chi-Squared =          37.02 using 59 PHA bins.
# Reduced chi-squared =         0.6611 for     56 degrees of freedom
# Null hypothesis probability =   9.763386e-01

Photon flux (15-150 keV)    in 76.86 sec: 0.159116 ( -0.020309  0.020297 ) ph/cm2/s
Energy fluence (15-150 keV)             : 7.41714e-07 ( -1.19392e-07  1.25021e-07 ) ergs/cm2
Band function

Spectral model in the Band function:
------------------------------------------------------------
Parameters  : value       lower 90%   higher 90%
alpha       : -9.98625   ( 9.98625   9.98625 )
beta        : -2.02916    ( -0.292239   0.266652 )
Epeak [keV] : 13.2861      ( -13.2861 -13.2861 )
Norm@50keV   : 0.142191    ( -0.025836   0.024522 )
------------------------------------------------------------
#Fit statistic : Chi-Squared =          37.40 using 59 PHA bins.
# Reduced chi-squared =         0.6801 for     55 degrees of freedom
# Null hypothesis probability =   9.666980e-01

Photon flux (15-150 keV)    in 76.86 sec:  (    ) ph/cm2/s
Energy fluence (15-150 keV)             : 0 ( 0  0 ) ergs/cm2
S(25-50 keV) vs. S(50-100 keV) plot

S(25-50 keV)  = 1.14e-06
S(50-100 keV) = 1.22e-06
T90 vs. Hardness ratio plot

T90                                   = 548.995999932289 sec.
Hardness ratio (energy fluence ratio) = 1.07018
Color vs. Color plot

Count Ratio  (25-50 keV) / (15-25 keV) = 0.935316
Count Ratio (50-100 keV) / (15-25 keV) = 0.579033
Mask shadow pattern

IMX = 6.058044271535602E-01, IMY = -1.673570671035416E-01
TIME vs. PHA plot around the trigger time

TIME vs. DetID plot around the trigger time

100 us light curve (15-350 keV)

Spacecraft aspect plot

Bright source in the pre-burst/pre-slew/post-slew images
Pre-burst image of 15-350 keV band
Time interval of the image:
-656.599400 -640.504200
-239.000000 35.444000

# RAcent  DECcent POSerr Theta    Phi  PeakCts   SNR AngSep     Name
#  [deg]    [deg]    ['] [deg]  [deg]                   [']
254.3198  35.4735    0.0  50.5 -175.8   1.2264   2.3   10.4	Her X-1
243.8467  36.6259    2.6  42.1 -173.3   1.5046   4.4 ------	UNKNOWN
Pre-slew background subtracted image of 15-350 keV band
Time interval of the image:
35.444000 112.300610

# RAcent  DECcent POSerr Theta    Phi  PeakCts   SNR AngSep     Name
#  [deg]    [deg]    ['] [deg]  [deg]                   [']
254.5223  35.4268    9.0  50.7 -175.9   0.2977   1.3    6.0	Her X-1
153.8310  27.4723    1.1  32.1   15.4   1.3111  10.2 ------	UNKNOWN
Post-slew image of 15-350 keV band
Time interval of the image:
167.500600 874.300610

# RAcent  DECcent POSerr Theta    Phi  PeakCts   SNR AngSep     Name
#  [deg]    [deg]    ['] [deg]  [deg]                   [']
132.8399  41.8165    2.7  22.4  104.1   2.0435   4.3 ------	UNKNOWN
130.4109  -7.4335    4.2  41.6    5.1   1.8066   2.7 ------	UNKNOWN
153.8405  27.4768    1.1   0.0 -177.0   4.3894  10.7 ------	UNKNOWN
148.2741  -9.1793    2.6  37.0  -22.2   2.4780   4.4 ------	UNKNOWN
227.6000  50.6073    4.0  59.1 -166.1   8.7126   2.9 ------	UNKNOWN
224.1566  42.7970    5.9  57.8 -156.6   5.7469   1.9 ------	UNKNOWN
167.3835 -19.4329    3.0  48.7  -48.4   7.8741   3.9 ------	UNKNOWN
176.1892 -10.5019    4.5  43.7  -64.1   5.8239   2.6 ------	UNKNOWN
Plot creation:
Sat May 30 21:26:50 EDT 2015