Click here for the BAT GCN circular template
Image
Pre-slew 15.0-350.0 keV image (Event data)
#   RAcent    DECcent   POSerr    Theta     Phi              Peak Cts       SNR   Name
  271.4816    -3.8802   0.0176    16.9258   -88.7082         0.8462499     10.912 TRIG_00505801

Foreground time interval of the image:
 -4.080  37.296 (delta_t =  41.376 [sec])
Background time interval of the image:
-239.000  -4.080 (delta_t = 234.920 [sec])
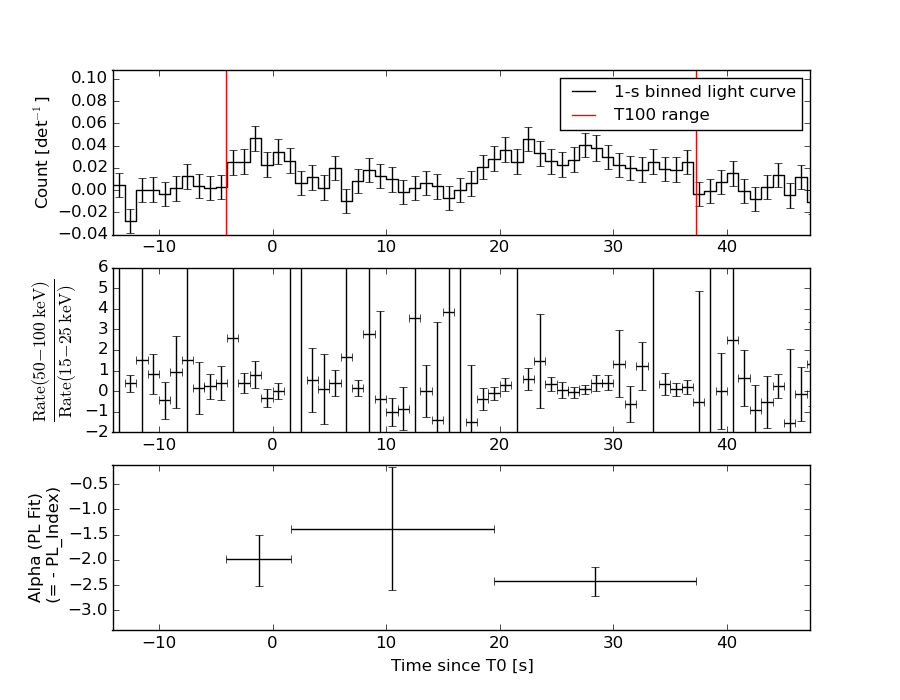
Lightcurves
Notes:
- 1) The mask-weighted light curves are using the flight position.
- 2) Multiple plots of different time binning/intervals are shown to cover all scenarios of short/long GRBs, rate/image triggers, and real/false positives.
- 3) For all the mask-weighted lightcurves, the y-axis units are counts/sec/det where a det is 0.4 x 0.4 = 0.16 sq cm.
- 4) The verticle lines correspond to following: green dotted lines are T50 interval, black dotted lines are T90 interval, blue solid line(s) is a spacecraft slew start time, and orange solid line(s) is a spacecraft slew end time.
- 5) Time of each bin is in the middle of the bin.
1 s binning
From T0-310 s to T0+310 s
From T100_start - 20 s to T100_end + 30 s
Full time interval

64 ms binning
Full time interval
From T100_start to T100_end

From T0-5 sec to T0+5 sec
16 ms binning
From T100_start-5 s to T100_start+5 s

8 ms binning
From T100_start-3 s to T100_start+3 s

2 ms binning
From T100_start-1 s to T100_start+1 s

SN=5 or 10 sec. binning (whichever binning is satisfied first)

SN=5 or 10 sec. binning (T < 200 sec)

Quad-rate summed light curves (from T0-300s to T0+1000s)
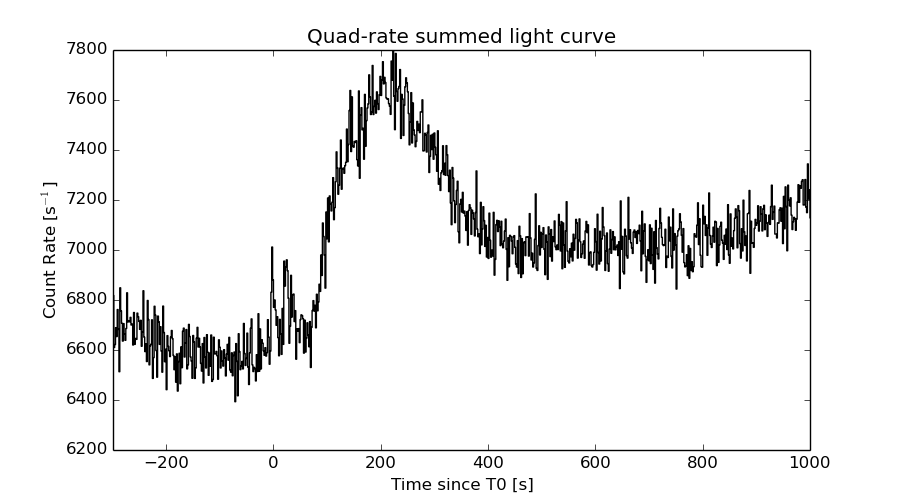
The mask-weighted light curves based on cleaned DPHs

Spectral Evolution
Spectra
Notes:
- 1) The fitting includes the systematic errors.
- 2) When the burst includes telescope slew time periods, the fitting uses an average response file made from multiple 5-s response files through out the slew time plus single time preiod for the non-slew times, and weighted by the total counts in the corresponding time period using addrmf. An average response file is needed becuase a spectral fit using the pre-slew DRM will introduce some errors in both a spectral shape and a normalization if the PHA file contains a lot of the slew/post-slew time interval.
- 3) For fits to more complicated models (e.g. a power-law over a cutoff power-law), the BAT team has decided to require a chi-square improvement of more than 6 for each extra dof.
Time averaged spectrum fit using the average DRM
Power-law model
Time interval is from   -4.080 sec. to   37.296 sec.

Spectral model in power-law:
------------------------------------------------------------
Parameters  : value       lower 90%   higher 90%
Photon index: 2.17522     ( -0.259311   0.282535 )
Norm@50keV  : 1.03425E-03    ( -0.000203817   0.000199043 )
------------------------------------------------------------
#Fit statistic : Chi-Squared =          52.39 using 59 PHA bins.
# Reduced chi-squared =         0.9192 for     57 degrees of freedom
# Null hypothesis probability =   6.482985e-01

Photon flux (15-150 keV)    in 41.38 sec: 0.169024 ( -0.0229435  0.0229435 ) ph/cm2/s
Energy fluence (15-150 keV)             : 4.01034e-07 ( -6.74171e-08  7.00315e-08 ) ergs/cm2
Cutoff power-law model

Time interval is from   -4.080 sec. to   37.296 sec.
Spectral model in the cutoff power-law:
------------------------------------------------------------
Parameters  : value       lower 90%   higher 90%
Photon index: 1.31602     ( -1.72478   0.746759 )
Epeak [keV] : 29.4747      (   )
Norm@50keV  : 3.54144E-03    (     )
------------------------------------------------------------
#Fit statistic : Chi-Squared =          51.01 using 59 PHA bins.
# Reduced chi-squared =         0.9108 for     56 degrees of freedom
# Null hypothesis probability =   6.639140e-01

Photon flux (15-150 keV)    in 41.38 sec: 0.164358 ( -0.023638  0.023792 ) ph/cm2/s
Energy fluence (15-150 keV)             : 3.63095e-07 ( -7.3286e-08  8.73846e-08 ) ergs/cm2
Band function

Time interval is from   -4.080 sec. to   37.296 sec.

Spectral model in the Band function:
------------------------------------------------------------
Parameters  : value       lower 90%   higher 90%
alpha       : -0.619692   ( 0.600082   0.600082 )
beta        : -2.58217    ( 2.57683   0.536882 )
Epeak [keV] : 28.2301      ( -28.1111 13.7864 )
Norm@50keV   : 1.13299E-02    ( -0.0128028   244.458 )
------------------------------------------------------------
#Fit statistic : Chi-Squared =          50.38 using 59 PHA bins.
# Reduced chi-squared =         0.9159 for     55 degrees of freedom
# Null hypothesis probability =   6.516527e-01

Photon flux (15-150 keV)    in 41.38 sec:  (    ) ph/cm2/s
Energy fluence (15-150 keV)             : 3.75355e-07 ( 0  0 ) ergs/cm2
Single BB

Spectral model blackbody:
------------------------------------------------------------
Parameters  : value    Lower 90%  Upper 90%
kT [keV]    : 8.26549  (-1.17679  1.39072)
R^2/D10^2   : 0.164295  (-0.0759844   0.139131)
(R is the radius in km and D10 is the distance to the source in units of 10 kpc)
------------------------------------------------------------
#Fit statistic : Chi-Squared =          57.22 using 59 PHA bins.
# Reduced chi-squared =          1.004 for     57 degrees of freedom
# Null hypothesis probability =   4.669934e-01

Energy  Fluence     90% Error
[keV]   [erg/cm2]   [erg/cm2]
15- 25  8.596e-08   2.050e-08
25- 50  1.591e-07   3.391e-08
50-150  4.646e-08   1.973e-08
15-150  2.915e-07   5.830e-08
Thermal bremsstrahlung (OTTB)

Spectral model: thermal bremsstrahlung
------------------------------------------------------------
Parameters  : value         Lower 90%    Upper 90%
kT [keV]    : 46.2353       (-14.2258      25.2388)
Norm        : 1.00377       (-0.222723     0.310464)
------------------------------------------------------------
#Fit statistic : Chi-Squared =          50.99 using 59 PHA bins.
# Reduced chi-squared =         0.8945 for     57 degrees of freedom
# Null hypothesis probability =   6.988591e-01

Energy  Fluence     90% Error
[keV]   [erg/cm2]   [erg/cm2]
15- 25  9.962e-08   1.769e-08
25- 50  1.390e-07   2.621e-08
50-150  1.251e-07   5.390e-08
15-150  3.637e-07   7.552e-08
Double BB

Spectral model: bbodyrad<1> + bbodyrad<2>
------------------------------------------------------------
Parameters  : value         Lower 90%    Upper 90%
kT1 [keV]   : 6.18430        (-3.24923      2.13256)
R1^2/D10^2  : 0.406133        (-0.253374      5.2609)
kT2 [keV]   : 19.3028        (-13.6206      -19.4692)
R2^2/D10^2  : 3.07295E-03    (-0.00293354   0.0561782)
------------------------------------------------------------
#Fit statistic : Chi-Squared =          50.77 using 59 PHA bins.
# Reduced chi-squared =         0.9231 for     55 degrees of freedom
# Null hypothesis probability =   6.369013e-01

Energy  Fluence     90% Error
[keV]   [erg/cm2]   [erg/cm2]
15- 25  9.834e-08   5.406e-08
25- 50  1.398e-07   7.532e-08
50-150  1.335e-07   8.807e-08
15-150  3.717e-07   1.920e-07
Peak spectrum fit
Power-law model

Time interval is from   21.712 sec. to   22.712 sec.

Spectral model in power-law:
------------------------------------------------------------
Parameters  : value       lower 90%   higher 90%
Photon index: 1.77599     ( -0.556372   0.595708 )
Norm@50keV  : 3.29215E-03    ( -0.00123592   0.00117847 )
------------------------------------------------------------
#Fit statistic : Chi-Squared =          51.02 using 59 PHA bins.
# Reduced chi-squared =         0.8952 for     57 degrees of freedom
# Null hypothesis probability =   6.975621e-01

Photon flux (15-150 keV)    in 1 sec: 0.449498 ( -0.143346  0.143439 ) ph/cm2/s
Energy fluence (15-150 keV)             : 3.03372e-08 ( -1.10921e-08  1.16802e-08 ) ergs/cm2
Cutoff power-law model

Time interval is from   21.712 sec. to   22.712 sec.
Spectral model in the cutoff power-law:
------------------------------------------------------------
Parameters  : value       lower 90%   higher 90%
Photon index: 1.28905E-02     ( 0.0421105   2.14946 )
Epeak [keV] : 41.5682      (   )
Norm@50keV  : 4.12784E-02    (     )
------------------------------------------------------------
#Fit statistic : Chi-Squared =          50.58 using 59 PHA bins.
# Reduced chi-squared =         0.9032 for     56 degrees of freedom
# Null hypothesis probability =   6.794301e-01

Photon flux (15-150 keV)    in 1 sec: 0.414769 ( -0.148585  0.224354 ) ph/cm2/s
Energy fluence (15-150 keV)             : 2.27586e-08 ( -9.0289e-09  1.80151e-08 ) ergs/cm2
Band function

Time interval is from   21.712 sec. to   22.712 sec.

Spectral model in the Band function:
------------------------------------------------------------
Parameters  : value       lower 90%   higher 90%
alpha       : 2.77691   ( -1.1113   -1.1113 )
beta        : -2.62920    ( 2.53883   1.14959 )
Epeak [keV] : 34.3339      ( -36.3997 69.2301 )
Norm@50keV   : 3.05947    ( -3.04882   46.502 )
------------------------------------------------------------
#Fit statistic : Chi-Squared =          49.58 using 59 PHA bins.
# Reduced chi-squared =         0.9015 for     55 degrees of freedom
# Null hypothesis probability =   6.810511e-01

Photon flux (15-150 keV)    in 1 sec:  (    ) ph/cm2/s
Energy fluence (15-150 keV)             : 0 ( 0  0 ) ergs/cm2
Single BB

Spectral model blackbody:
------------------------------------------------------------
Parameters  : value    Lower 90%  Upper 90%
kT [keV]    : 9.79314  (-2.57549  3.86935)
R^2/D10^2   : 0.242245  (-0.242243   0.531367)
(R is the radius in km and D10 is the distance to the source in units of 10 kpc)
------------------------------------------------------------
#Fit statistic : Chi-Squared =          50.60 using 59 PHA bins.
# Reduced chi-squared =         0.8877 for     57 degrees of freedom
# Null hypothesis probability =   7.123544e-01

Energy  Fluence     90% Error
[keV]   [erg/cm2]   [erg/cm2]
15- 25  4.696e-09   2.962e-09
25- 50  1.133e-08   6.785e-09
50-150  5.566e-09   4.159e-09
15-150  2.159e-08   1.345e-08
Thermal bremsstrahlung (OTTB)

Spectral model: thermal bremsstrahlung
------------------------------------------------------------
Parameters  : value         Lower 90%    Upper 90%
kT [keV]    : 87.3187       (-54.6393      -87.3188)
Norm        : 2.07812       (-0.790411     1.40243)
------------------------------------------------------------
#Fit statistic : Chi-Squared =          50.86 using 59 PHA bins.
# Reduced chi-squared =         0.8923 for     57 degrees of freedom
# Null hypothesis probability =   7.033797e-01

Energy  Fluence     90% Error
[keV]   [erg/cm2]   [erg/cm2]
15- 25  5.417e-09   3.308e-09
25- 50  9.100e-09   5.665e-09
50-150  1.360e-08   1.184e-08
15-150  2.812e-08   1.967e-08
Double BB

------------------------------------------------------------
Parameters  : value         Lower 90%    Upper 90%
kT1 [keV]   : 199.132        (      )
R1^2/D10^2  : 5.24657E-05        (-2.62211e-05      0.0103826)
kT2 [keV]   : 8.61043        (-2.29508      3.23082)
R2^2/D10^2  : 0.359783    (-0.258636   0.839524)
------------------------------------------------------------
#Fit statistic : Chi-Squared =          50.56 using 59 PHA bins.
#Fit statistic : Chi-Squared =          47.48 using 59 PHA bins.
# Reduced chi-squared =         0.9193 for     55 degrees of freedom
# Reduced chi-squared =         0.8633 for     55 degrees of freedom
# Null hypothesis probability =   6.446433e-01
# Null hypothesis probability =   7.542292e-01

Energy  Fluence     90% Error
[keV]   [erg/cm2]   [erg/cm2]
15- 25  4.714e-09   4.253e-06
25- 50  1.092e-08   3.434e-05
50-150  5.987e-09   8.770e-04
15-150  2.162e-08   9.920e-04
Pre-slew spectrum (Pre-slew PHA with pre-slew DRM)
Power-law model

Spectral model in power-law:
------------------------------------------------------------
Parameters  : value       lower 90%   higher 90%
Photon index: 2.17522     ( -0.259311   0.282535 )
Norm@50keV  : 1.03425E-03    ( -0.000203817   0.000199043 )
------------------------------------------------------------
#Fit statistic : Chi-Squared =          52.39 using 59 PHA bins.
# Reduced chi-squared =         0.9192 for     57 degrees of freedom
# Null hypothesis probability =   6.482985e-01

Photon flux (15-150 keV)    in 41.38 sec: 0.169024 ( -0.0229435  0.0229435 ) ph/cm2/s
Energy fluence (15-150 keV)             : 4.01034e-07 ( -6.74171e-08  7.00315e-08 ) ergs/cm2
Cutoff power-law model
Spectral model in the cutoff power-law:
------------------------------------------------------------
Parameters  : value       lower 90%   higher 90%
Photon index: 1.31602     ( -1.72478   0.746759 )
Epeak [keV] : 29.4747      (   )
Norm@50keV  : 3.54144E-03    (     )
------------------------------------------------------------
#Fit statistic : Chi-Squared =          51.01 using 59 PHA bins.
# Reduced chi-squared =         0.9108 for     56 degrees of freedom
# Null hypothesis probability =   6.639140e-01

Photon flux (15-150 keV)    in 41.38 sec: 0.164358 ( -0.023638  0.023792 ) ph/cm2/s
Energy fluence (15-150 keV)             : 3.63095e-07 ( -7.3286e-08  8.73846e-08 ) ergs/cm2
Band function

Spectral model in the Band function:
------------------------------------------------------------
Parameters  : value       lower 90%   higher 90%
alpha       : -0.619692   ( 0.600082   0.600082 )
beta        : -2.58217    ( 2.57683   0.536882 )
Epeak [keV] : 28.2301      ( -28.1111 13.7864 )
Norm@50keV   : 1.13299E-02    ( -0.0128028   244.458 )
------------------------------------------------------------
#Fit statistic : Chi-Squared =          50.38 using 59 PHA bins.
# Reduced chi-squared =         0.9159 for     55 degrees of freedom
# Null hypothesis probability =   6.516527e-01

Photon flux (15-150 keV)    in 41.38 sec:  (    ) ph/cm2/s
Energy fluence (15-150 keV)             : 3.75355e-07 ( 0  0 ) ergs/cm2
S(25-50 keV) vs. S(50-100 keV) plot

S(25-50 keV)  = 1.26e-07
S(50-100 keV) = 1.12e-07
T90 vs. Hardness ratio plot

T90                                   = 32.7079999446869 sec.
Hardness ratio (energy fluence ratio) = 0.888889
Color vs. Color plot

Count Ratio  (25-50 keV) / (15-25 keV) = 1.1602
Count Ratio (50-100 keV) / (15-25 keV) = 0.401081
Mask shadow pattern
IMX = 6.860509801925356E-03, IMY = 3.042375419936534E-01
TIME vs. PHA plot around the trigger time

TIME vs. DetID plot around the trigger time

100 us light curve (15-350 keV)

Spacecraft aspect plot
Bright source in the pre-burst/pre-slew/post-slew images
Pre-burst image of 15-350 keV band
Time interval of the image:
-239.000000 -4.080000

# RAcent  DECcent POSerr Theta    Phi  PeakCts   SNR AngSep     Name
#  [deg]    [deg]    ['] [deg]  [deg]                   [']
254.3346  35.2951    6.0  46.6  -21.4  -0.6960  -1.9    6.7	Her X-1
263.0093 -24.7464   54.8  34.9 -121.5   0.0645   0.2    0.1	GX 1+4
264.9216 -44.4488   40.4  49.5 -141.7  -0.1769  -0.3    7.7	4U 1735-44
268.3301  -1.4961    2.5  19.6  -79.4   0.8917   4.5    3.5	SW J1753.5-0127
270.3235 -25.0615    2.3  30.8 -131.0   1.3081   5.0    2.4	GX 5-1
270.3759 -25.6679    4.6  31.2 -131.8   0.6725   2.5    6.0	GRS 1758-258
273.9900 -14.0913    2.7  20.1 -120.8   0.8322   4.2    3.4	GX 17+2
276.0343 -30.4108    2.8  33.0 -144.3   0.9201   4.1    6.2	H1820-303
285.1848 -24.8906   19.8  25.6 -157.6   0.1085   0.6    8.3	HT1900.1-2455
288.8099  10.8096    3.0  10.2   22.4   0.6920   3.9    8.2	GRS 1915+105
299.5315  35.2966    8.1  36.4   33.1   0.4650   1.4    6.4	Cyg X-1
308.1632  40.9544    9.1  44.3   38.9   0.9010   1.3    2.4	Cyg X-3
263.0073 -33.9646    4.7  41.7 -131.6   0.9174   2.4    7.8	GX 354-0
312.0793   6.7335    3.7  25.0   92.1   0.8417   3.1 ------	UNKNOWN
278.6157 -12.8763    2.6  16.3 -129.4   0.8092   4.5 ------	UNKNOWN
239.3411  37.3429    3.6  57.7  -27.9   4.0593   3.2 ------	UNKNOWN
241.5540  18.5338    2.6  48.8  -48.8   3.6841   4.4 ------	UNKNOWN
Pre-slew background subtracted image of 15-350 keV band
Time interval of the image:
-4.080000 37.296000

# RAcent  DECcent POSerr Theta    Phi  PeakCts   SNR AngSep     Name
#  [deg]    [deg]    ['] [deg]  [deg]                   [']
254.2807  35.4184    6.3  46.7  -21.3   0.2479   1.8    9.8	Her X-1
262.9313 -24.8848    5.0  35.1 -121.5   0.2625   2.3    9.4	GX 1+4
264.6704 -44.5337    6.3  49.6 -141.6   0.4277   1.8    5.9	4U 1735-44
268.3011  -1.3251    6.1  19.6  -78.9   0.1491   1.9    8.6	SW J1753.5-0127
270.3244 -25.1695    8.5  30.8 -131.1  -0.1267  -1.4    5.8	GX 5-1
270.4126 -25.5884    0.0  31.1 -131.7  -0.0803  -0.9   11.0	GRS 1758-258
274.1113 -13.8639    0.0  19.8 -120.5   0.2078   2.6   12.0	GX 17+2
276.1135 -30.4285    4.2  33.0 -144.4  -0.2410  -2.7   10.4	H1820-303
285.1836 -24.8872    4.9  25.6 -157.6   0.1678   2.3    8.3	HT1900.1-2455
288.6155  11.0264    6.5  10.4   21.2   0.1213   1.8   11.8	GRS 1915+105
299.5155  35.2688    6.6  36.3   33.1  -0.2248  -1.8    5.4	Cyg X-1
308.1525  41.0875   92.7  44.5   38.8  -0.0296  -0.1    8.3	Cyg X-3
263.0272 -33.8550   11.0  41.6 -131.5  -0.1545  -1.0    2.3	GX 354-0
271.4816  -3.8802    1.1  16.9  -88.7   0.8464  10.9 ------	UNKNOWN
Post-slew image of 15-350 keV band
Time interval of the image:
112.300590 963.111500

# RAcent  DECcent POSerr Theta    Phi  PeakCts   SNR AngSep     Name
#  [deg]    [deg]    ['] [deg]  [deg]                   [']
244.9834 -15.6438    0.3  28.6 -107.0  27.6955  36.8    0.3	Sco X-1
254.5859  35.2417    2.9  42.2  -11.6  -3.2659  -4.0    8.7	Her X-1
256.0273 -37.8102    1.5  36.8 -150.3   5.7052   7.7    2.8	4U 1700-377
256.3996 -36.5004    3.9  35.5 -149.7   2.1071   3.0    5.0	GX 349+2
263.0837 -24.8875    5.8  22.5 -150.6   1.1758   2.0    9.4	GX 1+4
264.8341 -44.4513    3.5  41.0 -163.6   2.7162   3.2    3.9	4U 1735-44
268.3822  -1.3993    2.5   4.0  -42.9   2.6938   4.6    3.3	SW J1753.5-0127
270.3019 -25.0988    2.3  21.3 -167.9   2.8954   5.0    1.5	GX 5-1
270.3378 -25.8203    6.0  22.0 -168.0   1.1473   1.9    5.0	GRS 1758-258
274.0207 -13.9792    1.9  10.4  175.6   3.2525   6.1    3.5	GX 17+2
275.9169 -30.3187    5.3  26.8 -179.3   1.3326   2.2    2.9	H1820-303
284.8974 -24.7995    4.7  24.6  158.8   1.5879   2.5   10.5	HT1900.1-2455
288.7582  10.8988    2.7  22.6   58.2   3.0904   4.3    3.7	GRS 1915+105
299.5350  35.1783   10.9  47.1   40.7   2.6092   1.1    3.1	Cyg X-1
263.1461 -33.8139    6.6  31.0 -157.3   1.1531   1.7    7.9	GX 354-0
310.4065   4.9589    3.3  39.8   86.6   9.1981   3.5 ------	UNKNOWN
283.4088  27.1421    2.5  33.1   28.7   3.6550   4.6 ------	UNKNOWN
287.8592   0.5762    2.1  16.9   84.2   3.4904   5.5 ------	UNKNOWN
266.3519  51.2301    3.1  55.3    5.2  11.6060   3.7 ------	UNKNOWN
276.5173   0.5089    2.7   6.6   58.0   2.0978   4.3 ------	UNKNOWN
262.4714  29.9758    3.4  34.9   -4.7   2.3555   3.4 ------	UNKNOWN
Plot creation:
Sat May 30 21:25:00 EDT 2015