Special notes of this burst
Image
Pre-slew 15.0-350.0 keV image (Event data)

#   RAcent    DECcent   POSerr    Theta     Phi              Peak Cts       SNR   Name
  287.0265   -38.0346   0.0176    18.4199    68.6073         0.1063044     10.909 TRIG_00505926

Foreground time interval of the image:
 -0.040   0.392 (delta_t =   0.432 [sec])
Background time interval of the image:
-28.443  -0.040 (delta_t =  28.403 [sec])
Lightcurves
Notes:
- 1) The mask-weighted light curves are using the flight position.
- 2) Multiple plots of different time binning/intervals are shown to cover all scenarios of short/long GRBs, rate/image triggers, and real/false positives.
- 3) For all the mask-weighted lightcurves, the y-axis units are counts/sec/det where a det is 0.4 x 0.4 = 0.16 sq cm.
- 4) The verticle lines correspond to following: green dotted lines are T50 interval, black dotted lines are T90 interval, blue solid line(s) is a spacecraft slew start time, and orange solid line(s) is a spacecraft slew end time.
- 5) Time of each bin is in the middle of the bin.
1 s binning
From T0-310 s to T0+310 s

From T100_start - 20 s to T100_end + 30 s
Full time interval

64 ms binning
Full time interval

From T100_start to T100_end
From T0-5 sec to T0+5 sec

16 ms binning
From T100_start-5 s to T100_start+5 s

Blue+Cyan dotted lines: Time interval of the scaled map
From 0.000000 to 0.256000
8 ms binning
From T100_start-3 s to T100_start+3 s

Blue+Cyan dotted lines: Time interval of the scaled map
From 0.000000 to 0.256000
2 ms binning
From T100_start-1 s to T100_start+1 s

Blue+Cyan dotted lines: Time interval of the scaled map
From 0.000000 to 0.256000
SN=5 or 10 sec. binning (whichever binning is satisfied first)
SN=5 or 10 sec. binning (T < 200 sec)

Quad-rate summed light curves (from T0-300s to T0+1000s)
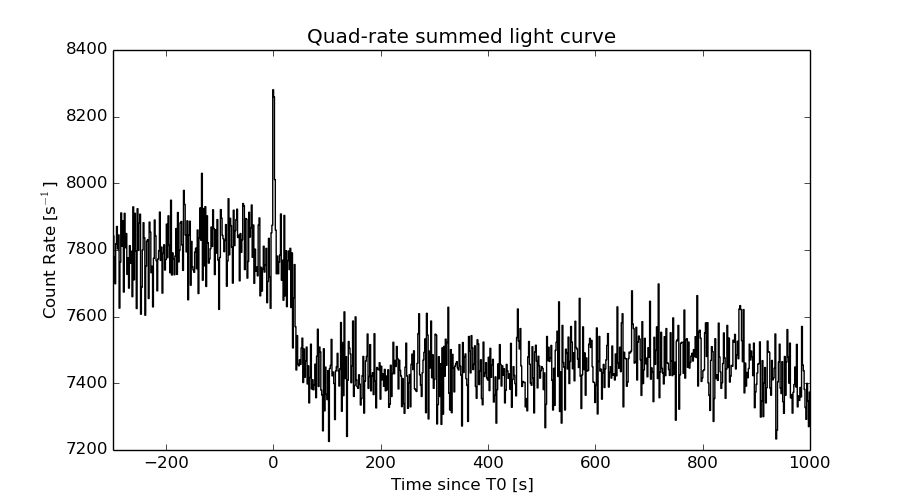
The mask-weighted light curves based on cleaned DPHs

Spectral Evolution

Spectra
Notes:
- 1) The fitting includes the systematic errors.
- 2) When the burst includes telescope slew time periods, the fitting uses an average response file made from multiple 5-s response files through out the slew time plus single time preiod for the non-slew times, and weighted by the total counts in the corresponding time period using addrmf. An average response file is needed becuase a spectral fit using the pre-slew DRM will introduce some errors in both a spectral shape and a normalization if the PHA file contains a lot of the slew/post-slew time interval.
- 3) For fits to more complicated models (e.g. a power-law over a cutoff power-law), the BAT team has decided to require a chi-square improvement of more than 6 for each extra dof.
Time averaged spectrum fit using the average DRM
Power-law model

Time interval is from   -0.040 sec. to    0.392 sec.

Spectral model in power-law:
------------------------------------------------------------
Parameters  : value       lower 90%   higher 90%
Photon index: 1.38215     ( -0.264783   0.263305 )
Norm@50keV  : 1.50394E-02    ( -0.00222714   0.00222054 )
------------------------------------------------------------
#Fit statistic : Chi-Squared =          52.10 using 59 PHA bins.
# Reduced chi-squared =         0.9141 for     57 degrees of freedom
# Null hypothesis probability =   6.589261e-01

Photon flux (15-150 keV)    in 0.432 sec: 1.82424 ( -0.276081  0.27686 ) ph/cm2/s
Energy fluence (15-150 keV)             : 6.3012e-08 ( -1.02909e-08  1.03975e-08 ) ergs/cm2
Cutoff power-law model
Time interval is from   -0.040 sec. to    0.392 sec.
Spectral model in the cutoff power-law:
------------------------------------------------------------
Parameters  : value       lower 90%   higher 90%
Photon index: 1.37427     ( -0.299337   0.265755 )
Epeak [keV] : 9998.93      ( -9999.33 -9999.33 )
Norm@50keV  : 1.50868E-02    (     )
------------------------------------------------------------
#Fit statistic : Chi-Squared =          52.11 using 59 PHA bins.
# Reduced chi-squared =         0.9305 for     56 degrees of freedom
# Null hypothesis probability =   6.229231e-01

Photon flux (15-150 keV)    in 0.432 sec: 1.82536 ( -0.27777  0.27339 ) ph/cm2/s
Energy fluence (15-150 keV)             : 6.2767e-08 ( -1.00349e-08  1.05244e-08 ) ergs/cm2
Band function

Time interval is from   -0.040 sec. to    0.392 sec.

Spectral model in the Band function:
------------------------------------------------------------
Parameters  : value       lower 90%   higher 90%
alpha       : 4.67066   ( -4.67066   -4.67066 )
beta        : -1.45268    ( -0.31327   0.293165 )
Epeak [keV] : 24.3819      ( -24.3819 9.01922 )
Norm@50keV   : 957.180    ( -140.038   7.14539e+06 )
------------------------------------------------------------
#Fit statistic : Chi-Squared =          51.61 using 59 PHA bins.
# Reduced chi-squared =         0.9384 for     55 degrees of freedom
# Null hypothesis probability =   6.048702e-01

Photon flux (15-150 keV)    in 0.432 sec:  (    ) ph/cm2/s
Energy fluence (15-150 keV)             : 0 ( 0  0 ) ergs/cm2
Single BB

Spectral model blackbody:
------------------------------------------------------------
Parameters  : value    Lower 90%  Upper 90%
kT [keV]    : 15.8806  (-3.88727  5.65236)
R^2/D10^2   : 0.166612  (-0.164019   0.274851)
(R is the radius in km and D10 is the distance to the source in units of 10 kpc)
------------------------------------------------------------
#Fit statistic : Chi-Squared =          70.18 using 59 PHA bins.
# Reduced chi-squared =          1.231 for     57 degrees of freedom
# Null hypothesis probability =   1.127649e-01

Energy  Fluence     90% Error
[keV]   [erg/cm2]   [erg/cm2]
15- 25  3.759e-09   1.153e-09
25- 50  1.572e-08   4.180e-09
50-150  2.763e-08   8.551e-09
15-150  4.711e-08   1.140e-08
Thermal bremsstrahlung (OTTB)

Spectral model: thermal bremsstrahlung
------------------------------------------------------------
Parameters  : value         Lower 90%    Upper 90%
kT [keV]    : 200.000       (      )
Norm        : 7.53578       (-1.11333     1.11324)
------------------------------------------------------------
#Fit statistic : Chi-Squared =          53.98 using 59 PHA bins.
# Reduced chi-squared =         0.9470 for     57 degrees of freedom
# Null hypothesis probability =   5.890651e-01

Energy  Fluence     90% Error
[keV]   [erg/cm2]   [erg/cm2]
15- 25  8.109e-09   4.687e-09
25- 50  1.560e-08   8.707e-09
50-150  3.421e-08   1.888e-08
15-150  5.792e-08   3.236e-08
Double BB

Spectral model: bbodyrad<1> + bbodyrad<2>
------------------------------------------------------------
Parameters  : value         Lower 90%    Upper 90%
kT1 [keV]   : 7.83382        (-2.11512      2.60434)
R1^2/D10^2  : 1.47178        (-0.92788      2.95196)
kT2 [keV]   : 41.7542        (-15.948      -41.7556)
R2^2/D10^2  : 6.03743E-03    (-0.00518174   0.0208217)
------------------------------------------------------------
#Fit statistic : Chi-Squared =          49.69 using 59 PHA bins.
# Reduced chi-squared =         0.9034 for     55 degrees of freedom
# Null hypothesis probability =   6.772112e-01

Energy  Fluence     90% Error
[keV]   [erg/cm2]   [erg/cm2]
15- 25  7.512e-09   4.255e-09
25- 50  1.564e-08   8.479e-09
50-150  4.241e-08   2.334e-08
15-150  6.556e-08   3.346e-08
Peak spectrum fit
Power-law model

Time interval is from   -0.316 sec. to    0.684 sec.

Spectral model in power-law:
------------------------------------------------------------
Parameters  : value       lower 90%   higher 90%
Photon index: 1.41630     ( -0.361069   0.36219 )
Norm@50keV  : 7.08742E-03    ( -0.00138676   0.00137382 )
------------------------------------------------------------
#Fit statistic : Chi-Squared =          66.07 using 59 PHA bins.
# Reduced chi-squared =          1.159 for     57 degrees of freedom
# Null hypothesis probability =   1.921262e-01

Photon flux (15-150 keV)    in 1 sec: 0.866362 ( -0.169454  0.170109 ) ph/cm2/s
Energy fluence (15-150 keV)             : 6.82589e-08 ( -1.47958e-08  1.50926e-08 ) ergs/cm2
Cutoff power-law model

Time interval is from   -0.316 sec. to    0.684 sec.
Spectral model in the cutoff power-law:
------------------------------------------------------------
Parameters  : value       lower 90%   higher 90%
Photon index: 1.40832     ( -0.361905   0.366274 )
Epeak [keV] : 9998.95      ( -9999.34 -9999.34 )
Norm@50keV  : 7.11096E-03    ( -0.00139184   0.0184422 )
------------------------------------------------------------
#Fit statistic : Chi-Squared =          66.08 using 59 PHA bins.
# Reduced chi-squared =          1.180 for     56 degrees of freedom
# Null hypothesis probability =   1.679144e-01

Photon flux (15-150 keV)    in 1 sec: 0.866762 ( -0.170056  0.169178 ) ph/cm2/s
Energy fluence (15-150 keV)             : 6.81355e-08 ( -1.50923e-08  1.50199e-08 ) ergs/cm2
Band function
Time interval is from   -0.316 sec. to    0.684 sec.

Spectral model in the Band function:
------------------------------------------------------------
Parameters  : value       lower 90%   higher 90%
alpha       : -1.12782   ( 1.1279   1.1279 )
beta        : -1.41406    ( 1.41667   0.361276 )
Epeak [keV] : 56.7558      ( -56.8232 -56.8232 )
Norm@50keV   : 1.25247E-02    ( -0.00680914   0 )
------------------------------------------------------------
#Fit statistic : Chi-Squared =          66.07 using 59 PHA bins.
# Reduced chi-squared =          1.201 for     55 degrees of freedom
# Null hypothesis probability =   1.458015e-01

Photon flux (15-150 keV)    in 1 sec:  (    ) ph/cm2/s
Energy fluence (15-150 keV)             : 0 ( 0  0 ) ergs/cm2
Single BB

Spectral model blackbody:
------------------------------------------------------------
Parameters  : value    Lower 90%  Upper 90%
kT [keV]    : 16.5268  (-4.41905  6.36016)
R^2/D10^2   : 6.87888E-02  (-0.0453453   0.132408)
(R is the radius in km and D10 is the distance to the source in units of 10 kpc)
------------------------------------------------------------
#Fit statistic : Chi-Squared =          75.14 using 59 PHA bins.
# Reduced chi-squared =          1.318 for     57 degrees of freedom
# Null hypothesis probability =   5.399247e-02

Energy  Fluence     90% Error
[keV]   [erg/cm2]   [erg/cm2]
15- 25  3.855e-09   1.854e-09
25- 50  1.667e-08   6.954e-09
50-150  3.220e-08   1.455e-08
15-150  5.273e-08   1.783e-08
Thermal bremsstrahlung (OTTB)

Spectral model: thermal bremsstrahlung
------------------------------------------------------------
Parameters  : value         Lower 90%    Upper 90%
kT [keV]    : 199.363       (-96.0984      -199.363)
Norm        : 3.55469       (-0.681838     0.681855)
------------------------------------------------------------
#Fit statistic : Chi-Squared =          66.91 using 59 PHA bins.
# Reduced chi-squared =          1.174 for     57 degrees of freedom
# Null hypothesis probability =   1.732946e-01

Energy  Fluence     90% Error
[keV]   [erg/cm2]   [erg/cm2]
15- 25  8.851e-09   5.160e-09
25- 50  1.703e-08   9.895e-09
50-150  3.734e-08   2.171e-08
15-150  6.322e-08   3.640e-08
Double BB
Spectral model: bbodyrad<1> + bbodyrad<2>
------------------------------------------------------------
Parameters  : value         Lower 90%    Upper 90%
kT1 [keV]   : 6.71129        (-4.08825      5.10766)
R1^2/D10^2  : 1.06145        (-0.890935      70.435)
kT2 [keV]   : 30.8324        (-13.1603      -30.8391)
R2^2/D10^2  : 7.29471E-03    (-0.00718341   0.041686)
------------------------------------------------------------
#Fit statistic : Chi-Squared =          66.40 using 59 PHA bins.
# Reduced chi-squared =          1.207 for     55 degrees of freedom
# Null hypothesis probability =   1.394682e-01

Energy  Fluence     90% Error
[keV]   [erg/cm2]   [erg/cm2]
15- 25  8.403e-09   5.080e-09
25- 50  1.590e-08   8.735e-09
50-150  4.549e-08   2.656e-08
15-150  6.979e-08   3.739e-08
Pre-slew spectrum (Pre-slew PHA with pre-slew DRM)
Power-law model

Spectral model in power-law:
------------------------------------------------------------
Parameters  : value       lower 90%   higher 90%
Photon index: 1.38215     ( -0.264783   0.263305 )
Norm@50keV  : 1.50394E-02    ( -0.00222714   0.00222054 )
------------------------------------------------------------
#Fit statistic : Chi-Squared =          52.10 using 59 PHA bins.
# Reduced chi-squared =         0.9141 for     57 degrees of freedom
# Null hypothesis probability =   6.589261e-01

Photon flux (15-150 keV)    in 0.432 sec: 1.82424 ( -0.276081  0.27686 ) ph/cm2/s
Energy fluence (15-150 keV)             : 6.3012e-08 ( -1.02909e-08  1.03975e-08 ) ergs/cm2
Cutoff power-law model

Spectral model in the cutoff power-law:
------------------------------------------------------------
Parameters  : value       lower 90%   higher 90%
Photon index: 1.37427     ( -0.299337   0.265755 )
Epeak [keV] : 9998.93      ( -9999.33 -9999.33 )
Norm@50keV  : 1.50868E-02    (     )
------------------------------------------------------------
#Fit statistic : Chi-Squared =          52.11 using 59 PHA bins.
# Reduced chi-squared =         0.9305 for     56 degrees of freedom
# Null hypothesis probability =   6.229231e-01

Photon flux (15-150 keV)    in 0.432 sec: 1.82536 ( -0.27777  0.27339 ) ph/cm2/s
Energy fluence (15-150 keV)             : 6.2767e-08 ( -1.00349e-08  1.05244e-08 ) ergs/cm2
Band function

Spectral model in the Band function:
------------------------------------------------------------
Parameters  : value       lower 90%   higher 90%
alpha       : 4.67066   ( -4.67066   -4.67066 )
beta        : -1.45268    ( -0.31327   0.293165 )
Epeak [keV] : 24.3819      ( -24.3819 9.01922 )
Norm@50keV   : 957.180    ( -140.038   7.14539e+06 )
------------------------------------------------------------
#Fit statistic : Chi-Squared =          51.61 using 59 PHA bins.
# Reduced chi-squared =         0.9384 for     55 degrees of freedom
# Null hypothesis probability =   6.048702e-01

Photon flux (15-150 keV)    in 0.432 sec:  (    ) ph/cm2/s
Energy fluence (15-150 keV)             : 0 ( 0  0 ) ergs/cm2
S(25-50 keV) vs. S(50-100 keV) plot
S(25-50 keV)  = 1.47e-08
S(50-100 keV) = 2.25e-08
T90 vs. Hardness ratio plot

T90                                   = 0.38400000333786 sec.
Hardness ratio (energy fluence ratio) = 1.53061
Color vs. Color plot
Count Ratio  (25-50 keV) / (15-25 keV) = 1.32298
Count Ratio (50-100 keV) / (15-25 keV) = 0.954208
Mask shadow pattern
IMX = 1.214797225773311E-01, IMY = -3.100959680103157E-01
TIME vs. PHA plot around the trigger time

Blue+Cyan dotted lines: Time interval of the scaled map
From 0.000000 to 0.256000
TIME vs. DetID plot around the trigger time
Blue+Cyan dotted lines: Time interval of the scaled map
From 0.000000 to 0.256000
100 us light curve (15-350 keV)

Blue+Cyan dotted lines: Time interval of the scaled map
From 0.000000 to 0.256000
Spacecraft aspect plot

Bright source in the pre-burst/pre-slew/post-slew images
Pre-burst image of 15-350 keV band
Time interval of the image:
-28.443410 -0.040000

# RAcent  DECcent POSerr Theta    Phi  PeakCts   SNR AngSep     Name
#  [deg]    [deg]    ['] [deg]  [deg]                   [']
170.4632 -60.7141    5.1  53.7 -150.9   0.5032   2.3    7.0	Cen X-3
186.6168 -62.7648    1.8  45.9 -149.6   0.8096   6.2    1.1	GX 301-2
244.9676 -15.6658    1.2  33.2  -43.2   0.7845   9.9    1.7	Sco X-1
255.9384 -37.8365    2.6   9.2  -52.4   0.2384   4.5    2.3	4U 1700-377
256.6589 -36.3108    0.0  10.1  -44.3   0.1207   2.3   12.7	GX 349+2
262.9394 -24.7449    5.5  20.0  -11.1  -0.1207  -2.1    3.8	GX 1+4
264.8628 -44.6127    3.9   0.6   71.5   0.1682   2.9   11.0	4U 1735-44
268.2596  -1.4409    5.5  43.4   -2.0   0.2128   2.1    6.5	SW J1753.5-0127
270.2815 -25.1161    3.8  20.2    8.4   0.1771   3.1    2.2	GX 5-1
270.4337 -25.6188    3.5  19.8    9.1   0.2093   3.7   10.3	GRS 1758-258
274.1255 -13.8960    6.8  32.0   10.6   0.1182   1.7   10.9	GX 17+2
275.8708 -30.3318    4.3  17.1   28.8   0.1585   2.7    3.5	H1820-303
285.1306 -25.0484    4.3  26.0   39.8   0.1895   2.7    9.2	HT1900.1-2455
262.9807 -33.9852    5.7  10.8  -12.9  -0.1199  -2.0    9.0	GX 354-0
312.4905 -32.4160    2.2  39.2   80.7   1.2463   5.2 ------	UNKNOWN
324.1864 -57.3348    2.2  38.4  123.0   0.8038   5.4 ------	UNKNOWN
292.8369 -38.1637    2.0  22.4   75.0   0.4153   5.8 ------	UNKNOWN
264.0920 -20.6490    2.1  24.1   -8.0   0.3307   5.6 ------	UNKNOWN
242.3792 -39.1925    2.4  17.0  -86.7   0.3069   4.8 ------	UNKNOWN
Pre-slew background subtracted image of 15-350 keV band
Time interval of the image:
-0.040000 0.392000

# RAcent  DECcent POSerr Theta    Phi  PeakCts   SNR AngSep     Name
#  [deg]    [deg]    ['] [deg]  [deg]                   [']
170.0587 -60.7384    5.7  53.9 -151.0  -0.0644  -2.0   10.2	Cen X-3
186.4401 -62.9406  394.6  45.9 -149.9  -0.0005  -0.0   11.8	GX 301-2
245.0745 -15.5332    9.2  33.3  -42.9   0.0137   1.3    8.4	Sco X-1
255.8045 -37.8039    4.4   9.3  -52.8   0.0209   2.6    9.0	4U 1700-377
256.2986 -36.2457    0.0  10.3  -45.5   0.0116   1.4   12.5	GX 349+2
263.1363 -24.9131    0.0  19.8  -10.6  -0.0314  -4.0   12.2	GX 1+4
264.8047 -44.4039    7.0   0.6   51.8   0.0125   1.6    3.8	4U 1735-44
268.4608  -1.5929   10.0  43.3   -1.7   0.0155   1.2   10.1	SW J1753.5-0127
270.3081 -24.9398    8.1  20.4    8.3   0.0119   1.4    8.5	GX 5-1
270.4510 -25.8630   13.0  19.6    9.3   0.0071   0.9   10.8	GRS 1758-258
274.1196 -13.9277    4.5  32.0   10.6  -0.0272  -2.5    9.3	GX 17+2
275.9558 -30.2194    6.8  17.3   28.8   0.0139   1.7    9.0	H1820-303
285.1816 -24.8409   11.4  26.2   39.6  -0.0101  -1.0    9.3	HT1900.1-2455
262.9658 -33.9833    7.4  10.8  -12.9   0.0121   1.6    9.0	GX 354-0
287.0265 -38.0345    1.1  18.4   68.6   0.1063  10.9 ------	UNKNOWN
280.7747   8.4765    2.3  55.3   12.1   0.2434   5.0 ------	UNKNOWN
259.7095 -57.6366    2.2  13.2 -177.9   0.0397   5.3 ------	UNKNOWN
255.8581 -54.3251    2.3  11.0 -162.2   0.0418   5.1 ------	UNKNOWN
Post-slew image of 15-350 keV band
Time interval of the image:
56.956590 962.509200

# RAcent  DECcent POSerr Theta    Phi  PeakCts   SNR AngSep     Name
#  [deg]    [deg]    ['] [deg]  [deg]                   [']
244.9805 -15.6280    1.6  43.1  -66.8  19.7329   7.2    0.7	Sco X-1
255.9786 -37.7018    6.1  24.4  -95.3   1.3176   1.9    8.6	4U 1700-377
256.4338 -36.4189    1.8  24.3  -92.1   4.2672   6.4    0.3	GX 349+2
263.1801 -24.7169    8.0  24.2  -60.0   0.9224   1.5    9.5	GX 1+4
264.8478 -44.4743    2.6  17.8 -114.7   2.3634   4.4    4.7	4U 1735-44
268.3392  -1.3826    6.2  40.4  -25.9   1.4099   1.9    4.5	SW J1753.5-0127
270.2880 -25.0944    1.8  19.2  -48.9   3.2052   6.6    0.9	GX 5-1
270.2545 -25.8477    4.5  18.6  -50.6   1.2703   2.6    6.8	GRS 1758-258
274.0334 -13.9871    1.9  26.6  -25.4   3.2555   6.0    3.4	GX 17+2
275.8666 -30.3990    2.7  11.9  -50.1   2.0754   4.2    3.6	H1820-303
284.9828 -24.9839   16.7  13.1   -4.4   0.3841   0.7    4.8	HT1900.1-2455
288.7703  10.9522    4.6  49.0    6.0   3.2450   2.5    1.7	GRS 1915+105
262.9605 -33.8559    1.9  19.8  -81.6   3.2220   6.0    1.9	GX 354-0
331.1911 -24.2418    3.3  39.8   86.6  10.0398   3.5 ------	UNKNOWN
303.1417  11.8093    3.1  52.0   23.9  11.8673   3.7 ------	UNKNOWN
287.9898  18.7815    2.9  56.8    4.8  15.1104   4.0 ------	UNKNOWN
287.8728   0.5837    1.7  38.6    5.1   5.0586   6.8 ------	UNKNOWN
282.1209  -3.2450    2.6  35.0   -4.8   3.0651   4.5 ------	UNKNOWN
277.4181 -23.7721    2.7  16.4  -29.0   2.1243   4.3 ------	UNKNOWN
159.9141 -79.0165    2.6  59.1 -166.1  15.4787   4.4 ------	UNKNOWN
257.4512   9.0606    2.9  54.5  -33.0  10.3103   3.9 ------	UNKNOWN
	UNKNOWN
Plot creation:
Sat May 30 21:22:49 EDT 2015