Special notes of this burst
Image
Pre-slew 15.0-350.0 keV image (Event data)
#   RAcent    DECcent   POSerr    Theta     Phi              Peak Cts       SNR   Name
  275.8715   -23.6671   0.0056    26.7661   145.9096         3.5045242     34.098 TRIG_00506070

Foreground time interval of the image:
-17.692  12.853 (delta_t =  30.545 [sec])
Background time interval of the image:
-90.947 -17.692 (delta_t =  73.255 [sec])
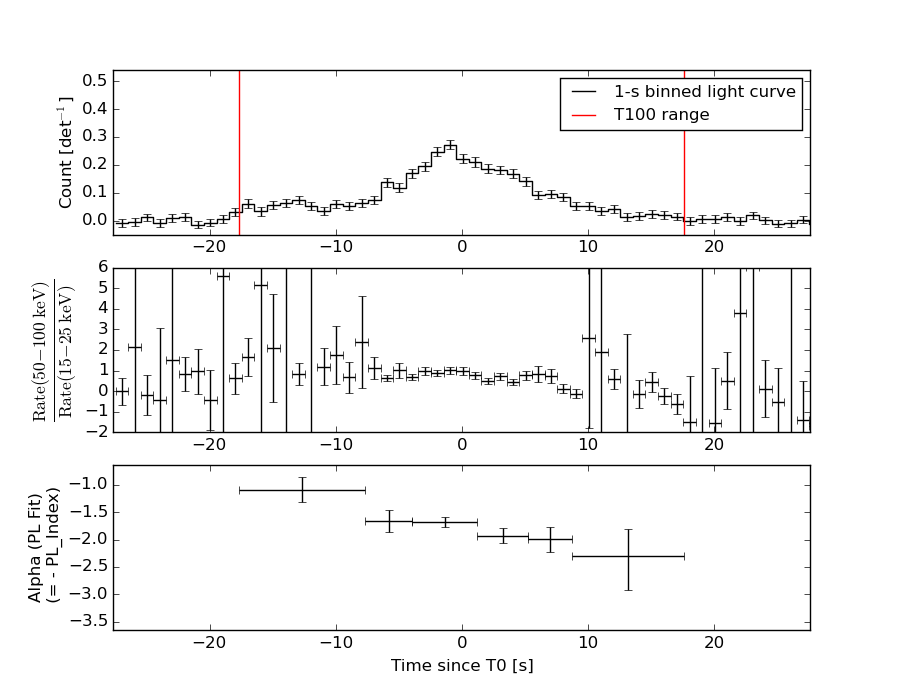
Lightcurves
Notes:
- 1) The mask-weighted light curves are using the flight position.
- 2) Multiple plots of different time binning/intervals are shown to cover all scenarios of short/long GRBs, rate/image triggers, and real/false positives.
- 3) For all the mask-weighted lightcurves, the y-axis units are counts/sec/det where a det is 0.4 x 0.4 = 0.16 sq cm.
- 4) The verticle lines correspond to following: green dotted lines are T50 interval, black dotted lines are T90 interval, blue solid line(s) is a spacecraft slew start time, and orange solid line(s) is a spacecraft slew end time.
- 5) Time of each bin is in the middle of the bin.
1 s binning
From T0-310 s to T0+310 s
From T100_start - 20 s to T100_end + 30 s
Full time interval
64 ms binning
Full time interval
From T100_start to T100_end
From T0-5 sec to T0+5 sec
16 ms binning
From T100_start-5 s to T100_start+5 s
8 ms binning
From T100_start-3 s to T100_start+3 s
2 ms binning
From T100_start-1 s to T100_start+1 s
SN=5 or 10 sec. binning (whichever binning is satisfied first)
SN=5 or 10 sec. binning (T < 200 sec)
Quad-rate summed light curves (from T0-300s to T0+1000s)

The mask-weighted light curves based on cleaned DPHs

Spectral Evolution
Spectra
Notes:
- 1) The fitting includes the systematic errors.
- 2) When the burst includes telescope slew time periods, the fitting uses an average response file made from multiple 5-s response files through out the slew time plus single time preiod for the non-slew times, and weighted by the total counts in the corresponding time period using addrmf. An average response file is needed becuase a spectral fit using the pre-slew DRM will introduce some errors in both a spectral shape and a normalization if the PHA file contains a lot of the slew/post-slew time interval.
- 3) For fits to more complicated models (e.g. a power-law over a cutoff power-law), the BAT team has decided to require a chi-square improvement of more than 6 for each extra dof.
Time averaged spectrum fit using the average DRM
Power-law model
Time interval is from  -17.692 sec. to   17.592 sec.

Spectral model in power-law:
------------------------------------------------------------
Parameters  : value       lower 90%   higher 90%
Photon index: 1.72544     ( -0.0800795   0.0808684 )
Norm@50keV  : 6.33391E-03    ( -0.000292197   0.000290962 )
------------------------------------------------------------
#Fit statistic : Chi-Squared =          71.87 using 59 PHA bins.
# Reduced chi-squared =          1.261 for     57 degrees of freedom
# Null hypothesis probability =   8.877223e-02

Photon flux (15-150 keV)    in 35.28 sec: 0.848829 ( -0.0381793  0.0382542 ) ph/cm2/s
Energy fluence (15-150 keV)             : 2.06512e-06 ( -9.92479e-08  9.98114e-08 ) ergs/cm2
Cutoff power-law model

Time interval is from  -17.692 sec. to   17.592 sec.
Spectral model in the cutoff power-law:
------------------------------------------------------------
Parameters  : value       lower 90%   higher 90%
Photon index: 0.932667     ( -0.401157   0.366054 )
Epeak [keV] : 63.7034      ( -8.09739 16.3854 )
Norm@50keV  : 1.63147E-02    ( -0.00568675   0.0099153 )
------------------------------------------------------------
#Fit statistic : Chi-Squared =          56.81 using 59 PHA bins.
# Reduced chi-squared =          1.014 for     56 degrees of freedom
# Null hypothesis probability =   4.447187e-01

Photon flux (15-150 keV)    in 35.28 sec: 0.808199 ( -0.041863  0.041992 ) ph/cm2/s
Energy fluence (15-150 keV)             : 1.91786e-06 ( -1.17006e-07  1.18308e-07 ) ergs/cm2
Band function
Time interval is from  -17.692 sec. to   17.592 sec.

Spectral model in the Band function:
------------------------------------------------------------
Parameters  : value       lower 90%   higher 90%
alpha       : -0.932596   ( -0.309516   0.3854 )
beta        : -10.0000    ( 10   3.55271e-15 )
Epeak [keV] : 63.6908      ( -7.08962 16.3813 )
Norm@50keV   : 1.63151E-02    ( -0.00569578   0.00992825 )
------------------------------------------------------------
#Fit statistic : Chi-Squared =          56.81 using 59 PHA bins.
# Reduced chi-squared =          1.033 for     55 degrees of freedom
# Null hypothesis probability =   4.074876e-01

Photon flux (15-150 keV)    in 35.28 sec: 0.810592 (    ) ph/cm2/s
Energy fluence (15-150 keV)             : 1.93994e-06 ( 0  0 ) ergs/cm2
Single BB
Spectral model blackbody:
------------------------------------------------------------
Parameters  : value    Lower 90%  Upper 90%
kT [keV]    : 12.7709  (  )
R^2/D10^2   : 0.161165  (   )
(R is the radius in km and D10 is the distance to the source in units of 10 kpc)
------------------------------------------------------------
#Fit statistic : Chi-Squared =         122.28 using 59 PHA bins.
# Reduced chi-squared =         2.1453 for     57 degrees of freedom
# Null hypothesis probability =   1.153999e-06

Energy  Fluence     90% Error
[keV]   [erg/cm2]   [erg/cm2]
15- 25  1.967e-07   1.568e-08
25- 50  6.644e-07   3.528e-08
50-150  6.779e-07   6.562e-08
15-150  1.539e-06   7.903e-08
Thermal bremsstrahlung (OTTB)
Spectral model: thermal bremsstrahlung
------------------------------------------------------------
Parameters  : value         Lower 90%    Upper 90%
kT [keV]    : 114.058       (-17.6902      31.5213)
Norm        : 3.66753       (-0.233288     0.200174)
------------------------------------------------------------
#Fit statistic : Chi-Squared =          59.44 using 59 PHA bins.
# Reduced chi-squared =          1.043 for     57 degrees of freedom
# Null hypothesis probability =   3.869293e-01

Energy  Fluence     90% Error
[keV]   [erg/cm2]   [erg/cm2]
15- 25  3.376e-07   2.729e-08
25- 50  5.986e-07   3.510e-08
50-150  1.041e-06   2.829e-07
15-150  1.978e-06   3.006e-07
Double BB
Spectral model: bbodyrad<1> + bbodyrad<2>
------------------------------------------------------------
Parameters  : value         Lower 90%    Upper 90%
kT1 [keV]   : 7.86550        (-1.3464      1.29582)
R1^2/D10^2  : 0.619306        (-0.220745      0.466227)
kT2 [keV]   : 23.7322        (-4.5261      7.90262)
R2^2/D10^2  : 1.10796E-02    (-0.00738326   0.0109911)
------------------------------------------------------------
#Fit statistic : Chi-Squared =          57.20 using 59 PHA bins.
# Reduced chi-squared =          1.040 for     55 degrees of freedom
# Null hypothesis probability =   3.935382e-01

Energy  Fluence     90% Error
[keV]   [erg/cm2]   [erg/cm2]
15- 25  2.806e-07   4.359e-08
25- 50  6.269e-07   1.118e-07
50-150  1.013e-06   3.369e-07
15-150  1.920e-06   4.556e-07
Peak spectrum fit
Power-law model
Time interval is from   -1.464 sec. to   -0.464 sec.

Spectral model in power-law:
------------------------------------------------------------
Parameters  : value       lower 90%   higher 90%
Photon index: 1.70637     ( -0.158409   0.162656 )
Norm@50keV  : 1.82041E-02    ( -0.00184915   0.00182709 )
------------------------------------------------------------
#Fit statistic : Chi-Squared =          65.02 using 59 PHA bins.
# Reduced chi-squared =          1.141 for     57 degrees of freedom
# Null hypothesis probability =   2.175120e-01

Photon flux (15-150 keV)    in 1 sec: 2.42310 ( -0.223874  0.224034 ) ph/cm2/s
Energy fluence (15-150 keV)             : 1.68465e-07 ( -1.78342e-08  1.80743e-08 ) ergs/cm2
Cutoff power-law model

Time interval is from   -1.464 sec. to   -0.464 sec.
Spectral model in the cutoff power-law:
------------------------------------------------------------
Parameters  : value       lower 90%   higher 90%
Photon index: 0.904608     ( -0.795597   0.666636 )
Epeak [keV] : 62.1412      ( -13.4945 76.8419 )
Norm@50keV  : 4.95835E-02    ( -0.0276122   0.083864 )
------------------------------------------------------------
#Fit statistic : Chi-Squared =          60.68 using 59 PHA bins.
# Reduced chi-squared =          1.084 for     56 degrees of freedom
# Null hypothesis probability =   3.110134e-01

Photon flux (15-150 keV)    in 1 sec: 2.34457 ( -0.23275  0.23283 ) ph/cm2/s
Energy fluence (15-150 keV)             : 1.56799e-07 ( -1.9784e-08  2.0357e-08 ) ergs/cm2
Band function
Time interval is from   -1.464 sec. to   -0.464 sec.

Spectral model in the Band function:
------------------------------------------------------------
Parameters  : value       lower 90%   higher 90%
alpha       : -0.904554   ( -0.531782   0.929643 )
beta        : -10.0000    ( 10   3.55271e-15 )
Epeak [keV] : 62.1287      ( -12.8193 76.8386 )
Norm@50keV   : 4.95845E-02    ( -0.0276109   0.0837895 )
------------------------------------------------------------
#Fit statistic : Chi-Squared =          60.68 using 59 PHA bins.
# Reduced chi-squared =          1.103 for     55 degrees of freedom
# Null hypothesis probability =   2.786198e-01

Photon flux (15-150 keV)    in 1 sec: 2.35719 (    ) ph/cm2/s
Energy fluence (15-150 keV)             : 1.618e-07 ( -1.61793e-07  -1.9185e-08 ) ergs/cm2
Single BB
Spectral model blackbody:
------------------------------------------------------------
Parameters  : value    Lower 90%  Upper 90%
kT [keV]    : 12.2338  (-1.28715  1.46553)
R^2/D10^2   : 0.555491  (-0.188943   0.2805)
(R is the radius in km and D10 is the distance to the source in units of 10 kpc)
------------------------------------------------------------
#Fit statistic : Chi-Squared =          78.35 using 59 PHA bins.
# Reduced chi-squared =          1.375 for     57 degrees of freedom
# Null hypothesis probability =   3.185513e-02

Energy  Fluence     90% Error
[keV]   [erg/cm2]   [erg/cm2]
15- 25  1.761e-08   2.880e-09
25- 50  5.668e-08   6.135e-09
50-150  5.166e-08   1.074e-08
15-150  1.259e-07   1.435e-08
Thermal bremsstrahlung (OTTB)
Spectral model: thermal bremsstrahlung
------------------------------------------------------------
Parameters  : value         Lower 90%    Upper 90%
kT [keV]    : 122.995       (-38.3446      67.9797)
Norm        : 10.2632       (-1.13054     1.4235)
------------------------------------------------------------
#Fit statistic : Chi-Squared =          61.51 using 59 PHA bins.
# Reduced chi-squared =          1.079 for     57 degrees of freedom
# Null hypothesis probability =   3.178736e-01

Energy  Fluence     90% Error
[keV]   [erg/cm2]   [erg/cm2]
15- 25  2.670e-08   3.225e-09
25- 50  4.798e-08   6.360e-09
50-150  8.666e-08   3.764e-08
15-150  1.613e-07   4.285e-08
Double BB
Spectral model: bbodyrad<1> + bbodyrad<2>
------------------------------------------------------------
Parameters  : value         Lower 90%    Upper 90%
kT1 [keV]   : 6.92033        (-2.20587      2.44035)
R1^2/D10^2  : 2.73209        (-1.61663      6.97349)
kT2 [keV]   : 21.3417        (-5.70103      15.3193)
R2^2/D10^2  : 5.11658E-02    (-0.0445341   0.136343)
------------------------------------------------------------
#Fit statistic : Chi-Squared =          60.20 using 59 PHA bins.
# Reduced chi-squared =          1.095 for     55 degrees of freedom
# Null hypothesis probability =   2.930264e-01

Energy  Fluence     90% Error
[keV]   [erg/cm2]   [erg/cm2]
15- 25  2.514e-08   1.166e-08
25- 50  5.051e-08   1.879e-08
50-150  8.157e-08   4.433e-08
15-150  1.572e-07   7.006e-08
Pre-slew spectrum (Pre-slew PHA with pre-slew DRM)
Power-law model
Spectral model in power-law:
------------------------------------------------------------
Parameters  : value       lower 90%   higher 90%
Photon index: 1.70396     ( -0.0766365   0.0773607 )
Norm@50keV  : 7.17286E-03    ( -0.00031702   0.000315779 )
------------------------------------------------------------
#Fit statistic : Chi-Squared =          71.42 using 59 PHA bins.
# Reduced chi-squared =          1.253 for     57 degrees of freedom
# Null hypothesis probability =   9.476280e-02

Photon flux (15-150 keV)    in 30.54 sec: 0.953963 ( -0.0415057  0.0415852 ) ph/cm2/s
Energy fluence (15-150 keV)             : 2.02758e-06 ( -9.37941e-08  9.4281e-08 ) ergs/cm2
Cutoff power-law model
Spectral model in the cutoff power-law:
------------------------------------------------------------
Parameters  : value       lower 90%   higher 90%
Photon index: 0.876144     ( -0.380085   0.349111 )
Epeak [keV] : 64.7391      ( -7.76794 14.6116 )
Norm@50keV  : 1.91541E-02    ( -0.00639297   0.0107735 )
------------------------------------------------------------
#Fit statistic : Chi-Squared =          53.16 using 59 PHA bins.
# Reduced chi-squared =         0.9493 for     56 degrees of freedom
# Null hypothesis probability =   5.829798e-01

Photon flux (15-150 keV)    in 30.54 sec: 0.906814 ( -0.045225  0.045368 ) ph/cm2/s
Energy fluence (15-150 keV)             : 1.88067e-06 ( -1.09196e-07  1.10381e-07 ) ergs/cm2
Band function

Spectral model in the Band function:
------------------------------------------------------------
Parameters  : value       lower 90%   higher 90%
alpha       : -0.876068   ( -0.259759   0.475211 )
beta        : -10.0000    ( 10   3.55271e-15 )
Epeak [keV] : 64.7259      ( -7.76701 14.6102 )
Norm@50keV   : 1.91550E-02    ( -0.00640147   0.0107852 )
------------------------------------------------------------
#Fit statistic : Chi-Squared =          53.16 using 59 PHA bins.
# Reduced chi-squared =         0.9666 for     55 degrees of freedom
# Null hypothesis probability =   5.451714e-01

Photon flux (15-150 keV)    in 30.54 sec: 0.911852 (    ) ph/cm2/s
Energy fluence (15-150 keV)             : 1.90252e-06 ( 0  0 ) ergs/cm2
S(25-50 keV) vs. S(50-100 keV) plot
S(25-50 keV)  = 5.65e-07
S(50-100 keV) = 6.83e-07
T90 vs. Hardness ratio plot
T90                                   = 22.8199999928474 sec.
Hardness ratio (energy fluence ratio) = 1.20885
Color vs. Color plot
Count Ratio  (25-50 keV) / (15-25 keV) = 1.41067
Count Ratio (50-100 keV) / (15-25 keV) = 0.82212
Mask shadow pattern
IMX = -4.177162113801573E-01, IMY = -2.827130661494183E-01
TIME vs. PHA plot around the trigger time
TIME vs. DetID plot around the trigger time
100 us light curve (15-350 keV)
Spacecraft aspect plot
Bright source in the pre-burst/pre-slew/post-slew images
Pre-burst image of 15-350 keV band
Time interval of the image:
-90.947410 -17.692000

# RAcent  DECcent POSerr Theta    Phi  PeakCts   SNR AngSep     Name
#  [deg]    [deg]    ['] [deg]  [deg]                   [']
244.9799 -15.6363    0.5  15.2 -125.8   2.6745  22.2    0.2	Sco X-1
254.2928  35.4181    7.1  40.4    7.5  -0.3167  -1.6    9.3	Her X-1
256.1081 -37.6793    0.0  32.7 -170.5   0.0521   0.3   11.4	4U 1700-377
256.2660 -36.3971    8.0  31.4 -170.8   0.2146   1.4    8.3	GX 349+2
263.1290 -24.5691    0.0  20.8  171.1  -0.1462  -1.1   12.4	GX 1+4
264.9482 -44.5689    0.0  40.4  179.8   0.1322   0.6   11.3	4U 1735-44
268.4496  -1.5226    6.2  12.9   84.6   0.2461   1.8    6.5	SW J1753.5-0127
270.1277 -25.0788   10.1  24.3  157.1  -0.1597  -1.1    8.5	GX 5-1
270.4532 -25.7328   10.8  25.0  157.4   0.1552   1.1    8.2	GRS 1758-258
273.8852 -14.2038    5.9  19.9  128.6  -0.2729  -2.0   12.3	GX 17+2
276.0905 -30.4031   22.5  31.7  155.3   0.0918   0.5    8.8	H1820-303
284.9022 -25.0045   12.8  34.2  138.5  -0.2063  -0.9    8.9	HT1900.1-2455
288.8648  10.9537    9.1  36.4   73.6  -0.4469  -1.3    3.9	GRS 1915+105
262.9233 -33.8455    5.0  29.6  177.9   0.3325   2.3    3.3	GX 354-0
276.0843  31.8441    3.4  41.5   35.8   0.8993   3.4 ------	UNKNOWN
232.6684  38.9634    2.1  48.9  -14.4   1.3782   5.4 ------	UNKNOWN
213.1725  19.6776    3.3  48.8  -48.6   2.3275   3.5 ------	UNKNOWN
Pre-slew background subtracted image of 15-350 keV band
Time interval of the image:
-17.692000 12.852580

# RAcent  DECcent POSerr Theta    Phi  PeakCts   SNR AngSep     Name
#  [deg]    [deg]    ['] [deg]  [deg]                   [']
245.0054 -15.4897   14.5  15.1 -125.4  -0.0676  -0.8    9.2	Sco X-1
254.6371  35.2126    0.0  40.2    7.9  -0.0449  -0.3   11.7	Her X-1
256.1365 -37.9782    5.6  33.0 -170.5   0.2000   2.1   10.7	4U 1700-377
256.4991 -36.3826    9.9  31.4 -171.1   0.1114   1.2    3.9	GX 349+2
263.1914 -24.8634    0.0  21.1  171.2   0.1735   2.0   12.2	GX 1+4
264.6835 -44.5028   25.2  40.3 -179.9  -0.0577  -0.5    4.1	4U 1735-44
268.5229  -1.4651    5.8  13.0   84.4  -0.1750  -2.0    9.3	SW J1753.5-0127
270.4196 -24.9855   15.7  24.3  156.4   0.0658   0.7    9.3	GX 5-1
270.2947 -25.7354    4.6  24.9  157.7   0.2256   2.5    0.6	GRS 1758-258
273.8875 -14.2151    0.0  19.9  128.6   0.1415   1.5   12.7	GX 17+2
275.9301 -30.3766 1399.6  31.6  155.5  -0.0010  -0.0    0.6	H1820-303
285.0577 -24.8391   21.1  34.2  138.1   0.0772   0.5    5.0	HT1900.1-2455
288.9256  11.0783    0.0  36.5   73.4  -0.1503  -0.7   10.9	GRS 1915+105
263.1705 -33.9525  273.4  29.7  177.6  -0.0039  -0.0   11.5	GX 354-0
275.8715 -23.6671    0.3  26.8  145.9   3.5056  34.1 ------	UNKNOWN
265.0294 -55.7953    2.4  51.3 -176.8   1.0029   4.8 ------	UNKNOWN
214.0132   7.5224    2.6  43.7  -64.0   1.5668   4.4 ------	UNKNOWN
Post-slew image of 15-350 keV band
Time interval of the image:
62.452580 962.582000

# RAcent  DECcent POSerr Theta    Phi  PeakCts   SNR AngSep     Name
#  [deg]    [deg]    ['] [deg]  [deg]                   [']
244.9815 -15.6409    0.4  30.1  -77.9  30.7569  32.0    0.1	Sco X-1
255.8236 -37.6748    0.0  22.1 -131.6   0.3615   0.6   12.8	4U 1700-377
256.3770 -36.4866    2.7  21.1 -129.5   2.6723   4.2    4.7	GX 349+2
262.8520 -24.5934   17.7  11.9  -94.8   0.4280   0.7   12.5	GX 1+4
264.8711 -44.3649    2.8  22.6 -156.8   2.5701   4.1    7.5	4U 1735-44
268.3597  -1.4376    2.8  23.4  -16.8   2.4635   4.2    1.0	SW J1753.5-0127
270.4089 -25.0826    4.2   5.2 -104.8   1.6880   2.8    6.8	GX 5-1
270.3364 -25.7461    3.5   5.4 -111.4   2.0629   3.4    1.8	GRS 1758-258
274.0711 -14.0471    3.5   9.8   -7.9   2.1445   3.3    3.9	GX 17+2
275.9640 -30.3358    2.5   6.7 -178.3   2.6939   4.6    2.8	H1820-303
285.0340 -24.9199   39.4   8.4  102.9  -0.1846  -0.3    0.1	HT1900.1-2455
288.8039  11.0215    4.5  36.9   23.9   2.5668   2.5    4.6	GRS 1915+105
262.9250 -33.8098    2.2  15.2 -132.4   2.9800   5.3    3.5	GX 354-0
327.4935 -52.5729    3.7  48.4  142.8   9.7641   3.1 ------	UNKNOWN
271.8947   8.6343    4.4  32.5   -4.9   2.0476   2.6 ------	UNKNOWN
265.8207 -80.5282    3.8  57.0 -175.6  10.2972   3.0 ------	UNKNOWN
255.2399 -41.6542    1.2  24.9 -138.9   6.1754   9.6 ------	UNKNOWN
Plot creation:
Sat May 30 21:20:39 EDT 2015