Special notes of this burst
Image
Pre-slew 15.0-350.0 keV image (Event data)
#   RAcent    DECcent   POSerr    Theta     Phi              Peak Cts       SNR   Name
  244.2564   -47.4387   0.0147    14.6611  -149.8393         0.2937930     13.080 TRIG_00506291

Foreground time interval of the image:
 -0.080   4.052 (delta_t =   4.132 [sec])
Background time interval of the image:
-239.512  -0.080 (delta_t = 239.432 [sec])
Lightcurves
Notes:
- 1) The mask-weighted light curves are using the flight position.
- 2) Multiple plots of different time binning/intervals are shown to cover all scenarios of short/long GRBs, rate/image triggers, and real/false positives.
- 3) For all the mask-weighted lightcurves, the y-axis units are counts/sec/det where a det is 0.4 x 0.4 = 0.16 sq cm.
- 4) The verticle lines correspond to following: green dotted lines are T50 interval, black dotted lines are T90 interval, blue solid line(s) is a spacecraft slew start time, and orange solid line(s) is a spacecraft slew end time.
- 5) Time of each bin is in the middle of the bin.
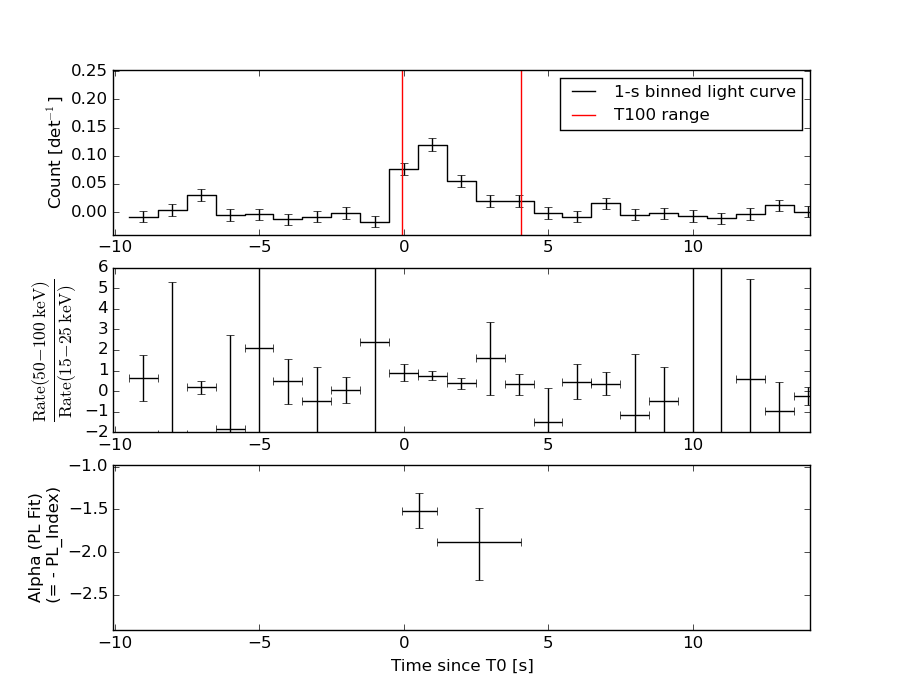
1 s binning
From T0-310 s to T0+310 s
From T100_start - 20 s to T100_end + 30 s
Full time interval
64 ms binning
Full time interval
From T100_start to T100_end
From T0-5 sec to T0+5 sec
16 ms binning
From T100_start-5 s to T100_start+5 s
Blue+Cyan dotted lines: Time interval of the scaled map
From 0.000000 to 0.256000
8 ms binning
From T100_start-3 s to T100_start+3 s
Blue+Cyan dotted lines: Time interval of the scaled map
From 0.000000 to 0.256000
2 ms binning
From T100_start-1 s to T100_start+1 s
Blue+Cyan dotted lines: Time interval of the scaled map
From 0.000000 to 0.256000
SN=5 or 10 sec. binning (whichever binning is satisfied first)
SN=5 or 10 sec. binning (T < 200 sec)
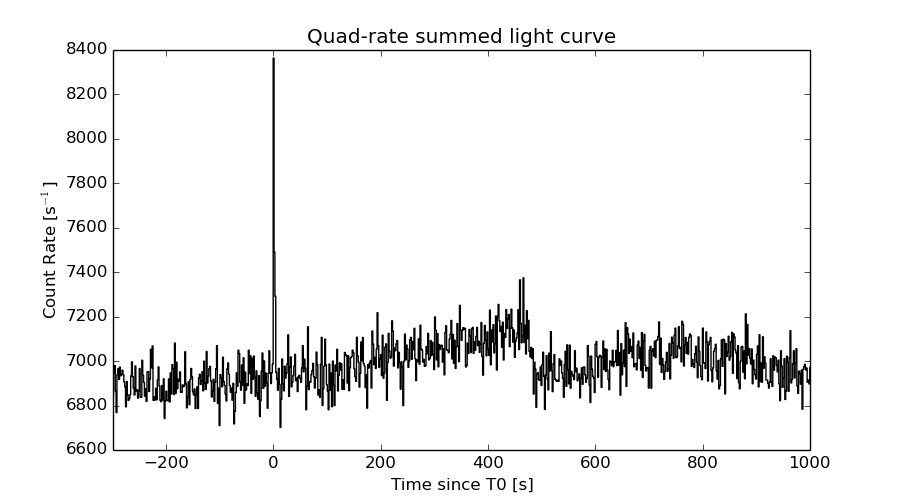
Quad-rate summed light curves (from T0-300s to T0+1000s)
Spectral Evolution
Spectra
Notes:
- 1) The fitting includes the systematic errors.
- 2) When the burst includes telescope slew time periods, the fitting uses an average response file made from multiple 5-s response files through out the slew time plus single time preiod for the non-slew times, and weighted by the total counts in the corresponding time period using addrmf. An average response file is needed becuase a spectral fit using the pre-slew DRM will introduce some errors in both a spectral shape and a normalization if the PHA file contains a lot of the slew/post-slew time interval.
- 3) For fits to more complicated models (e.g. a power-law over a cutoff power-law), the BAT team has decided to require a chi-square improvement of more than 6 for each extra dof.
Time averaged spectrum fit using the average DRM
Power-law model
Time interval is from   -0.080 sec. to    4.052 sec.

Spectral model in power-law:
------------------------------------------------------------
Parameters  : value       lower 90%   higher 90%
Photon index: 1.67949     ( -0.207159   0.211847 )
Norm@50keV  : 4.35258E-03    ( -0.000564382   0.000556388 )
------------------------------------------------------------
#Fit statistic : Chi-Squared =          53.15 using 59 PHA bins.
# Reduced chi-squared =         0.9324 for     57 degrees of freedom
# Null hypothesis probability =   6.203318e-01

Photon flux (15-150 keV)    in 4.132 sec: 0.573992 ( -0.0686981  0.0687791 ) ph/cm2/s
Energy fluence (15-150 keV)             : 1.66803e-07 ( -2.26188e-08  2.30125e-08 ) ergs/cm2
Cutoff power-law model
Time interval is from   -0.080 sec. to    4.052 sec.
Spectral model in the cutoff power-law:
------------------------------------------------------------
Parameters  : value       lower 90%   higher 90%
Photon index: 1.08845     ( -1.03044   0.726537 )
Epeak [keV] : 69.3822      ( -20.8231 -69.385 )
Norm@50keV  : 9.17900E-03    ( -0.00519522   0.0246503 )
------------------------------------------------------------
#Fit statistic : Chi-Squared =          51.64 using 59 PHA bins.
# Reduced chi-squared =         0.9222 for     56 degrees of freedom
# Null hypothesis probability =   6.404075e-01

Photon flux (15-150 keV)    in 4.132 sec: 0.559601 ( -0.0717  0.071427 ) ph/cm2/s
Energy fluence (15-150 keV)             : 1.57088e-07 ( -2.60812e-08  2.66303e-08 ) ergs/cm2
Band function

Time interval is from   -0.080 sec. to    4.052 sec.

Spectral model in the Band function:
------------------------------------------------------------
Parameters  : value       lower 90%   higher 90%
alpha       : -1.12921   ( -0.542928   0.761579 )
beta        : -9.36913    ( 9.37156   19.3716 )
Epeak [keV] : 72.0110      ( -23.6746 90.5482 )
Norm@50keV   : 8.67180E-03    ( -0.00452846   0.00650754 )
------------------------------------------------------------
#Fit statistic : Chi-Squared =          51.65 using 59 PHA bins.
# Reduced chi-squared =         0.9391 for     55 degrees of freedom
# Null hypothesis probability =   6.033950e-01

Photon flux (15-150 keV)    in 4.132 sec: 0.560496 (    ) ph/cm2/s
Energy fluence (15-150 keV)             : 1.58202e-07 ( -1.58173e-07  -2.42664e-08 ) ergs/cm2
Single BB
Spectral model blackbody:
------------------------------------------------------------
Parameters  : value    Lower 90%  Upper 90%
kT [keV]    : 11.8840  (-1.62174  1.98766)
R^2/D10^2   : 0.144912  (-0.06312   0.105233)
(R is the radius in km and D10 is the distance to the source in units of 10 kpc)
------------------------------------------------------------
#Fit statistic : Chi-Squared =          63.45 using 59 PHA bins.
# Reduced chi-squared =          1.113 for     57 degrees of freedom
# Null hypothesis probability =   2.595489e-01

Energy  Fluence     90% Error
[keV]   [erg/cm2]   [erg/cm2]
15- 25  1.787e-08   3.804e-09
25- 50  5.560e-08   9.111e-09
50-150  4.691e-08   1.290e-08
15-150  1.204e-07   1.897e-08
Thermal bremsstrahlung (OTTB)

Spectral model: thermal bremsstrahlung
------------------------------------------------------------
Parameters  : value         Lower 90%    Upper 90%
kT [keV]    : 130.940       (-51.4888      -129.673)
Norm        : 2.41394       (-0.331102     0.44037)
------------------------------------------------------------
#Fit statistic : Chi-Squared =          51.74 using 59 PHA bins.
# Reduced chi-squared =         0.9077 for     57 degrees of freedom
# Null hypothesis probability =   6.720721e-01

Energy  Fluence     90% Error
[keV]   [erg/cm2]   [erg/cm2]
15- 25  2.587e-08   4.580e-09
25- 50  4.696e-08   1.394e-08
50-150  8.736e-08   4.991e-08
15-150  1.602e-07   6.427e-08
Double BB

Spectral model: bbodyrad<1> + bbodyrad<2>
------------------------------------------------------------
Parameters  : value         Lower 90%    Upper 90%
kT1 [keV]   : 7.92150        (-2.33832      2.32958)
R1^2/D10^2  : 0.473007        (-0.264817      0.426223)
kT2 [keV]   : 28.9349        (-11.3343      61.9107)
R2^2/D10^2  : 3.85365E-03    (-0.00367263   0.0222695)
------------------------------------------------------------
#Fit statistic : Chi-Squared =          50.10 using 59 PHA bins.
# Reduced chi-squared =         0.9109 for     55 degrees of freedom
# Null hypothesis probability =   6.620438e-01

Energy  Fluence     90% Error
[keV]   [erg/cm2]   [erg/cm2]
15- 25  2.415e-08   1.249e-08
25- 50  5.082e-08   2.535e-08
50-150  8.725e-08   4.763e-08
15-150  1.622e-07   7.268e-08
Peak spectrum fit
Power-law model

Time interval is from    0.000 sec. to    1.000 sec.

Spectral model in power-law:
------------------------------------------------------------
Parameters  : value       lower 90%   higher 90%
Photon index: 1.53331     ( -0.216796   0.217612 )
Norm@50keV  : 9.11082E-03    ( -0.0012043   0.00119431 )
------------------------------------------------------------
#Fit statistic : Chi-Squared =          60.11 using 59 PHA bins.
# Reduced chi-squared =          1.054 for     57 degrees of freedom
# Null hypothesis probability =   3.639074e-01

Photon flux (15-150 keV)    in 1 sec: 1.14788 ( -0.147582  0.147782 ) ph/cm2/s
Energy fluence (15-150 keV)             : 8.59807e-08 ( -1.22738e-08  1.24495e-08 ) ergs/cm2
Cutoff power-law model
Time interval is from    0.000 sec. to    1.000 sec.
Spectral model in the cutoff power-law:
------------------------------------------------------------
Parameters  : value       lower 90%   higher 90%
Photon index: 1.07612     ( -1.36028   0.636618 )
Epeak [keV] : 90.6857      ( -40.9011 -91.3675 )
Norm@50keV  : 1.63391E-02    ( -0.00813412   0.0795114 )
------------------------------------------------------------
#Fit statistic : Chi-Squared =          59.53 using 59 PHA bins.
# Reduced chi-squared =          1.063 for     56 degrees of freedom
# Null hypothesis probability =   3.485971e-01

Photon flux (15-150 keV)    in 1 sec: 1.12925 ( -0.155199  0.15353 ) ph/cm2/s
Energy fluence (15-150 keV)             : 8.18174e-08 ( -1.61781e-08  1.52044e-08 ) ergs/cm2
Band function
Time interval is from    0.000 sec. to    1.000 sec.

Spectral model in the Band function:
------------------------------------------------------------
Parameters  : value       lower 90%   higher 90%
alpha       : 1.87753   ( -1.81324   -0.7039 )
beta        : -1.94924    ( -0.667658   0.478584 )
Epeak [keV] : 37.8403      ( -18.9861 40.628 )
Norm@50keV   : 1.39342    ( -1.35554   119.543 )
------------------------------------------------------------
#Fit statistic : Chi-Squared =          55.56 using 59 PHA bins.
# Reduced chi-squared =          1.010 for     55 degrees of freedom
# Null hypothesis probability =   4.534841e-01

Photon flux (15-150 keV)    in 1 sec:  (    ) ph/cm2/s
Energy fluence (15-150 keV)             : 0 ( 0  0 ) ergs/cm2
Single BB
Spectral model blackbody:
------------------------------------------------------------
Parameters  : value    Lower 90%  Upper 90%
kT [keV]    : 12.1212  (-1.60033  1.99706)
R^2/D10^2   : 0.280442  (-0.120827   0.192406)
(R is the radius in km and D10 is the distance to the source in units of 10 kpc)
------------------------------------------------------------
#Fit statistic : Chi-Squared =          66.67 using 59 PHA bins.
# Reduced chi-squared =          1.170 for     57 degrees of freedom
# Null hypothesis probability =   1.785642e-01

Energy  Fluence     90% Error
[keV]   [erg/cm2]   [erg/cm2]
15- 25  8.721e-09   1.867e-09
25- 50  2.777e-08   4.560e-09
50-150  2.470e-08   7.020e-09
15-150  6.119e-08   1.118e-08
Thermal bremsstrahlung (OTTB)
Spectral model: thermal bremsstrahlung
------------------------------------------------------------
Parameters  : value         Lower 90%    Upper 90%
kT [keV]    : 198.482       (-95.9503      -198.381)
Norm        : 4.69586       (-0.595377     0.713384)
------------------------------------------------------------
#Fit statistic : Chi-Squared =          59.49 using 59 PHA bins.
# Reduced chi-squared =          1.044 for     57 degrees of freedom
# Null hypothesis probability =   3.851486e-01

Energy  Fluence     90% Error
[keV]   [erg/cm2]   [erg/cm2]
15- 25  1.170e-08   6.595e-09
25- 50  2.250e-08   1.239e-08
50-150  4.926e-08   2.702e-08
15-150  8.346e-08   4.559e-08
Double BB
Spectral model: bbodyrad<1> + bbodyrad<2>
------------------------------------------------------------
Parameters  : value         Lower 90%    Upper 90%
kT1 [keV]   : 9.94073        (-1.64915      1.41925)
R1^2/D10^2  : 0.509756        (-0.207058      0.504246)
kT2 [keV]   : 199.269        (-199.363      -199.363)
R2^2/D10^2  : 1.29962E-04    (-4.7212e-05   0.0023637)
------------------------------------------------------------
#Fit statistic : Chi-Squared =          50.12 using 59 PHA bins.
# Reduced chi-squared =         0.9112 for     55 degrees of freedom
# Null hypothesis probability =   6.613380e-01

Energy  Fluence     90% Error
[keV]   [erg/cm2]   [erg/cm2]
15- 25  1.040e-08   3.691e-09
25- 50  2.665e-08   8.050e-09
50-150  4.734e-08   1.300e-08
15-150  8.440e-08   1.890e-08
Pre-slew spectrum (Pre-slew PHA with pre-slew DRM)
Power-law model

Spectral model in power-law:
------------------------------------------------------------
Parameters  : value       lower 90%   higher 90%
Photon index: 1.67949     ( -0.207159   0.211847 )
Norm@50keV  : 4.35258E-03    ( -0.000564382   0.000556388 )
------------------------------------------------------------
#Fit statistic : Chi-Squared =          53.15 using 59 PHA bins.
# Reduced chi-squared =         0.9324 for     57 degrees of freedom
# Null hypothesis probability =   6.203318e-01

Photon flux (15-150 keV)    in 4.132 sec: 0.573992 ( -0.0686981  0.0687791 ) ph/cm2/s
Energy fluence (15-150 keV)             : 1.66803e-07 ( -2.26188e-08  2.30125e-08 ) ergs/cm2
Cutoff power-law model

Spectral model in the cutoff power-law:
------------------------------------------------------------
Parameters  : value       lower 90%   higher 90%
Photon index: 1.08845     ( -1.03044   0.726537 )
Epeak [keV] : 69.3822      ( -20.8231 -69.385 )
Norm@50keV  : 9.17900E-03    ( -0.00519522   0.0246503 )
------------------------------------------------------------
#Fit statistic : Chi-Squared =          51.64 using 59 PHA bins.
# Reduced chi-squared =         0.9222 for     56 degrees of freedom
# Null hypothesis probability =   6.404075e-01

Photon flux (15-150 keV)    in 4.132 sec: 0.559601 ( -0.0717  0.071424 ) ph/cm2/s
Energy fluence (15-150 keV)             : 1.57088e-07 ( -2.60812e-08  2.66303e-08 ) ergs/cm2
Band function

Spectral model in the Band function:
------------------------------------------------------------
Parameters  : value       lower 90%   higher 90%
alpha       : -1.12921   ( -0.542928   0.761579 )
beta        : -9.36913    ( 9.37156   19.3716 )
Epeak [keV] : 72.0110      ( -23.6746 90.5323 )
Norm@50keV   : 8.67180E-03    ( -0.00452846   0.00650754 )
------------------------------------------------------------
#Fit statistic : Chi-Squared =          51.65 using 59 PHA bins.
# Reduced chi-squared =         0.9391 for     55 degrees of freedom
# Null hypothesis probability =   6.033950e-01

Photon flux (15-150 keV)    in 4.132 sec: 0.560496 (    ) ph/cm2/s
Energy fluence (15-150 keV)             : 1.58202e-07 ( -1.58173e-07  -2.42664e-08 ) ergs/cm2
S(25-50 keV) vs. S(50-100 keV) plot
S(25-50 keV)  = 4.48e-08
S(50-100 keV) = 5.59e-08
T90 vs. Hardness ratio plot
T90                                   = 3.5799999833107 sec.
Hardness ratio (energy fluence ratio) = 1.24777
Color vs. Color plot
Count Ratio  (25-50 keV) / (15-25 keV) = 1.37267
Count Ratio (50-100 keV) / (15-25 keV) = 0.708263
Mask shadow pattern
IMX = -2.262009851817328E-01, IMY = 1.314445653782226E-01
TIME vs. PHA plot around the trigger time
Blue+Cyan dotted lines: Time interval of the scaled map
From 0.000000 to 0.256000
TIME vs. DetID plot around the trigger time
Blue+Cyan dotted lines: Time interval of the scaled map
From 0.000000 to 0.256000
100 us light curve (15-350 keV)
Blue+Cyan dotted lines: Time interval of the scaled map
From 0.000000 to 0.256000
Spacecraft aspect plot
Bright source in the pre-burst/pre-slew/post-slew images
Pre-burst image of 15-350 keV band
Time interval of the image:
-239.512000 -0.080000

# RAcent  DECcent POSerr Theta    Phi  PeakCts   SNR AngSep     Name
#  [deg]    [deg]    ['] [deg]  [deg]                   [']
170.3165 -60.6278   41.0  57.5 -151.2   0.5149   0.3    0.3	Cen X-3
186.4947 -62.7025    4.9  49.6 -152.1   1.2524   2.3    6.0	GX 301-2
244.9695 -15.6451    0.3  23.4  -37.8   7.3533  34.7    0.6	Sco X-1
255.8235 -37.6757    0.0   1.7 -146.3  -0.1589  -0.8   12.7	4U 1700-377
256.4488 -36.3758    5.1   0.6  -98.1   0.4902   2.2    2.9	GX 349+2
263.0734 -24.6094    6.8  12.8   17.9   0.3589   1.7    8.9	GX 1+4
264.8354 -44.6007    5.2  10.0  140.6   0.4382   2.2    9.9	4U 1735-44
268.3472  -1.4600    4.0  36.4   12.2   0.8164   2.9    1.3	SW J1753.5-0127
270.2871 -25.0805    1.8  15.9   41.6   1.4030   6.5    0.2	GX 5-1
270.2589 -25.8862    3.6  15.3   43.6   0.6576   3.2    8.9	GRS 1758-258
273.9961 -14.0953    4.7  26.8   31.5   0.5944   2.4    3.6	GX 17+2
275.9578 -30.2209    3.6  16.8   67.2   0.6947   3.2    8.9	H1820-303
285.1159 -24.8579   15.7  26.5   65.3   0.2131   0.7    5.7	HT1900.1-2455
263.0020 -33.8054    2.4   5.4   56.4   1.0466   4.8    1.9	GX 354-0
293.3534 -21.1135    3.1  34.9   67.3   1.8354   3.7 ------	UNKNOWN
279.8787   5.5175    2.3  46.9   24.9   2.8593   5.1 ------	UNKNOWN
344.9495 -80.0295    3.8  53.9  160.9   3.8322   3.0 ------	UNKNOWN
155.5851 -72.0313    3.4  59.1 -166.1   4.4149   3.4 ------	UNKNOWN
204.7790 -33.6885    2.8  42.5 -109.2   4.2086   4.1 ------	UNKNOWN
Pre-slew background subtracted image of 15-350 keV band
Time interval of the image:
-0.080000 4.052000

# RAcent  DECcent POSerr Theta    Phi  PeakCts   SNR AngSep     Name
#  [deg]    [deg]    ['] [deg]  [deg]                   [']
170.1717 -60.6097    5.4  57.5 -151.2  -0.3290  -2.1    4.3	Cen X-3
186.4948 -62.8511    8.3  49.6 -152.3  -0.0765  -1.4    6.6	GX 301-2
245.1325 -15.6394   32.6  23.4  -37.4  -0.0086  -0.4    8.8	Sco X-1
255.9220 -37.6861    6.7   1.7 -148.5  -0.0379  -1.7   10.0	4U 1700-377
256.3082 -36.4041    7.1   0.8 -100.1   0.0357   1.6    6.2	GX 349+2
262.8547 -24.6340    8.4  12.7   17.1  -0.0293  -1.4   10.8	GX 1+4
264.9473 -44.5260    5.5  10.0  140.0  -0.0432  -2.1    9.9	4U 1735-44
268.2460  -1.4052   24.8  36.4   12.0   0.0151   0.5    7.8	SW J1753.5-0127
270.2833 -25.0752   31.9  15.9   41.6  -0.0085  -0.4    0.2	GX 5-1
270.1728 -25.8877  728.8  15.2   43.3  -0.0004  -0.0   11.2	GRS 1758-258
274.0050 -14.0365   42.6  26.9   31.4   0.0076   0.3    0.0	GX 17+2
275.9253 -30.3891  280.5  16.7   67.6  -0.0010  -0.0    1.3	H1820-303
285.1057 -24.9979    4.9  26.4   65.6  -0.0773  -2.4    6.0	HT1900.1-2455
263.0080 -33.7301   28.1   5.4   55.7   0.0086   0.4    6.3	GX 354-0
298.6803 -19.1733    2.4  40.1   69.3   0.4025   4.8 ------	UNKNOWN
244.2564 -47.4386    0.9  14.7 -149.8   0.2937  13.1 ------	UNKNOWN
197.6267 -48.0425    2.1  44.5 -131.4   0.3280   5.4 ------	UNKNOWN
230.0260   6.4746    2.3  49.9  -43.2   0.4762   4.9 ------	UNKNOWN
Post-slew image of 15-350 keV band
Time interval of the image:
491.888600 962.508000

# RAcent  DECcent POSerr Theta    Phi  PeakCts   SNR AngSep     Name
#  [deg]    [deg]    ['] [deg]  [deg]                   [']
244.9778 -15.6398    1.3  43.1  -61.6  12.4216   8.9    0.1	Sco X-1
255.9705 -37.7028   17.9  24.4  -90.1  -0.2657  -0.6    8.5	4U 1700-377
256.4551 -36.4094   10.9  24.3  -86.8   0.4373   1.1    1.3	GX 349+2
263.0195 -24.7705    3.2  24.3  -55.0   1.2982   3.6    1.6	GX 1+4
264.8159 -44.6008    5.0  17.8 -109.8   0.8247   2.3    9.6	4U 1735-44
268.3508  -1.4218    3.6  40.4  -20.7   1.4655   3.2    2.1	SW J1753.5-0127
270.2965 -25.0738    1.1  19.2  -43.5   3.0831  10.1    0.7	GX 5-1
270.2789 -25.7628    4.3  18.7  -45.1   0.8325   2.7    1.7	GRS 1758-258
274.0687 -13.8945    3.2  26.7  -20.0   1.2555   3.7    9.3	GX 17+2
275.8583 -30.3673    2.6  12.0  -44.7   1.3747   4.5    3.5	H1820-303
285.1368 -24.9411   12.6  13.2    1.4   0.2817   0.9    5.6	HT1900.1-2455
288.7649  10.9532    3.2  49.0   11.2   3.0355   3.7    2.0	GRS 1915+105
263.0963 -33.8320    2.2  19.7  -76.2   1.9379   5.2    5.3	GX 354-0
307.0439 -12.9702    3.4  30.7   49.7   1.8548   3.4 ------	UNKNOWN
293.7557  15.1872    3.3  53.6   17.0   6.7483   3.5 ------	UNKNOWN
301.6046 -13.9386    2.7  27.3   41.1   1.7797   4.3 ------	UNKNOWN
 34.4964 -77.0521    2.5  56.8  174.1  11.0852   4.7 ------	UNKNOWN
138.6310 -81.8189    3.1  59.1 -166.1   8.8081   3.7 ------	UNKNOWN
165.9418 -78.0741    3.8  58.8 -159.2   7.3308   3.0 ------	UNKNOWN
243.4066 -16.5896    2.5  43.7  -64.1   6.4880   4.6 ------	UNKNOWN
Plot creation:
Sat May 30 21:16:35 EDT 2015