Special notes of this burst
Image
Pre-slew 15.0-350.0 keV image (Event data)

#   RAcent    DECcent   POSerr    Theta     Phi              Peak Cts       SNR   Name
   44.7845    57.1039   0.0079    16.7802    95.7990         0.8894706     24.376 TRIG_00506519

Foreground time interval of the image:
 20.724  29.196 (delta_t =   8.472 [sec])
Background time interval of the image:
-239.000  20.724 (delta_t = 259.724 [sec])
Lightcurves
Notes:
- 1) The mask-weighted light curves are using the flight position.
- 2) Multiple plots of different time binning/intervals are shown to cover all scenarios of short/long GRBs, rate/image triggers, and real/false positives.
- 3) For all the mask-weighted lightcurves, the y-axis units are counts/sec/det where a det is 0.4 x 0.4 = 0.16 sq cm.
- 4) The verticle lines correspond to following: green dotted lines are T50 interval, black dotted lines are T90 interval, blue solid line(s) is a spacecraft slew start time, and orange solid line(s) is a spacecraft slew end time.
- 5) Time of each bin is in the middle of the bin.
1 s binning
From T0-310 s to T0+310 s

From T100_start - 20 s to T100_end + 30 s

Full time interval

64 ms binning
Full time interval

From T100_start to T100_end

From T0-5 sec to T0+5 sec
16 ms binning
From T100_start-5 s to T100_start+5 s
Blue+Cyan dotted lines: Time interval of the scaled map
From 0.000000 to 96.000000
8 ms binning
From T100_start-3 s to T100_start+3 s

Blue+Cyan dotted lines: Time interval of the scaled map
From 0.000000 to 96.000000
2 ms binning
From T100_start-1 s to T100_start+1 s
Blue+Cyan dotted lines: Time interval of the scaled map
From 0.000000 to 96.000000
SN=5 or 10 sec. binning (whichever binning is satisfied first)

SN=5 or 10 sec. binning (T < 200 sec)

Quad-rate summed light curves (from T0-300s to T0+1000s)
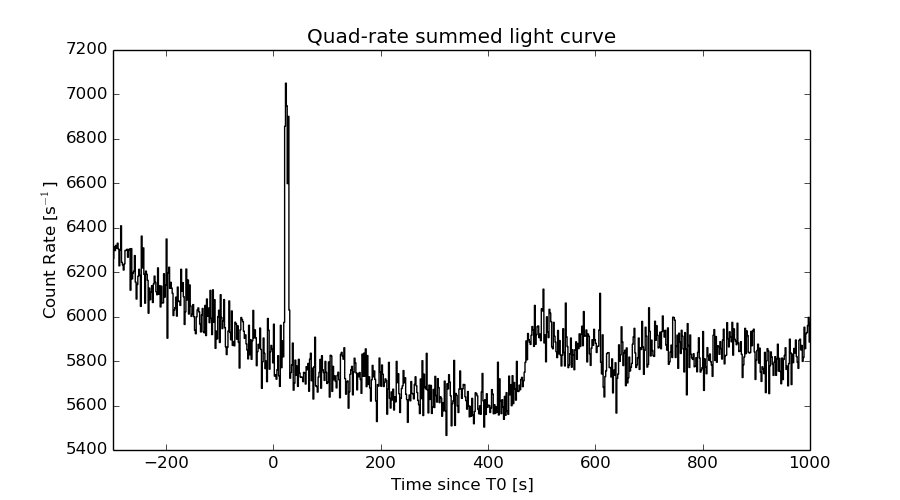
The mask-weighted light curves based on cleaned DPHs

Spectral Evolution

Spectra
Notes:
- 1) The fitting includes the systematic errors.
- 2) When the burst includes telescope slew time periods, the fitting uses an average response file made from multiple 5-s response files through out the slew time plus single time preiod for the non-slew times, and weighted by the total counts in the corresponding time period using addrmf. An average response file is needed becuase a spectral fit using the pre-slew DRM will introduce some errors in both a spectral shape and a normalization if the PHA file contains a lot of the slew/post-slew time interval.
- 3) For fits to more complicated models (e.g. a power-law over a cutoff power-law), the BAT team has decided to require a chi-square improvement of more than 6 for each extra dof.
Time averaged spectrum fit using the average DRM
Power-law model

Time interval is from   20.724 sec. to   29.196 sec.

Spectral model in power-law:
------------------------------------------------------------
Parameters  : value       lower 90%   higher 90%
Photon index: 2.11060     ( -0.128374   0.133365 )
Norm@50keV  : 5.35810E-03    ( -0.000487756   0.000482017 )
------------------------------------------------------------
#Fit statistic : Chi-Squared =          65.52 using 59 PHA bins.
# Reduced chi-squared =          1.149 for     57 degrees of freedom
# Null hypothesis probability =   2.053230e-01

Photon flux (15-150 keV)    in 8.472 sec: 0.847406 ( -0.0593594  0.0593776 ) ph/cm2/s
Energy fluence (15-150 keV)             : 4.22198e-07 ( -3.4637e-08  3.5148e-08 ) ergs/cm2
Cutoff power-law model
Time interval is from   20.724 sec. to   29.196 sec.
Spectral model in the cutoff power-law:
------------------------------------------------------------
Parameters  : value       lower 90%   higher 90%
Photon index: 0.767936     ( -0.776396   0.658423 )
Epeak [keV] : 36.1255      ( -6.05584 5.31864 )
Norm@50keV  : 3.36543E-02    (     )
------------------------------------------------------------
#Fit statistic : Chi-Squared =          51.39 using 59 PHA bins.
# Reduced chi-squared =         0.9177 for     56 degrees of freedom
# Null hypothesis probability =   6.497130e-01

Photon flux (15-150 keV)    in 8.472 sec: 0.807409 ( -0.06147  0.061736 ) ph/cm2/s
Energy fluence (15-150 keV)             : 3.73117e-07 ( -3.60382e-08  3.88018e-08 ) ergs/cm2
Band function

Time interval is from   20.724 sec. to   29.196 sec.

Spectral model in the Band function:
------------------------------------------------------------
Parameters  : value       lower 90%   higher 90%
alpha       : -0.529556   ( -0.899173   2.4964 )
beta        : -3.04694    ( 3.04398   0.65097 )
Epeak [keV] : 35.0314      ( -7.04224 6.21521 )
Norm@50keV   : 4.88679E-02    ( -0.0302405   3.54584 )
------------------------------------------------------------
#Fit statistic : Chi-Squared =          51.29 using 59 PHA bins.
# Reduced chi-squared =         0.9326 for     55 degrees of freedom
# Null hypothesis probability =   6.170117e-01

Photon flux (15-150 keV)    in 8.472 sec:  (    ) ph/cm2/s
Energy fluence (15-150 keV)             : 3.82158e-07 ( 0  0 ) ergs/cm2
Single BB

Spectral model blackbody:
------------------------------------------------------------
Parameters  : value    Lower 90%  Upper 90%
kT [keV]    : 9.34831  (-0.689015  0.743639)
R^2/D10^2   : 0.511943  (-0.133575   0.180508)
(R is the radius in km and D10 is the distance to the source in units of 10 kpc)
------------------------------------------------------------
#Fit statistic : Chi-Squared =          70.06 using 59 PHA bins.
# Reduced chi-squared =          1.229 for     57 degrees of freedom
# Null hypothesis probability =   1.147610e-01

Energy  Fluence     90% Error
[keV]   [erg/cm2]   [erg/cm2]
15- 25  7.517e-08   8.345e-09
25- 50  1.694e-07   1.406e-08
50-150  7.248e-08   1.474e-08
15-150  3.170e-07   2.830e-08
Thermal bremsstrahlung (OTTB)

Spectral model: thermal bremsstrahlung
------------------------------------------------------------
Parameters  : value         Lower 90%    Upper 90%
kT [keV]    : 52.7590       (-9.06944      12.3192)
Norm        : 4.69561       (-0.520044     0.633128)
------------------------------------------------------------
#Fit statistic : Chi-Squared =          53.20 using 59 PHA bins.
# Reduced chi-squared =         0.9333 for     57 degrees of freedom
# Null hypothesis probability =   6.184409e-01

Energy  Fluence     90% Error
[keV]   [erg/cm2]   [erg/cm2]
15- 25  9.842e-08   9.192e-09
25- 50  1.440e-07   1.067e-08
50-150  1.470e-07   2.868e-08
15-150  3.894e-07   3.643e-08
Double BB

Spectral model: bbodyrad<1> + bbodyrad<2>
------------------------------------------------------------
Parameters  : value         Lower 90%    Upper 90%
kT1 [keV]   : 5.78802        (-1.81378      1.77835)
R1^2/D10^2  : 2.00702        (-1.09724      5.15358)
kT2 [keV]   : 14.7648        (-3.41496      8.14181)
R2^2/D10^2  : 5.50679E-02    (-0.0479467   0.142836)
------------------------------------------------------------
#Fit statistic : Chi-Squared =          51.28 using 59 PHA bins.
# Reduced chi-squared =         0.9324 for     55 degrees of freedom
# Null hypothesis probability =   6.174576e-01

Energy  Fluence     90% Error
[keV]   [erg/cm2]   [erg/cm2]
15- 25  9.309e-08   3.184e-08
25- 50  1.497e-07   5.303e-08
50-150  1.283e-07   6.714e-08
15-150  3.711e-07   1.457e-07
Peak spectrum fit
Power-law model

Time interval is from   23.616 sec. to   24.616 sec.

Spectral model in power-law:
------------------------------------------------------------
Parameters  : value       lower 90%   higher 90%
Photon index: 2.21580     ( -0.212138   0.229761 )
Norm@50keV  : 8.81172E-03    ( -0.00149405   0.0014695 )
------------------------------------------------------------
#Fit statistic : Chi-Squared =          59.96 using 59 PHA bins.
# Reduced chi-squared =          1.052 for     57 degrees of freedom
# Null hypothesis probability =   3.688028e-01

Photon flux (15-150 keV)    in 1 sec: 1.47104 ( -0.17029  0.170314 ) ph/cm2/s
Energy fluence (15-150 keV)             : 8.30369e-08 ( -1.19591e-08  1.23344e-08 ) ergs/cm2
Cutoff power-law model

Time interval is from   23.616 sec. to   24.616 sec.
Spectral model in the cutoff power-law:
------------------------------------------------------------
Parameters  : value       lower 90%   higher 90%
Photon index: 1.00452     ( -1.25554   0.961155 )
Epeak [keV] : 30.4424      (   )
Norm@50keV  : 5.02581E-02    (     )
------------------------------------------------------------
#Fit statistic : Chi-Squared =          55.05 using 59 PHA bins.
# Reduced chi-squared =         0.9831 for     56 degrees of freedom
# Null hypothesis probability =   5.106766e-01

Photon flux (15-150 keV)    in 1 sec: 1.43606 ( -0.16994  0.17075 ) ph/cm2/s
Energy fluence (15-150 keV)             : 7.45864e-08 ( -1.18424e-08  1.32274e-08 ) ergs/cm2
Band function

Time interval is from   23.616 sec. to   24.616 sec.

Spectral model in the Band function:
------------------------------------------------------------
Parameters  : value       lower 90%   higher 90%
alpha       : -1.00304   ( -0.869048   1.35884 )
beta        : -10.0000    ( 10   0 )
Epeak [keV] : 30.4468      ( -8.71256 8.89361 )
Norm@50keV   : 5.03563E-02    ( -0.0503563   0.276107 )
------------------------------------------------------------
#Fit statistic : Chi-Squared =          55.05 using 59 PHA bins.
# Reduced chi-squared =          1.001 for     55 degrees of freedom
# Null hypothesis probability =   4.725909e-01

Photon flux (15-150 keV)    in 1 sec:  (    ) ph/cm2/s
Energy fluence (15-150 keV)             : 0 ( 0  0 ) ergs/cm2
Single BB
Spectral model blackbody:
------------------------------------------------------------
Parameters  : value    Lower 90%  Upper 90%
kT [keV]    : 8.16888  (-1.04  1.19119)
R^2/D10^2   : 1.52894  (-0.636859   1.09574)
(R is the radius in km and D10 is the distance to the source in units of 10 kpc)
------------------------------------------------------------
#Fit statistic : Chi-Squared =          64.04 using 59 PHA bins.
# Reduced chi-squared =          1.124 for     57 degrees of freedom
# Null hypothesis probability =   2.432039e-01

Energy  Fluence     90% Error
[keV]   [erg/cm2]   [erg/cm2]
15- 25  1.873e-08   3.570e-09
25- 50  3.398e-08   5.240e-09
50-150  9.553e-09   3.711e-09
15-150  6.226e-08   8.785e-09
Thermal bremsstrahlung (OTTB)

Spectral model: thermal bremsstrahlung
------------------------------------------------------------
Parameters  : value         Lower 90%    Upper 90%
kT [keV]    : 44.0741       (-11.2687      17.2947)
Norm        : 9.09966       (-1.67673     2.21774)
------------------------------------------------------------
#Fit statistic : Chi-Squared =          55.30 using 59 PHA bins.
# Reduced chi-squared =         0.9701 for     57 degrees of freedom
# Null hypothesis probability =   5.391698e-01

Energy  Fluence     90% Error
[keV]   [erg/cm2]   [erg/cm2]
15- 25  2.154e-08   3.090e-09
25- 50  2.950e-08   4.130e-09
50-150  2.529e-08   8.770e-09
15-150  7.633e-08   1.281e-08
Double BB

Spectral model: bbodyrad<1> + bbodyrad<2>
------------------------------------------------------------
Parameters  : value         Lower 90%    Upper 90%
kT1 [keV]   : 5.27675        (-1.69333      1.7537)
R1^2/D10^2  : 5.83417        (-3.60745      17.9578)
kT2 [keV]   : 14.6260        (-4.36813      9.84387)
R2^2/D10^2  : 9.38435E-02    (-0.0843962   0.197312)
------------------------------------------------------------
#Fit statistic : Chi-Squared =          53.85 using 59 PHA bins.
# Reduced chi-squared =         0.9790 for     55 degrees of freedom
# Null hypothesis probability =   5.187947e-01

Energy  Fluence     90% Error
[keV]   [erg/cm2]   [erg/cm2]
15- 25  2.174e-08   1.180e-08
25- 50  2.941e-08   1.515e-08
50-150  2.425e-08   1.503e-08
15-150  7.539e-08   3.913e-08
Pre-slew spectrum (Pre-slew PHA with pre-slew DRM)
Power-law model

Spectral model in power-law:
------------------------------------------------------------
Parameters  : value       lower 90%   higher 90%
Photon index: 2.11060     ( -0.128374   0.133365 )
Norm@50keV  : 5.35810E-03    ( -0.000487756   0.000482017 )
------------------------------------------------------------
#Fit statistic : Chi-Squared =          65.52 using 59 PHA bins.
# Reduced chi-squared =          1.149 for     57 degrees of freedom
# Null hypothesis probability =   2.053230e-01

Photon flux (15-150 keV)    in 8.472 sec: 0.847406 ( -0.0593594  0.0593776 ) ph/cm2/s
Energy fluence (15-150 keV)             : 4.22198e-07 ( -3.4637e-08  3.5148e-08 ) ergs/cm2
Cutoff power-law model

Spectral model in the cutoff power-law:
------------------------------------------------------------
Parameters  : value       lower 90%   higher 90%
Photon index: 0.767936     ( -0.776396   0.658423 )
Epeak [keV] : 36.1255      ( -6.05584 5.31864 )
Norm@50keV  : 3.36543E-02    (     )
------------------------------------------------------------
#Fit statistic : Chi-Squared =          51.39 using 59 PHA bins.
# Reduced chi-squared =         0.9177 for     56 degrees of freedom
# Null hypothesis probability =   6.497130e-01

Photon flux (15-150 keV)    in 8.472 sec: 0.807409 ( -0.06147  0.061736 ) ph/cm2/s
Energy fluence (15-150 keV)             : 3.73117e-07 ( -3.60382e-08  3.88018e-08 ) ergs/cm2
Band function

Spectral model in the Band function:
------------------------------------------------------------
Parameters  : value       lower 90%   higher 90%
alpha       : -0.529556   ( -0.899173   2.4964 )
beta        : -3.04694    ( 3.04398   0.65097 )
Epeak [keV] : 35.0314      ( -7.04224 6.21521 )
Norm@50keV   : 4.88679E-02    ( -0.0302405   3.54584 )
------------------------------------------------------------
#Fit statistic : Chi-Squared =          51.29 using 59 PHA bins.
# Reduced chi-squared =         0.9326 for     55 degrees of freedom
# Null hypothesis probability =   6.170117e-01

Photon flux (15-150 keV)    in 8.472 sec:  (    ) ph/cm2/s
Energy fluence (15-150 keV)             : 3.82158e-07 ( 0  0 ) ergs/cm2
S(25-50 keV) vs. S(50-100 keV) plot

S(25-50 keV)  = 1.31e-07
S(50-100 keV) = 1.21e-07
T90 vs. Hardness ratio plot

T90                                   = 7.19599997997284 sec.
Hardness ratio (energy fluence ratio) = 0.923664
Color vs. Color plot

Count Ratio  (25-50 keV) / (15-25 keV) = 1.13031
Count Ratio (50-100 keV) / (15-25 keV) = 0.445114
Mask shadow pattern

IMX = -3.046755108003812E-02, IMY = -2.999984922962267E-01
TIME vs. PHA plot around the trigger time

Blue+Cyan dotted lines: Time interval of the scaled map
From 0.000000 to 96.000000
TIME vs. DetID plot around the trigger time

Blue+Cyan dotted lines: Time interval of the scaled map
From 0.000000 to 96.000000
100 us light curve (15-350 keV)

Blue+Cyan dotted lines: Time interval of the scaled map
From 0.000000 to 96.000000
Spacecraft aspect plot
Bright source in the pre-burst/pre-slew/post-slew images
Pre-burst image of 15-350 keV band
Time interval of the image:
-239.000000 20.724000

# RAcent  DECcent POSerr Theta    Phi  PeakCts   SNR AngSep     Name
#  [deg]    [deg]    ['] [deg]  [deg]                   [']
308.2216  41.0408   10.9  56.7 -169.3   0.8602   1.1    7.3	Cyg X-3
326.1175  38.3298   11.4  54.5  173.9   0.8614   1.0    2.6	Cyg X-2
 10.3417  41.4026    2.4  38.9  131.9   2.1969   4.7 ------	UNKNOWN
351.9341  53.4852    2.3  33.3  159.8   1.4085   5.0 ------	UNKNOWN
 74.4451  60.9227    2.2  13.3   34.1   0.9734   5.2 ------	UNKNOWN
 68.3104  65.6060    3.0   8.0   39.5   0.6947   3.9 ------	UNKNOWN
127.9744  49.8511    2.6  37.0  -22.1   1.2120   4.5 ------	UNKNOWN
278.9817  50.8805    3.1  53.2 -142.2   4.8038   3.7 ------	UNKNOWN
269.6343  56.2086    3.7  49.2 -133.8   2.9706   3.1 ------	UNKNOWN
Pre-slew background subtracted image of 15-350 keV band
Time interval of the image:
20.724000 29.196000

# RAcent  DECcent POSerr Theta    Phi  PeakCts   SNR AngSep     Name
#  [deg]    [deg]    ['] [deg]  [deg]                   [']
307.9973  40.9430   22.8  56.9 -169.1   0.0675   0.5    5.2	Cyg X-3
326.0339  38.3141    4.6  54.5  174.0  -0.3483  -2.5    6.5	Cyg X-2
 31.9307  35.6803    2.4  39.6  103.7   0.5698   4.8 ------	UNKNOWN
 44.7845  57.1039    0.5  16.8   95.8   0.8896  24.3 ------	UNKNOWN
300.2826  40.8474    2.7  58.8 -162.6   0.7611   4.3 ------	UNKNOWN
Post-slew image of 15-350 keV band
Time interval of the image:
144.500600 235.900600

# RAcent  DECcent POSerr Theta    Phi  PeakCts   SNR AngSep     Name
#  [deg]    [deg]    ['] [deg]  [deg]                   [']
 83.6245  21.9846    0.7  45.1   19.0   3.6014  15.6    1.9	Crab
326.1782  38.4549    9.6  52.7  179.4  -0.4085  -1.2    8.0	Cyg X-2
291.5697  56.0320    3.3  54.8 -144.7   2.0520   3.5 ------	UNKNOWN
Plot creation:
Sat May 30 21:14:44 EDT 2015