Click here for the BAT GCN circular template
Image
Pre-slew 15.0-350.0 keV image (Event data)
#   RAcent    DECcent   POSerr    Theta     Phi              Peak Cts       SNR   Name
  327.1112   -10.5323   0.0076    31.5589   101.4708         2.2703735     25.171 TRIG_00506902

Foreground time interval of the image:
 -0.416  12.140 (delta_t =  12.556 [sec])
Background time interval of the image:
-109.523  -0.416 (delta_t = 109.107 [sec])
Lightcurves
Notes:
- 1) The mask-weighted light curves are using the flight position.
- 2) Multiple plots of different time binning/intervals are shown to cover all scenarios of short/long GRBs, rate/image triggers, and real/false positives.
- 3) For all the mask-weighted lightcurves, the y-axis units are counts/sec/det where a det is 0.4 x 0.4 = 0.16 sq cm.
- 4) The verticle lines correspond to following: green dotted lines are T50 interval, black dotted lines are T90 interval, blue solid line(s) is a spacecraft slew start time, and orange solid line(s) is a spacecraft slew end time.
- 5) Time of each bin is in the middle of the bin.
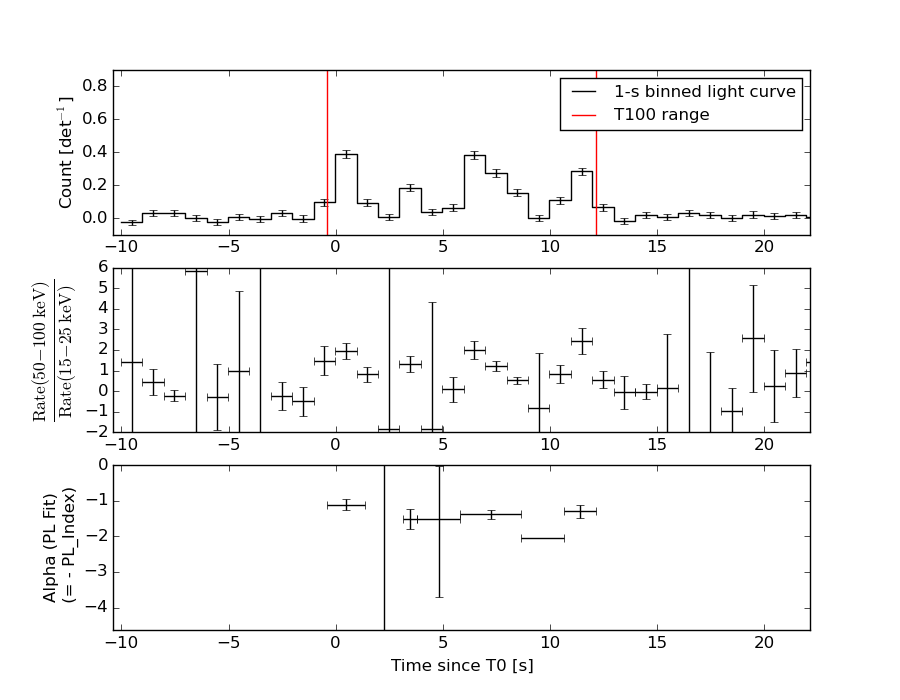
1 s binning
From T0-310 s to T0+310 s

From T100_start - 20 s to T100_end + 30 s

Full time interval
64 ms binning
Full time interval
From T100_start to T100_end

From T0-5 sec to T0+5 sec

16 ms binning
From T100_start-5 s to T100_start+5 s
Blue+Cyan dotted lines: Time interval of the scaled map
From 0.000000 to 1.024000
8 ms binning
From T100_start-3 s to T100_start+3 s
Blue+Cyan dotted lines: Time interval of the scaled map
From 0.000000 to 1.024000
2 ms binning
From T100_start-1 s to T100_start+1 s
Blue+Cyan dotted lines: Time interval of the scaled map
From 0.000000 to 1.024000
SN=5 or 10 sec. binning (whichever binning is satisfied first)

SN=5 or 10 sec. binning (T < 200 sec)

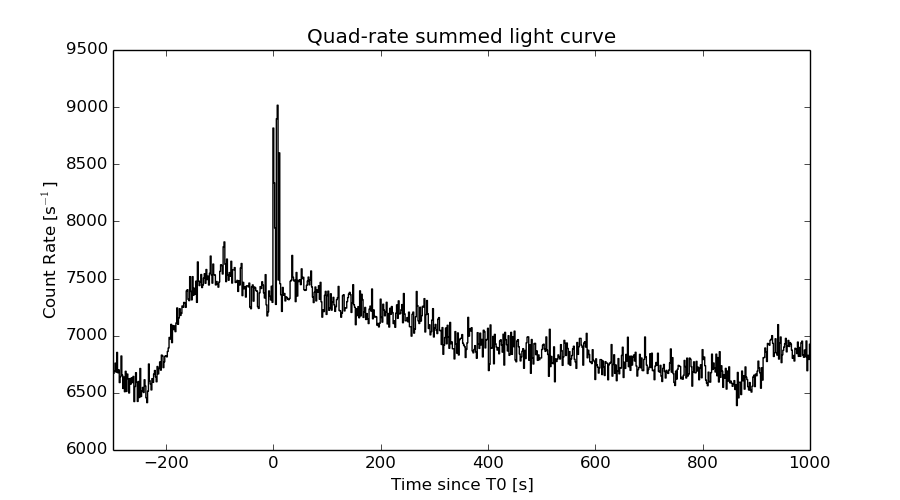
Quad-rate summed light curves (from T0-300s to T0+1000s)
Spectral Evolution
Spectra
Notes:
- 1) The fitting includes the systematic errors.
- 2) When the burst includes telescope slew time periods, the fitting uses an average response file made from multiple 5-s response files through out the slew time plus single time preiod for the non-slew times, and weighted by the total counts in the corresponding time period using addrmf. An average response file is needed becuase a spectral fit using the pre-slew DRM will introduce some errors in both a spectral shape and a normalization if the PHA file contains a lot of the slew/post-slew time interval.
- 3) For fits to more complicated models (e.g. a power-law over a cutoff power-law), the BAT team has decided to require a chi-square improvement of more than 6 for each extra dof.
Time averaged spectrum fit using the average DRM
Power-law model

Time interval is from   -0.416 sec. to   12.140 sec.

Spectral model in power-law:
------------------------------------------------------------
Parameters  : value       lower 90%   higher 90%
Photon index: 1.29207     ( -0.102096   0.101387 )
Norm@50keV  : 1.12661E-02    ( -0.000658653   0.000658625 )
------------------------------------------------------------
#Fit statistic : Chi-Squared =          65.16 using 59 PHA bins.
# Reduced chi-squared =          1.143 for     57 degrees of freedom
# Null hypothesis probability =   2.141087e-01

Photon flux (15-150 keV)    in 12.56 sec: 1.34213 ( -0.0815822  0.0817047 ) ph/cm2/s
Energy fluence (15-150 keV)             : 1.40102e-06 ( -8.97561e-08  9.01115e-08 ) ergs/cm2
Cutoff power-law model
Time interval is from   -0.416 sec. to   12.140 sec.
Spectral model in the cutoff power-law:
------------------------------------------------------------
Parameters  : value       lower 90%   higher 90%
Photon index: 0.927805     ( -0.435701   0.347119 )
Epeak [keV] : 155.912      ( -57.7798 -155.913 )
Norm@50keV  : 1.68791E-02    ( -0.00577492   0.0100619 )
------------------------------------------------------------
#Fit statistic : Chi-Squared =          62.68 using 59 PHA bins.
# Reduced chi-squared =          1.119 for     56 degrees of freedom
# Null hypothesis probability =   2.512991e-01

Photon flux (15-150 keV)    in 12.56 sec: 1.32071 ( -0.08488  0.08485 ) ph/cm2/s
Energy fluence (15-150 keV)             : 1.36865e-06 ( -9.80057e-08  9.74405e-08 ) ergs/cm2
Band function
Time interval is from   -0.416 sec. to   12.140 sec.

Spectral model in the Band function:
------------------------------------------------------------
Parameters  : value       lower 90%   higher 90%
alpha       : 4.97143   ( -5.30358   -4.97143 )
beta        : -1.36221    ( -0.131146   0.113563 )
Epeak [keV] : 25.5702      ( -11.9619 4.44462 )
Norm@50keV   : 831.439    ( -48.4382   2464.4 )
------------------------------------------------------------
#Fit statistic : Chi-Squared =          60.11 using 59 PHA bins.
# Reduced chi-squared =          1.093 for     55 degrees of freedom
# Null hypothesis probability =   2.960081e-01

Photon flux (15-150 keV)    in 12.56 sec:  (    ) ph/cm2/s
Energy fluence (15-150 keV)             : 0 ( 0  0 ) ergs/cm2
Single BB

Spectral model blackbody:
------------------------------------------------------------
Parameters  : value    Lower 90%  Upper 90%
kT [keV]    : 17.6104  (-1.31694  1.45514)
R^2/D10^2   : 9.18677E-02  (-0.0217416   0.0279273)
(R is the radius in km and D10 is the distance to the source in units of 10 kpc)
------------------------------------------------------------
#Fit statistic : Chi-Squared =         113.98 using 59 PHA bins.
# Reduced chi-squared =         1.9997 for     57 degrees of freedom
# Null hypothesis probability =   1.120249e-05

Energy  Fluence     90% Error
[keV]   [erg/cm2]   [erg/cm2]
15- 25  7.214e-08   8.239e-09
25- 50  3.281e-07   2.769e-08
50-150  7.343e-07   7.593e-08
15-150  1.135e-06   9.137e-08
Thermal bremsstrahlung (OTTB)

Spectral model: thermal bremsstrahlung
------------------------------------------------------------
Parameters  : value         Lower 90%    Upper 90%
kT [keV]    : 200.000       (      )
Norm        : 5.60045       (-0.330744     0.330696)
------------------------------------------------------------
#Fit statistic : Chi-Squared =          81.04 using 59 PHA bins.
# Reduced chi-squared =          1.422 for     57 degrees of freedom
# Null hypothesis probability =   1.990456e-02

Energy  Fluence     90% Error
[keV]   [erg/cm2]   [erg/cm2]
15- 25  1.751e-07   1.181e-08
25- 50  3.369e-07   2.656e-08
50-150  7.389e-07   1.464e-07
15-150  1.251e-06   1.601e-07
Double BB

Spectral model: bbodyrad<1> + bbodyrad<2>
------------------------------------------------------------
Parameters  : value         Lower 90%    Upper 90%
kT1 [keV]   : 8.38238        (-1.87493      2.24622)
R1^2/D10^2  : 0.671873        (-0.327944      0.799811)
kT2 [keV]   : 31.2441        (-6.60828      16.0144)
R2^2/D10^2  : 1.06633E-02    (-0.00775182   0.0100275)
------------------------------------------------------------
#Fit statistic : Chi-Squared =          62.19 using 59 PHA bins.
# Reduced chi-squared =          1.131 for     55 degrees of freedom
# Null hypothesis probability =   2.355040e-01

Energy  Fluence     90% Error
[keV]   [erg/cm2]   [erg/cm2]
15- 25  1.307e-07   3.300e-08
25- 50  3.349e-07   7.021e-08
50-150  9.118e-07   2.998e-07
15-150  1.377e-06   3.873e-07
Peak spectrum fit
Power-law model

Time interval is from    6.040 sec. to    7.040 sec.

Spectral model in power-law:
------------------------------------------------------------
Parameters  : value       lower 90%   higher 90%
Photon index: 1.18388     ( -0.161979   0.159007 )
Norm@50keV  : 2.70122E-02    ( -0.00265387   0.00265341 )
------------------------------------------------------------
#Fit statistic : Chi-Squared =          51.80 using 59 PHA bins.
# Reduced chi-squared =         0.9087 for     57 degrees of freedom
# Null hypothesis probability =   6.700499e-01

Photon flux (15-150 keV)    in 1 sec: 3.16369 ( -0.320302  0.320856 ) ph/cm2/s
Energy fluence (15-150 keV)             : 2.75311e-07 ( -2.93328e-08  2.94889e-08 ) ergs/cm2
Cutoff power-law model

Time interval is from    6.040 sec. to    7.040 sec.
Spectral model in the cutoff power-law:
------------------------------------------------------------
Parameters  : value       lower 90%   higher 90%
Photon index: 0.363835     ( -0.825912   0.689632 )
Epeak [keV] : 106.161      ( -29.7707 240.873 )
Norm@50keV  : 6.70441E-02    ( -0.0352791   0.0949648 )
------------------------------------------------------------
#Fit statistic : Chi-Squared =          47.58 using 59 PHA bins.
# Reduced chi-squared =         0.8496 for     56 degrees of freedom
# Null hypothesis probability =   7.809998e-01

Photon flux (15-150 keV)    in 1 sec: 3.08281 ( -0.32957  0.32916 ) ph/cm2/s
Energy fluence (15-150 keV)             : 2.6311e-07 ( -3.2028e-08  3.1817e-08 ) ergs/cm2
Band function
Time interval is from    6.040 sec. to    7.040 sec.

Spectral model in the Band function:
------------------------------------------------------------
Parameters  : value       lower 90%   higher 90%
alpha       : 2.16850   ( -4.44696   -2.1685 )
beta        : -1.45509    ( 1.45509   0.239332 )
Epeak [keV] : 42.9525      ( -11.4407 93.412 )
Norm@50keV   : 3.24172    ( -3.24177   129.342 )
------------------------------------------------------------
#Fit statistic : Chi-Squared =          46.50 using 59 PHA bins.
# Reduced chi-squared =         0.8455 for     55 degrees of freedom
# Null hypothesis probability =   7.857105e-01

Photon flux (15-150 keV)    in 1 sec:  (    ) ph/cm2/s
Energy fluence (15-150 keV)             : 2.64238e-07 ( -2.64231e-07  -3.0401e-08 ) ergs/cm2
Single BB
Spectral model blackbody:
------------------------------------------------------------
Parameters  : value    Lower 90%  Upper 90%
kT [keV]    : 18.2314  (-2.07644  2.44179)
R^2/D10^2   : 0.204399  (-0.0707023   0.103213)
(R is the radius in km and D10 is the distance to the source in units of 10 kpc)
------------------------------------------------------------
#Fit statistic : Chi-Squared =          58.14 using 59 PHA bins.
# Reduced chi-squared =          1.020 for     57 degrees of freedom
# Null hypothesis probability =   4.331851e-01

Energy  Fluence     90% Error
[keV]   [erg/cm2]   [erg/cm2]
15- 25  1.355e-08   2.375e-09
25- 50  6.324e-08   9.165e-09
50-150  1.531e-07   2.610e-08
15-150  2.299e-07   3.030e-08
Thermal bremsstrahlung (OTTB)
Spectral model: thermal bremsstrahlung
------------------------------------------------------------
Parameters  : value         Lower 90%    Upper 90%
kT [keV]    : 200.000       (      )
Norm        : 13.1499       (-1.31916     1.31907)
------------------------------------------------------------
#Fit statistic : Chi-Squared =          63.57 using 59 PHA bins.
# Reduced chi-squared =          1.115 for     57 degrees of freedom
# Null hypothesis probability =   2.562514e-01

Energy  Fluence     90% Error
[keV]   [erg/cm2]   [erg/cm2]
15- 25  3.274e-08   8.380e-09
25- 50  6.298e-08   3.362e-08
50-150  1.381e-07   7.245e-08
15-150  2.338e-07   1.274e-07
Double BB

Spectral model: bbodyrad<1> + bbodyrad<2>
------------------------------------------------------------
Parameters  : value         Lower 90%    Upper 90%
kT1 [keV]   : 10.9008        (-4.67447      4.72863)
R1^2/D10^2  : 0.698144        (-0.366338      1.9581)
kT2 [keV]   : 35.7602        (-32.0387      -38.4761)
R2^2/D10^2  : 1.52445E-02    (-0.010413   0.0846775)
------------------------------------------------------------
#Fit statistic : Chi-Squared =          46.68 using 59 PHA bins.
# Reduced chi-squared =         0.8487 for     55 degrees of freedom
# Null hypothesis probability =   7.803048e-01

Energy  Fluence     90% Error
[keV]   [erg/cm2]   [erg/cm2]
15- 25  2.002e-08   1.091e-08
25- 50  6.627e-08   3.323e-08
50-150  1.802e-07   9.265e-08
15-150  2.665e-07   1.335e-07
Pre-slew spectrum (Pre-slew PHA with pre-slew DRM)
Power-law model

Spectral model in power-law:
------------------------------------------------------------
Parameters  : value       lower 90%   higher 90%
Photon index: 1.29207     ( -0.102096   0.101387 )
Norm@50keV  : 1.12661E-02    ( -0.000658653   0.000658625 )
------------------------------------------------------------
#Fit statistic : Chi-Squared =          65.16 using 59 PHA bins.
# Reduced chi-squared =          1.143 for     57 degrees of freedom
# Null hypothesis probability =   2.141087e-01

Photon flux (15-150 keV)    in 12.56 sec: 1.34213 ( -0.0815822  0.0817047 ) ph/cm2/s
Energy fluence (15-150 keV)             : 1.40102e-06 ( -8.97561e-08  9.01115e-08 ) ergs/cm2
Cutoff power-law model

Spectral model in the cutoff power-law:
------------------------------------------------------------
Parameters  : value       lower 90%   higher 90%
Photon index: 0.927805     ( -0.435701   0.347119 )
Epeak [keV] : 155.912      ( -57.7798 -155.913 )
Norm@50keV  : 1.68791E-02    ( -0.00577492   0.0100619 )
------------------------------------------------------------
#Fit statistic : Chi-Squared =          62.68 using 59 PHA bins.
# Reduced chi-squared =          1.119 for     56 degrees of freedom
# Null hypothesis probability =   2.512991e-01

Photon flux (15-150 keV)    in 12.56 sec: 1.32071 ( -0.08488  0.08485 ) ph/cm2/s
Energy fluence (15-150 keV)             : 1.36865e-06 ( -9.80057e-08  9.74405e-08 ) ergs/cm2
Band function

Spectral model in the Band function:
------------------------------------------------------------
Parameters  : value       lower 90%   higher 90%
alpha       : 4.97143   ( -5.53714   -4.97143 )
beta        : -1.36221    ( -0.131146   0.113563 )
Epeak [keV] : 25.5702      ( -11.9619 4.44462 )
Norm@50keV   : 831.439    ( -48.4382   2464.4 )
------------------------------------------------------------
#Fit statistic : Chi-Squared =          60.11 using 59 PHA bins.
# Reduced chi-squared =          1.093 for     55 degrees of freedom
# Null hypothesis probability =   2.960081e-01

Photon flux (15-150 keV)    in 12.56 sec:  (    ) ph/cm2/s
Energy fluence (15-150 keV)             : 0 ( 0  0 ) ergs/cm2
S(25-50 keV) vs. S(50-100 keV) plot
S(25-50 keV)  = 3.10e-07
S(50-100 keV) = 5.07e-07
T90 vs. Hardness ratio plot
T90                                   = 11.6159999370575 sec.
Hardness ratio (energy fluence ratio) = 1.63548
Color vs. Color plot
Count Ratio  (25-50 keV) / (15-25 keV) = 1.62257
Count Ratio (50-100 keV) / (15-25 keV) = 1.38141
Mask shadow pattern

IMX = -1.221479280713655E-01, IMY = -6.019483966175959E-01
TIME vs. PHA plot around the trigger time

Blue+Cyan dotted lines: Time interval of the scaled map
From 0.000000 to 1.024000
TIME vs. DetID plot around the trigger time
Blue+Cyan dotted lines: Time interval of the scaled map
From 0.000000 to 1.024000
100 us light curve (15-350 keV)

Blue+Cyan dotted lines: Time interval of the scaled map
From 0.000000 to 1.024000
Spacecraft aspect plot

Bright source in the pre-burst/pre-slew/post-slew images
Pre-burst image of 15-350 keV band
Time interval of the image:
-109.523410 -0.416000

# RAcent  DECcent POSerr Theta    Phi  PeakCts   SNR AngSep     Name
#  [deg]    [deg]    ['] [deg]  [deg]                   [']
256.0286 -37.8428    1.9  44.4 -126.5   2.5039   6.0    2.0	4U 1700-377
256.3973 -36.5433    7.6  43.5 -125.1   0.6125   1.5    7.4	GX 349+2
262.9086 -24.6077   18.6  33.6 -111.0   0.1405   0.6    9.9	GX 1+4
264.7843 -44.4043    4.7  42.8 -139.8  -0.6042  -2.4    3.3	4U 1735-44
268.5075  -1.2949    0.0  27.9  -64.4   0.3435   2.1   12.6	SW J1753.5-0127
270.2894 -25.0738   33.8  27.7 -117.1  -0.0610  -0.3    0.4	GX 5-1
270.4312 -25.6803    5.6  27.8 -118.4   0.3691   2.1    7.9	GRS 1758-258
273.9960 -13.9379    4.2  20.8  -93.7   0.4104   2.7    5.9	GX 17+2
276.0780 -30.2291    0.0  26.5 -132.9   0.1004   0.7   11.5	H1820-303
284.8929 -25.0719    5.2  17.5 -139.9   0.2700   2.2   12.0	HT1900.1-2455
288.7462  10.9220    1.5  22.2   -8.2   1.0099   7.4    3.4	GRS 1915+105
299.5151  35.1983    2.8  45.8   13.4   1.0906   4.1    3.7	Cyg X-1
308.0992  40.9510    5.9  52.8   20.7   1.3985   2.0    0.5	Cyg X-3
262.9563 -33.8506    5.2  37.5 -125.4   0.4934   2.2    1.9	GX 354-0
286.9479 -28.2535    2.5  19.4 -149.9   0.5787   4.5 ------	UNKNOWN
253.4890 -33.5908    2.1  44.5 -119.8   3.2272   5.6 ------	UNKNOWN
Pre-slew background subtracted image of 15-350 keV band
Time interval of the image:
-0.416000 12.140000

# RAcent  DECcent POSerr Theta    Phi  PeakCts   SNR AngSep     Name
#  [deg]    [deg]    ['] [deg]  [deg]                   [']
255.8143 -37.6688    0.0  44.5 -126.2   0.3337   2.3   13.3	4U 1700-377
256.6068 -36.4142   14.9  43.3 -125.0   0.1030   0.8    8.3	GX 349+2
263.0049 -24.7692   23.1  33.6 -111.3   0.0376   0.5    1.4	GX 1+4
264.6769 -44.4377   15.6  42.9 -139.8   0.0550   0.7    2.9	4U 1735-44
268.4718  -1.5342    4.9  27.8  -64.9   0.1292   2.4    7.9	SW J1753.5-0127
270.1615 -25.0744    8.5  27.8 -117.0  -0.0764  -1.4    6.7	GX 5-1
270.1480 -25.8732    0.0  28.1 -118.4  -0.0545  -1.0   11.4	GRS 1758-258
274.0592 -14.1738    5.6  20.8  -94.3   0.1039   2.1    8.8	GX 17+2
276.0190 -30.3589    6.7  26.6 -133.0  -0.0874  -1.7    4.9	H1820-303
284.8569 -24.7839    0.0  17.3 -139.2  -0.1095  -2.6   12.7	HT1900.1-2455
288.6923  10.8330    3.7  22.1   -8.4  -0.1357  -3.1    9.2	GRS 1915+105
299.4972  35.0492    0.0  45.6   13.4  -0.0930  -1.0   10.2	Cyg X-1
308.1814  40.9201    8.0  52.7   20.7   0.3979   1.4    3.8	Cyg X-3
262.9933 -33.9681   12.5  37.6 -125.6  -0.0700  -0.9    8.0	GX 354-0
332.5723   2.9673    2.3  39.7   80.6   1.0615   5.1 ------	UNKNOWN
327.1112 -10.5323    0.5  31.6  101.5   2.2704  25.2 ------	UNKNOWN
288.1263  40.0707    2.9  50.9    1.5   0.4696   3.9 ------	UNKNOWN
Post-slew image of 15-350 keV band
Time interval of the image:
337.876600 879.576600

# RAcent  DECcent POSerr Theta    Phi  PeakCts   SNR AngSep     Name
#  [deg]    [deg]    ['] [deg]  [deg]                   [']
254.2951  35.3044   10.2  37.9  -45.0  -0.6954  -1.1    8.3	Her X-1
268.3731  -1.4536   26.6  34.3 -113.9   0.3046   0.4    0.3	SW J1753.5-0127
273.9533 -14.0508    3.2  40.7 -133.9   2.9441   3.6    3.2	GX 17+2
275.9283 -30.4129   12.2  54.7 -145.8   2.3949   0.9    2.8	H1820-303
285.0370 -24.9231   72.8  47.1 -153.7   0.1415   0.2    0.2	HT1900.1-2455
288.8046  10.9294    0.6  11.7 -136.2   7.6067  20.7    1.0	GRS 1915+105
299.5884  35.2026    1.7  14.6   30.6   2.5035   6.8    0.1	Cyg X-1
308.1119  40.9540    1.0  22.8   41.4   5.0351  11.8    0.1	Cyg X-3
325.9807  38.4679   46.1  31.9   64.7  -0.1716  -0.3   12.6	Cyg X-2
314.6646 -31.1004    2.7  55.8  173.6   8.1221   4.3 ------	UNKNOWN
274.4171  67.8611    2.4  48.3    4.3   3.7214   4.9 ------	UNKNOWN
277.4009   6.9777    2.7  21.9 -113.7   1.6301   4.3 ------	UNKNOWN
242.6634  48.1214    3.2  49.2  -29.6   2.9220   3.6 ------	UNKNOWN
287.7780 -37.1953    4.7  58.8 -159.2   7.6699   2.5 ------	UNKNOWN
Plot creation:
Sat May 30 21:13:00 EDT 2015