Special notes of this burst
Image
Pre-slew 15.0-350.0 keV image (Event data)
#   RAcent    DECcent   POSerr    Theta     Phi              Peak Cts       SNR   Name
  118.2477   -41.5889   0.0162    16.9931    34.9004         0.5006448     11.898 TRIG_00507342

Foreground time interval of the image:
 -5.600   8.400 (delta_t =  14.000 [sec])
Background time interval of the image:
-239.600  -5.600 (delta_t = 234.000 [sec])
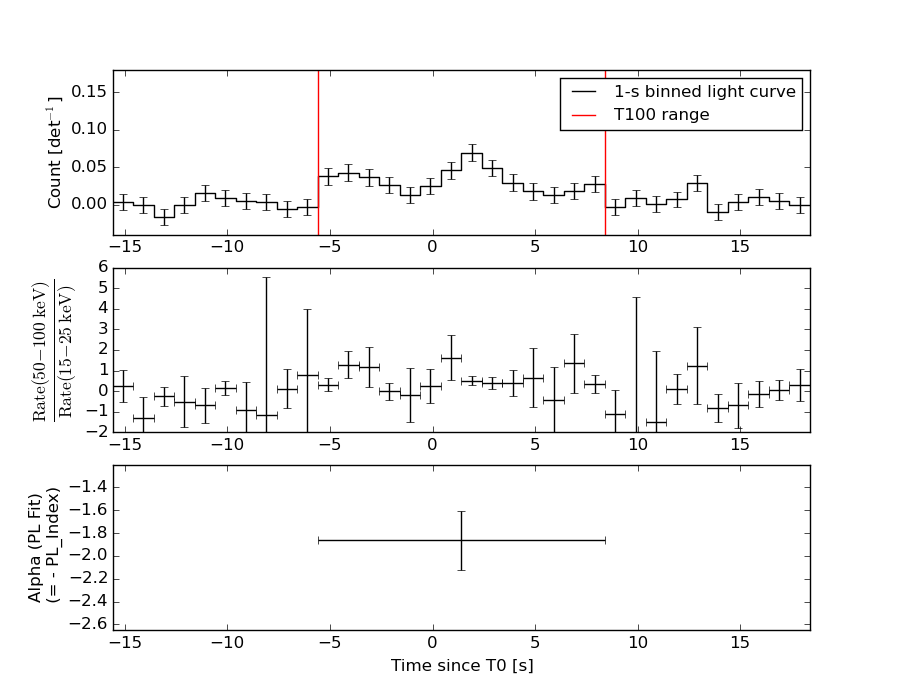
Lightcurves
Notes:
- 1) The mask-weighted light curves are using the flight position.
- 2) Multiple plots of different time binning/intervals are shown to cover all scenarios of short/long GRBs, rate/image triggers, and real/false positives.
- 3) For all the mask-weighted lightcurves, the y-axis units are counts/sec/det where a det is 0.4 x 0.4 = 0.16 sq cm.
- 4) The verticle lines correspond to following: green dotted lines are T50 interval, black dotted lines are T90 interval, blue solid line(s) is a spacecraft slew start time, and orange solid line(s) is a spacecraft slew end time.
- 5) Time of each bin is in the middle of the bin.
1 s binning
From T0-310 s to T0+310 s
From T100_start - 20 s to T100_end + 30 s
Full time interval
64 ms binning
Full time interval

From T100_start to T100_end

From T0-5 sec to T0+5 sec
16 ms binning
From T100_start-5 s to T100_start+5 s

Blue+Cyan dotted lines: Time interval of the scaled map
From 0.000000 to 4.096000
8 ms binning
From T100_start-3 s to T100_start+3 s
Blue+Cyan dotted lines: Time interval of the scaled map
From 0.000000 to 4.096000
2 ms binning
From T100_start-1 s to T100_start+1 s

Blue+Cyan dotted lines: Time interval of the scaled map
From 0.000000 to 4.096000
SN=5 or 10 sec. binning (whichever binning is satisfied first)
SN=5 or 10 sec. binning (T < 200 sec)
Quad-rate summed light curves (from T0-300s to T0+1000s)

The mask-weighted light curves based on cleaned DPHs

Spectral Evolution
Spectra
Notes:
- 1) The fitting includes the systematic errors.
- 2) When the burst includes telescope slew time periods, the fitting uses an average response file made from multiple 5-s response files through out the slew time plus single time preiod for the non-slew times, and weighted by the total counts in the corresponding time period using addrmf. An average response file is needed becuase a spectral fit using the pre-slew DRM will introduce some errors in both a spectral shape and a normalization if the PHA file contains a lot of the slew/post-slew time interval.
- 3) For fits to more complicated models (e.g. a power-law over a cutoff power-law), the BAT team has decided to require a chi-square improvement of more than 6 for each extra dof.
Time averaged spectrum fit using the average DRM
Power-law model

Time interval is from   -5.600 sec. to    8.400 sec.

Spectral model in power-law:
------------------------------------------------------------
Parameters  : value       lower 90%   higher 90%
Photon index: 1.85630     ( -0.248692   0.263331 )
Norm@50keV  : 1.89106E-03    ( -0.000330024   0.000321523 )
------------------------------------------------------------
#Fit statistic : Chi-Squared =          57.21 using 59 PHA bins.
# Reduced chi-squared =          1.004 for     57 degrees of freedom
# Null hypothesis probability =   4.671410e-01

Photon flux (15-150 keV)    in 14 sec: 0.266491 ( -0.0368864  0.0368867 ) ph/cm2/s
Energy fluence (15-150 keV)             : 2.43414e-07 ( -4.14949e-08  4.29625e-08 ) ergs/cm2
Cutoff power-law model
Time interval is from   -5.600 sec. to    8.400 sec.
Spectral model in the cutoff power-law:
------------------------------------------------------------
Parameters  : value       lower 90%   higher 90%
Photon index: 1.05744     ( -1.45053   1.05722 )
Epeak [keV] : 47.3900      ( -18.6689 -47.3891 )
Norm@50keV  : 5.62918E-03    ( -0.00562972   0.0363801 )
------------------------------------------------------------
#Fit statistic : Chi-Squared =          55.71 using 59 PHA bins.
# Reduced chi-squared =         0.9949 for     56 degrees of freedom
# Null hypothesis probability =   4.856560e-01

Photon flux (15-150 keV)    in 14 sec: 0.258580 ( -0.038125  0.038336 ) ph/cm2/s
Energy fluence (15-150 keV)             : 2.20609e-07 ( -4.58668e-08  5.25602e-08 ) ergs/cm2
Band function
Time interval is from   -5.600 sec. to    8.400 sec.

Spectral model in the Band function:
------------------------------------------------------------
Parameters  : value       lower 90%   higher 90%
alpha       : 1.56563   ( -1.54387   -1.54387 )
beta        : -2.10092    ( -1.0626   0.406598 )
Epeak [keV] : 28.0839      ( -28.2119 42.0721 )
Norm@50keV   : 0.556678    ( -0.47875   155.947 )
------------------------------------------------------------
#Fit statistic : Chi-Squared =          55.37 using 59 PHA bins.
# Reduced chi-squared =          1.007 for     55 degrees of freedom
# Null hypothesis probability =   4.607929e-01

Photon flux (15-150 keV)    in 14 sec:  (    ) ph/cm2/s
Energy fluence (15-150 keV)             : 2.26342e-07 ( 0  0 ) ergs/cm2
Single BB
Spectral model blackbody:
------------------------------------------------------------
Parameters  : value    Lower 90%  Upper 90%
kT [keV]    : 10.1525  (-1.53613  1.84853)
R^2/D10^2   : 0.119887  (-0.0562073   0.102821)
(R is the radius in km and D10 is the distance to the source in units of 10 kpc)
------------------------------------------------------------
#Fit statistic : Chi-Squared =          62.79 using 59 PHA bins.
# Reduced chi-squared =          1.102 for     57 degrees of freedom
# Null hypothesis probability =   2.785387e-01

Energy  Fluence     90% Error
[keV]   [erg/cm2]   [erg/cm2]
15- 25  3.541e-08   9.674e-09
25- 50  8.993e-08   1.610e-08
50-150  4.903e-08   1.835e-08
15-150  1.744e-07   3.375e-08
Thermal bremsstrahlung (OTTB)
Spectral model: thermal bremsstrahlung
------------------------------------------------------------
Parameters  : value         Lower 90%    Upper 90%
kT [keV]    : 78.9957       (-29.3886      67.1457)
Norm        : 1.26297       (-0.230264     0.305627)
------------------------------------------------------------
#Fit statistic : Chi-Squared =          55.81 using 59 PHA bins.
# Reduced chi-squared =         0.9790 for     57 degrees of freedom
# Null hypothesis probability =   5.199813e-01

Energy  Fluence     90% Error
[keV]   [erg/cm2]   [erg/cm2]
15- 25  4.584e-08   8.645e-09
25- 50  7.523e-08   1.395e-08
50-150  1.053e-07   5.996e-08
15-150  2.264e-07   6.216e-08
Double BB

Spectral model: bbodyrad<1> + bbodyrad<2>
------------------------------------------------------------
Parameters  : value         Lower 90%    Upper 90%
kT1 [keV]   : 5.91813        (-2.82391      3.56784)
R1^2/D10^2  : 0.571374        (-0.429832      5.84994)
kT2 [keV]   : 17.7062        (-6.40108      -17.7062)
R2^2/D10^2  : 1.01708E-02    (-0.010103   0.060467)
------------------------------------------------------------
#Fit statistic : Chi-Squared =          55.61 using 59 PHA bins.
# Reduced chi-squared =          1.011 for     55 degrees of freedom
# Null hypothesis probability =   4.517084e-01

Energy  Fluence     90% Error
[keV]   [erg/cm2]   [erg/cm2]
15- 25  4.547e-08   2.475e-08
25- 50  7.635e-08   3.930e-08
50-150  9.603e-08   5.917e-08
15-150  2.179e-07   1.133e-07
Peak spectrum fit
Power-law model

Time interval is from    1.400 sec. to    2.400 sec.

Spectral model in power-law:
------------------------------------------------------------
Parameters  : value       lower 90%   higher 90%
Photon index: 1.84504     ( -0.455955   0.510966 )
Norm@50keV  : 3.95497E-03    ( -0.00130033   0.00122933 )
------------------------------------------------------------
#Fit statistic : Chi-Squared =          68.08 using 59 PHA bins.
# Reduced chi-squared =          1.194 for     57 degrees of freedom
# Null hypothesis probability =   1.494907e-01

Photon flux (15-150 keV)    in 1 sec: 0.554795 ( -0.139672  0.139678 ) ph/cm2/s
Energy fluence (15-150 keV)             : 3.63677e-08 ( -1.13493e-08  1.20348e-08 ) ergs/cm2
Cutoff power-law model
Time interval is from    1.400 sec. to    2.400 sec.
Spectral model in the cutoff power-law:
------------------------------------------------------------
Parameters  : value       lower 90%   higher 90%
Photon index: 1.63981     ( -2.16039   0.621653 )
Epeak [keV] : 72.6038      (   )
Norm@50keV  : 5.22431E-03    (     )
------------------------------------------------------------
#Fit statistic : Chi-Squared =          68.03 using 59 PHA bins.
# Reduced chi-squared =          1.215 for     56 degrees of freedom
# Null hypothesis probability =   1.300496e-01

Photon flux (15-150 keV)    in 1 sec: 0.551032 ( -0.141975  0.142022 ) ph/cm2/s
Energy fluence (15-150 keV)             : 3.54684e-08 ( -1.2613e-08  1.27502e-08 ) ergs/cm2
Band function

Time interval is from    1.400 sec. to    2.400 sec.

Spectral model in the Band function:
------------------------------------------------------------
Parameters  : value       lower 90%   higher 90%
alpha       : -1.63161   ( -0.503862   0.990526 )
beta        : -9.34420    ( 9.37065   19.3706 )
Epeak [keV] : 76.7600      ( -58.3229 -76.5753 )
Norm@50keV   : 5.20964E-03    ( -0.00193527   0.0077657 )
------------------------------------------------------------
#Fit statistic : Chi-Squared =          68.03 using 59 PHA bins.
# Reduced chi-squared =          1.237 for     55 degrees of freedom
# Null hypothesis probability =   1.115132e-01

Photon flux (15-150 keV)    in 1 sec: 0.552698 (    ) ph/cm2/s
Energy fluence (15-150 keV)             : 3.51836e-08 ( 0  0 ) ergs/cm2
Single BB
Spectral model blackbody:
------------------------------------------------------------
Parameters  : value    Lower 90%  Upper 90%
kT [keV]    : 9.62901  (-2.99675  4.80087)
R^2/D10^2   : 0.296754  (-0.228393   0.916447)
(R is the radius in km and D10 is the distance to the source in units of 10 kpc)
------------------------------------------------------------
#Fit statistic : Chi-Squared =          72.69 using 59 PHA bins.
# Reduced chi-squared =          1.275 for     57 degrees of freedom
# Null hypothesis probability =   7.861511e-02

Energy  Fluence     90% Error
[keV]   [erg/cm2]   [erg/cm2]
15- 25  5.526e-09   3.415e-09
25- 50  1.301e-08   6.688e-09
50-150  6.080e-09   4.573e-09
15-150  2.462e-08   1.508e-08
Thermal bremsstrahlung (OTTB)

Spectral model: thermal bremsstrahlung
------------------------------------------------------------
Parameters  : value         Lower 90%    Upper 90%
kT [keV]    : 85.7200       (-49.321      -85.7188)
Norm        : 2.56008       (-0.772698     1.31426)
------------------------------------------------------------
#Fit statistic : Chi-Squared =          68.13 using 59 PHA bins.
# Reduced chi-squared =          1.195 for     57 degrees of freedom
# Null hypothesis probability =   1.484208e-01

Energy  Fluence     90% Error
[keV]   [erg/cm2]   [erg/cm2]
15- 25  6.668e-09   4.040e-09
25- 50  1.116e-08   6.687e-09
50-150  1.648e-08   1.310e-08
15-150  3.430e-08   2.226e-08
Double BB
Spectral model: bbodyrad<1> + bbodyrad<2>
------------------------------------------------------------
Parameters  : value         Lower 90%    Upper 90%
kT1 [keV]   : 5.47668        (-2.49718      3.64994)
R1^2/D10^2  : 1.86264        (-1.56233      20.9907)
kT2 [keV]   : 22.1470        (-19.1683      172.949)
R2^2/D10^2  : 1.02594E-02    (-0.0100609   0.114198)
------------------------------------------------------------
#Fit statistic : Chi-Squared =          67.28 using 59 PHA bins.
# Reduced chi-squared =          1.223 for     55 degrees of freedom
# Null hypothesis probability =   1.238562e-01

Energy  Fluence     90% Error
[keV]   [erg/cm2]   [erg/cm2]
15- 25  7.361e-09   4.438e-09
25- 50  1.015e-08   5.175e-09
50-150  1.839e-08   1.160e-08
15-150  3.590e-08   1.823e-08
Pre-slew spectrum (Pre-slew PHA with pre-slew DRM)
Power-law model
Spectral model in power-law:
------------------------------------------------------------
Parameters  : value       lower 90%   higher 90%
Photon index: 1.85630     ( -0.248692   0.263331 )
Norm@50keV  : 1.89106E-03    ( -0.000330024   0.000321523 )
------------------------------------------------------------
#Fit statistic : Chi-Squared =          57.21 using 59 PHA bins.
# Reduced chi-squared =          1.004 for     57 degrees of freedom
# Null hypothesis probability =   4.671410e-01

Photon flux (15-150 keV)    in 14 sec: 0.266491 ( -0.0368864  0.0368867 ) ph/cm2/s
Energy fluence (15-150 keV)             : 2.43414e-07 ( -4.14949e-08  4.29625e-08 ) ergs/cm2
Cutoff power-law model

Spectral model in the cutoff power-law:
------------------------------------------------------------
Parameters  : value       lower 90%   higher 90%
Photon index: 1.05744     ( -1.45053   1.05722 )
Epeak [keV] : 47.3900      ( -47.2888 -47.3891 )
Norm@50keV  : 5.62918E-03    ( -0.00562972   0.0363801 )
------------------------------------------------------------
#Fit statistic : Chi-Squared =          55.71 using 59 PHA bins.
# Reduced chi-squared =         0.9949 for     56 degrees of freedom
# Null hypothesis probability =   4.856560e-01

Photon flux (15-150 keV)    in 14 sec: 0.258580 ( -0.038125  0.038336 ) ph/cm2/s
Energy fluence (15-150 keV)             : 2.20609e-07 ( -4.58668e-08  5.25602e-08 ) ergs/cm2
Band function

Spectral model in the Band function:
------------------------------------------------------------
Parameters  : value       lower 90%   higher 90%
alpha       : 1.56563   ( -1.54387   -1.54387 )
beta        : -2.10092    ( -1.0626   0.406598 )
Epeak [keV] : 28.0839      ( -28.2119 42.0721 )
Norm@50keV   : 0.556678    ( -0.47875   162.03 )
------------------------------------------------------------
#Fit statistic : Chi-Squared =          55.37 using 59 PHA bins.
# Reduced chi-squared =          1.007 for     55 degrees of freedom
# Null hypothesis probability =   4.607929e-01

Photon flux (15-150 keV)    in 14 sec:  (    ) ph/cm2/s
Energy fluence (15-150 keV)             : 2.26342e-07 ( 0  0 ) ergs/cm2
S(25-50 keV) vs. S(50-100 keV) plot
S(25-50 keV)  = 7.00e-08
S(50-100 keV) = 7.73e-08
T90 vs. Hardness ratio plot

T90                                   = 13 sec.
Hardness ratio (energy fluence ratio) = 1.10429
Color vs. Color plot
Count Ratio  (25-50 keV) / (15-25 keV) = 1.27089
Count Ratio (50-100 keV) / (15-25 keV) = 0.582739
Mask shadow pattern
IMX = 2.506366746392414E-01, IMY = -1.748493670789323E-01
TIME vs. PHA plot around the trigger time

Blue+Cyan dotted lines: Time interval of the scaled map
From 0.000000 to 4.096000
TIME vs. DetID plot around the trigger time

Blue+Cyan dotted lines: Time interval of the scaled map
From 0.000000 to 4.096000
100 us light curve (15-350 keV)
Blue+Cyan dotted lines: Time interval of the scaled map
From 0.000000 to 4.096000
Spacecraft aspect plot
Bright source in the pre-burst/pre-slew/post-slew images
Pre-burst image of 15-350 keV band
Time interval of the image:
-239.600000 -5.600000

# RAcent  DECcent POSerr Theta    Phi  PeakCts   SNR AngSep     Name
#  [deg]    [deg]    ['] [deg]  [deg]                   [']
135.5126 -40.5483    1.2   8.2  -13.5   2.0397  10.0    0.8	Vela X-1
170.2622 -60.5856    2.0  35.9  -45.2   1.7150   5.6    2.7	Cen X-3
186.6556 -62.7183    5.3  43.7  -48.0   1.1526   2.2    3.1	GX 301-2
114.3120 -32.2557    2.4  18.5   67.3   1.1019   4.8 ------	UNKNOWN
 96.2382 -66.7674    2.6  41.6    5.2   1.4109   4.5 ------	UNKNOWN
 92.5749 -78.8272    2.9  49.9   -7.2   1.8138   4.0 ------	UNKNOWN
150.6959 -50.3127    3.1  20.9  -43.9   0.7442   3.8 ------	UNKNOWN
169.5947  16.9877    3.4  58.8 -159.3   4.7582   3.4 ------	UNKNOWN
Pre-slew background subtracted image of 15-350 keV band
Time interval of the image:
-5.600000 8.400000

# RAcent  DECcent POSerr Theta    Phi  PeakCts   SNR AngSep     Name
#  [deg]    [deg]    ['] [deg]  [deg]                   [']
135.2819 -40.6525   21.9   8.3  -12.3   0.0212   0.5   12.7	Vela X-1
170.2358 -60.4923   27.9  35.8  -45.3  -0.0242  -0.4    8.2	Cen X-3
186.5070 -62.7333    7.3  43.7  -47.9   0.1573   1.6    4.7	GX 301-2
 72.2043 -55.5630    2.4  49.4   24.8   0.7781   4.7 ------	UNKNOWN
118.2477 -41.5889    1.0  17.0   34.9   0.5006  11.9 ------	UNKNOWN
156.3569  17.9217    1.9  53.9 -173.3   0.7014   6.0 ------	UNKNOWN
Post-slew image of 15-350 keV band
Time interval of the image:
243.300610 546.300630

# RAcent  DECcent POSerr Theta    Phi  PeakCts   SNR AngSep     Name
#  [deg]    [deg]    ['] [deg]  [deg]                   [']
244.9823 -15.6296    0.2  29.0  -72.6  31.9594  64.0    0.7	Sco X-1
254.3040  35.4095    4.3  55.1    0.0   4.3188   2.7    8.5	Her X-1
256.2074 -37.9358    5.8  27.5 -125.6   0.9156   2.0   11.8	4U 1700-377
256.5154 -36.3905    3.8  26.2 -123.6   1.3660   3.1    4.3	GX 349+2
262.8176 -24.6435   15.4  14.4 -107.8   0.2718   0.7   12.1	GX 1+4
264.7714 -44.4631    6.9  29.7 -144.2   0.6836   1.7    1.5	4U 1735-44
268.3120  -1.4613    5.3  16.1   -4.8   0.7013   2.2    3.4	SW J1753.5-0127
270.2850 -25.1467    6.1  10.2 -133.3   0.7689   1.9    4.0	GX 5-1
270.2008 -25.9303    8.4  10.9 -134.9   0.5671   1.4   12.5	GRS 1758-258
274.0519 -14.0346    1.9   2.3   -7.7   2.1894   6.0    2.7	GX 17+2
275.7846 -30.3041    4.8  14.3 -161.4   0.7597   2.4    8.2	H1820-303
284.9244 -25.0555    7.6  12.8  156.9   0.4729   1.5   10.1	HT1900.1-2455
288.8077  10.9608    1.5  30.2   48.1   3.9739   7.5    1.1	GRS 1915+105
262.9547 -33.8995    2.3  21.0 -129.8   1.9083   4.9    4.2	GX 354-0
302.3189  -5.1262    2.8  28.8   91.4   2.4452   4.2 ------	UNKNOWN
269.8776  33.3409    2.6  49.7   14.9   4.2569   4.5 ------	UNKNOWN
276.5964  -9.3641    3.3   6.8   32.6   1.0798   3.6 ------	UNKNOWN
293.9929 -50.9288    2.7  38.0 -178.5   2.1082   4.4 ------	UNKNOWN
253.6981 -45.8593    2.4  34.8 -132.7   2.3883   4.7 ------	UNKNOWN
241.1350  -9.8269    3.0  33.7  -62.9   2.1559   3.8 ------	UNKNOWN
251.9772 -71.3095    2.3  57.0 -150.6   9.9105   4.9 ------	UNKNOWN
Plot creation:
Sat May 30 21:07:57 EDT 2015