Click here for the BAT GCN circular template
Image
Pre-slew 15.0-350.0 keV image (Event data)

#   RAcent    DECcent   POSerr    Theta     Phi              Peak Cts       SNR   Name
   12.7060    23.0100   0.0143    24.4439    63.6734         0.1740815     13.431 TRIG_00507901

Foreground time interval of the image:
  0.024   0.520 (delta_t =   0.496 [sec])
Background time interval of the image:
-60.203   0.024 (delta_t =  60.227 [sec])
Lightcurves
Notes:
- 1) The mask-weighted light curves are using the flight position.
- 2) Multiple plots of different time binning/intervals are shown to cover all scenarios of short/long GRBs, rate/image triggers, and real/false positives.
- 3) For all the mask-weighted lightcurves, the y-axis units are counts/sec/det where a det is 0.4 x 0.4 = 0.16 sq cm.
- 4) The verticle lines correspond to following: green dotted lines are T50 interval, black dotted lines are T90 interval, blue solid line(s) is a spacecraft slew start time, and orange solid line(s) is a spacecraft slew end time.
- 5) Time of each bin is in the middle of the bin.
1 s binning
From T0-310 s to T0+310 s

From T100_start - 20 s to T100_end + 30 s

Full time interval

64 ms binning
Full time interval

From T100_start to T100_end

From T0-5 sec to T0+5 sec

16 ms binning
From T100_start-5 s to T100_start+5 s

Blue+Cyan dotted lines: Time interval of the scaled map
From 0.000000 to 0.512000
8 ms binning
From T100_start-3 s to T100_start+3 s

Blue+Cyan dotted lines: Time interval of the scaled map
From 0.000000 to 0.512000
2 ms binning
From T100_start-1 s to T100_start+1 s

Blue+Cyan dotted lines: Time interval of the scaled map
From 0.000000 to 0.512000
SN=5 or 10 sec. binning (whichever binning is satisfied first)

SN=5 or 10 sec. binning (T < 200 sec)

Quad-rate summed light curves (from T0-300s to T0+1000s)

Spectral Evolution

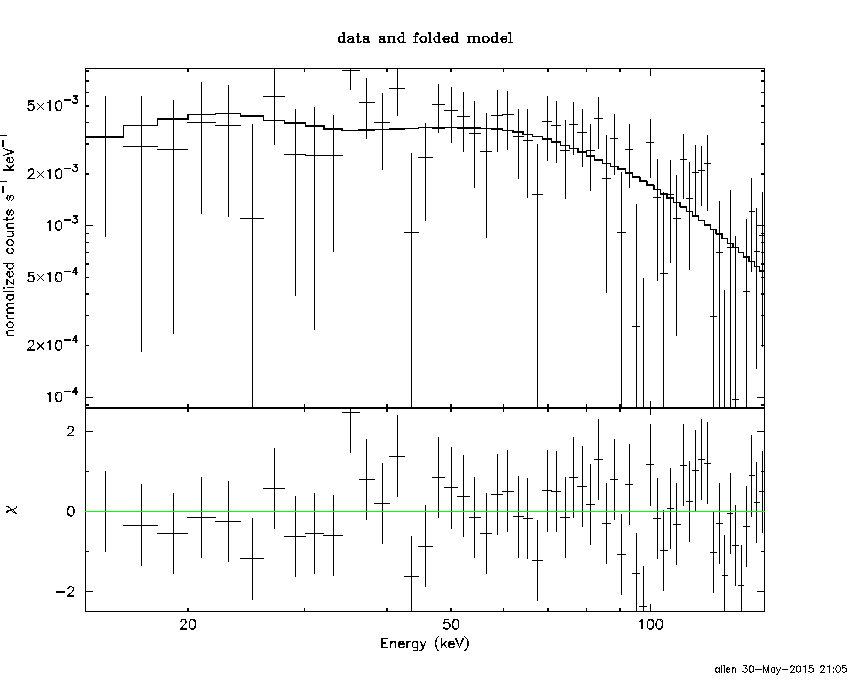
Spectra
Notes:
- 1) The fitting includes the systematic errors.
- 2) When the burst includes telescope slew time periods, the fitting uses an average response file made from multiple 5-s response files through out the slew time plus single time preiod for the non-slew times, and weighted by the total counts in the corresponding time period using addrmf. An average response file is needed becuase a spectral fit using the pre-slew DRM will introduce some errors in both a spectral shape and a normalization if the PHA file contains a lot of the slew/post-slew time interval.
- 3) For fits to more complicated models (e.g. a power-law over a cutoff power-law), the BAT team has decided to require a chi-square improvement of more than 6 for each extra dof.
Time averaged spectrum fit using the average DRM
Power-law model

Time interval is from    0.024 sec. to    0.520 sec.

Spectral model in power-law:
------------------------------------------------------------
Parameters  : value       lower 90%   higher 90%
Photon index: 0.517363     ( -0.237506   0.220921 )
Norm@50keV  : 2.19917E-02    ( -0.00312976   0.00304864 )
------------------------------------------------------------
#Fit statistic : Chi-Squared =          49.48 using 59 PHA bins.
# Reduced chi-squared =         0.8681 for     57 degrees of freedom
# Null hypothesis probability =   7.500172e-01

Photon flux (15-150 keV)    in 0.496 sec: 2.59732 ( -0.327898  0.328879 ) ph/cm2/s
Energy fluence (15-150 keV)             : 1.45268e-07 ( -1.88379e-08  1.89108e-08 ) ergs/cm2
Cutoff power-law model

Time interval is from    0.024 sec. to    0.520 sec.
Spectral model in the cutoff power-law:
------------------------------------------------------------
Parameters  : value       lower 90%   higher 90%
Photon index: -5.05515E-02     ( -1.17801   0.663163 )
Epeak [keV] : 233.627      ( -233.627 -233.627 )
Norm@50keV  : 3.65260E-02    ( -0.0166941   0.0596943 )
------------------------------------------------------------
#Fit statistic : Chi-Squared =          48.41 using 59 PHA bins.
# Reduced chi-squared =         0.8645 for     56 degrees of freedom
# Null hypothesis probability =   7.544951e-01

Photon flux (15-150 keV)    in 0.496 sec: 2.55408 ( -0.33606  0.33644 ) ph/cm2/s
Energy fluence (15-150 keV)             : 1.43363e-07 ( -1.98901e-08  1.95583e-08 ) ergs/cm2
Band function

Time interval is from    0.024 sec. to    0.520 sec.

Spectral model in the Band function:
------------------------------------------------------------
Parameters  : value       lower 90%   higher 90%
alpha       : -0.781159   ( 0.78116   0.78116 )
beta        : -0.517364    ( -0.221267   0.237448 )
Epeak [keV] : 21.5628      ( -21.5628 -21.5628 )
Norm@50keV   : 2.90296E-02    ( -0.010103   220885 )
------------------------------------------------------------
#Fit statistic : Chi-Squared =          49.48 using 59 PHA bins.
# Reduced chi-squared =         0.8997 for     55 degrees of freedom
# Null hypothesis probability =   6.846347e-01

Photon flux (15-150 keV)    in 0.496 sec:  (    ) ph/cm2/s
Energy fluence (15-150 keV)             : 0 ( 0  0 ) ergs/cm2
Single BB

Spectral model blackbody:
------------------------------------------------------------
Parameters  : value    Lower 90%  Upper 90%
kT [keV]    : 31.2616  (-5.34563  7.54506)
R^2/D10^2   : 3.74031E-02  (-0.0163963   0.0257872)
(R is the radius in km and D10 is the distance to the source in units of 10 kpc)
------------------------------------------------------------
#Fit statistic : Chi-Squared =          51.40 using 59 PHA bins.
# Reduced chi-squared =         0.9017 for     57 degrees of freedom
# Null hypothesis probability =   6.844416e-01

Energy  Fluence     90% Error
[keV]   [erg/cm2]   [erg/cm2]
15- 25  2.765e-09   7.135e-10
25- 50  1.734e-08   4.385e-09
50-150  1.176e-07   2.696e-08
15-150  1.377e-07   2.909e-08
Thermal bremsstrahlung (OTTB)

Spectral model: thermal bremsstrahlung
------------------------------------------------------------
Parameters  : value         Lower 90%    Upper 90%
kT [keV]    : 200.000       (      )
Norm        : 9.19724       (-1.34293     1.34291)
------------------------------------------------------------
#Fit statistic : Chi-Squared =         104.58 using 59 PHA bins.
# Reduced chi-squared =         1.8347 for     57 degrees of freedom
# Null hypothesis probability =   1.248066e-04

Energy  Fluence     90% Error
[keV]   [erg/cm2]   [erg/cm2]
15- 25  1.136e-08   6.508e-09
25- 50  2.185e-08   1.233e-08
50-150  4.793e-08   2.706e-08
15-150  8.114e-08   4.583e-08
Double BB

------------------------------------------------------------
Parameters  : value         Lower 90%    Upper 90%
kT1 [keV]   : 13.7788        (-12.8567      26.197)
R1^2/D10^2  : 0.153924        (      )
kT2 [keV]   : 50.2295        (-35.3361      -50.679)
R2^2/D10^2  : 8.73257E-03    (-0.00809755   0.0324476)
------------------------------------------------------------
#Fit statistic : Chi-Squared =          48.26 using 59 PHA bins.
#Fit statistic : Chi-Squared =          48.23 using 59 PHA bins.
# Reduced chi-squared =         0.8774 for     55 degrees of freedom
# Reduced chi-squared =         0.8770 for     55 degrees of freedom
# Null hypothesis probability =   7.280235e-01
# Null hypothesis probability =   7.288807e-01

Energy  Fluence     90% Error
[keV]   [erg/cm2]   [erg/cm2]
15- 25  4.345e-09   2.582e-09
25- 50  1.975e-08   1.066e-08
50-150  1.197e-07   6.510e-08
15-150  1.438e-07   7.368e-08
Peak spectrum fit
Power-law model

Time interval is from   -0.226 sec. to    0.774 sec.

Spectral model in power-law:
------------------------------------------------------------
Parameters  : value       lower 90%   higher 90%
Photon index: 0.590213     ( -0.290641   0.266254 )
Norm@50keV  : 1.16605E-02    ( -0.00195042   0.00188626 )
------------------------------------------------------------
#Fit statistic : Chi-Squared =          64.49 using 59 PHA bins.
# Reduced chi-squared =          1.131 for     57 degrees of freedom
# Null hypothesis probability =   2.313492e-01

Photon flux (15-150 keV)    in 1 sec: 1.36309 ( -0.203646  0.204769 ) ph/cm2/s
Energy fluence (15-150 keV)             : 1.49818e-07 ( -2.26149e-08  2.27324e-08 ) ergs/cm2
Cutoff power-law model

Time interval is from   -0.226 sec. to    0.774 sec.
Spectral model in the cutoff power-law:
------------------------------------------------------------
Parameters  : value       lower 90%   higher 90%
Photon index: 0.274264     ( -1.31362   0.551878 )
Epeak [keV] : 350.398      ( -350.4 -350.4 )
Norm@50keV  : 1.55008E-02    ( -0.0155007   0.0302952 )
------------------------------------------------------------
#Fit statistic : Chi-Squared =          64.22 using 59 PHA bins.
# Reduced chi-squared =          1.147 for     56 degrees of freedom
# Null hypothesis probability =   2.106920e-01

Photon flux (15-150 keV)    in 1 sec: 1.34689 ( -0.21055  0.21096 ) ph/cm2/s
Energy fluence (15-150 keV)             : 1.48477e-07 ( -2.3737e-08  2.3336e-08 ) ergs/cm2
Band function

Time interval is from   -0.226 sec. to    0.774 sec.

Spectral model in the Band function:
------------------------------------------------------------
Parameters  : value       lower 90%   higher 90%
alpha       : -0.856237   ( 0.856257   0.856257 )
beta        : -0.590224    ( -0.266257   0.290147 )
Epeak [keV] : 15.6650      ( -15.665 -15.665 )
Norm@50keV   : 1.66908E-02    ( -0.00683774   187607 )
------------------------------------------------------------
#Fit statistic : Chi-Squared =          64.49 using 59 PHA bins.
# Reduced chi-squared =          1.172 for     55 degrees of freedom
# Null hypothesis probability =   1.788200e-01

Photon flux (15-150 keV)    in 1 sec:  (    ) ph/cm2/s
Energy fluence (15-150 keV)             : 0 ( 0  0 ) ergs/cm2
Single BB

Spectral model blackbody:
------------------------------------------------------------
Parameters  : value    Lower 90%  Upper 90%
kT [keV]    : 30.6979  (-6.16286  9.36901)
R^2/D10^2   : 2.00170E-02  (-0.0102073   0.0179157)
(R is the radius in km and D10 is the distance to the source in units of 10 kpc)
------------------------------------------------------------
#Fit statistic : Chi-Squared =          67.80 using 59 PHA bins.
# Reduced chi-squared =          1.189 for     57 degrees of freedom
# Null hypothesis probability =   1.549552e-01

Energy  Fluence     90% Error
[keV]   [erg/cm2]   [erg/cm2]
15- 25  2.909e-09   9.450e-10
25- 50  1.811e-08   4.775e-09
50-150  1.195e-07   3.634e-08
15-150  1.405e-07   3.864e-08
Thermal bremsstrahlung (OTTB)

Spectral model: thermal bremsstrahlung
------------------------------------------------------------
Parameters  : value         Lower 90%    Upper 90%
kT [keV]    : 200.000       (      )
Norm        : 5.16542       (-0.853358     0.853341)
------------------------------------------------------------
#Fit statistic : Chi-Squared =          98.78 using 59 PHA bins.
# Reduced chi-squared =          1.733 for     57 degrees of freedom
# Null hypothesis probability =   5.005174e-04

Energy  Fluence     90% Error
[keV]   [erg/cm2]   [erg/cm2]
15- 25  1.286e-08   7.370e-09
25- 50  2.473e-08   1.403e-08
50-150  5.424e-08   3.079e-08
15-150  9.182e-08   5.220e-08
Double BB

Spectral model: bbodyrad<1> + bbodyrad<2>
------------------------------------------------------------
Parameters  : value         Lower 90%    Upper 90%
kT1 [keV]   : 9.84822        (-6.05423      16.4053)
R1^2/D10^2  : 0.217122        (-0.195844      4.10145)
kT2 [keV]   : 44.0598        (-40.2554      -44.0598)
R2^2/D10^2  : 6.74505E-03    (-0.0062468   0.0166215)
------------------------------------------------------------
#Fit statistic : Chi-Squared =          63.86 using 59 PHA bins.
# Reduced chi-squared =          1.161 for     55 degrees of freedom
# Null hypothesis probability =   1.933348e-01

Energy  Fluence     90% Error
[keV]   [erg/cm2]   [erg/cm2]
15- 25  5.840e-09   3.320e-09
25- 50  2.141e-08   1.114e-08
50-150  1.233e-07   6.720e-08
15-150  1.505e-07   7.655e-08
Pre-slew spectrum (Pre-slew PHA with pre-slew DRM)
Power-law model
Spectral model in power-law:
------------------------------------------------------------
Parameters  : value       lower 90%   higher 90%
Photon index: 0.517363     ( -0.237506   0.220921 )
Norm@50keV  : 2.19917E-02    ( -0.00312976   0.00304864 )
------------------------------------------------------------
#Fit statistic : Chi-Squared =          49.48 using 59 PHA bins.
# Reduced chi-squared =         0.8681 for     57 degrees of freedom
# Null hypothesis probability =   7.500172e-01

Photon flux (15-150 keV)    in 0.496 sec: 2.59732 ( -0.327898  0.328879 ) ph/cm2/s
Energy fluence (15-150 keV)             : 1.45268e-07 ( -1.88379e-08  1.89108e-08 ) ergs/cm2
Cutoff power-law model

Spectral model in the cutoff power-law:
------------------------------------------------------------
Parameters  : value       lower 90%   higher 90%
Photon index: -5.05515E-02     ( -1.17801   0.663163 )
Epeak [keV] : 233.627      ( -233.627 -233.627 )
Norm@50keV  : 3.65260E-02    ( -0.0166941   0.0596943 )
------------------------------------------------------------
#Fit statistic : Chi-Squared =          48.41 using 59 PHA bins.
# Reduced chi-squared =         0.8645 for     56 degrees of freedom
# Null hypothesis probability =   7.544951e-01

Photon flux (15-150 keV)    in 0.496 sec: 2.55408 ( -0.33606  0.33644 ) ph/cm2/s
Energy fluence (15-150 keV)             : 1.43363e-07 ( -1.98901e-08  1.95583e-08 ) ergs/cm2
Band function

Spectral model in the Band function:
------------------------------------------------------------
Parameters  : value       lower 90%   higher 90%
alpha       : -0.781159   ( 0.78116   0.78116 )
beta        : -0.517364    ( -0.221267   0.237448 )
Epeak [keV] : 21.5628      ( -21.5628 -21.5628 )
Norm@50keV   : 2.90296E-02    ( -0.010103   220885 )
------------------------------------------------------------
#Fit statistic : Chi-Squared =          49.48 using 59 PHA bins.
# Reduced chi-squared =         0.8997 for     55 degrees of freedom
# Null hypothesis probability =   6.846347e-01

Photon flux (15-150 keV)    in 0.496 sec:  (    ) ph/cm2/s
Energy fluence (15-150 keV)             : 0 ( 0  0 ) ergs/cm2
S(25-50 keV) vs. S(50-100 keV) plot

S(25-50 keV)  = 1.89e-08
S(50-100 keV) = 5.29e-08
T90 vs. Hardness ratio plot

T90                                   = 0.463999927043915 sec.
Hardness ratio (energy fluence ratio) = 2.79894
Color vs. Color plot

Count Ratio  (25-50 keV) / (15-25 keV) = 2.59214
Count Ratio (50-100 keV) / (15-25 keV) = 3.73822
Mask shadow pattern

IMX = 2.015853254628830E-01, IMY = -4.074000223846641E-01
TIME vs. PHA plot around the trigger time

Blue+Cyan dotted lines: Time interval of the scaled map
From 0.000000 to 0.512000
TIME vs. DetID plot around the trigger time

Blue+Cyan dotted lines: Time interval of the scaled map
From 0.000000 to 0.512000
100 us light curve (15-350 keV)

Blue+Cyan dotted lines: Time interval of the scaled map
From 0.000000 to 0.512000
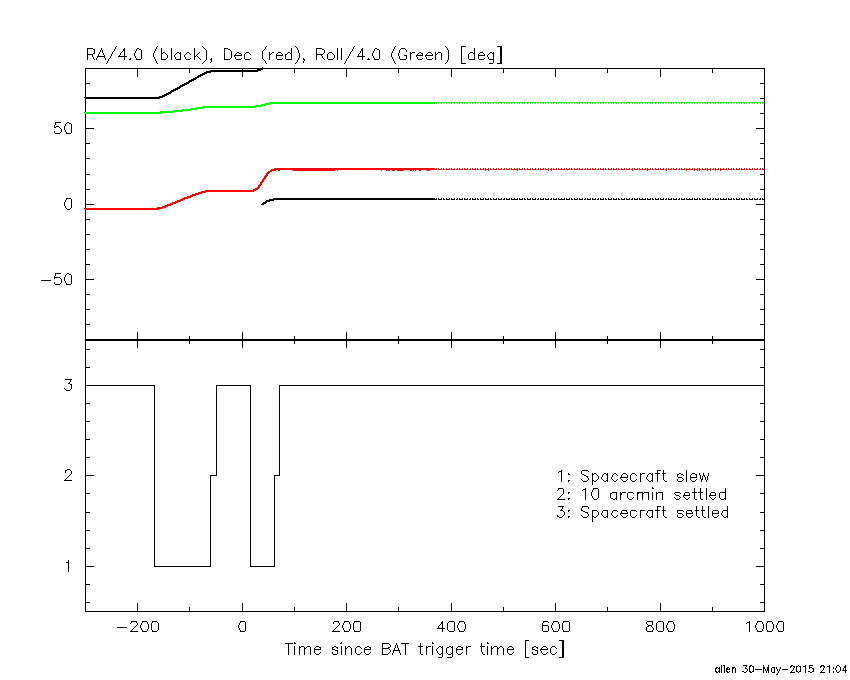
Spacecraft aspect plot
Bright source in the pre-burst/pre-slew/post-slew images
Pre-burst image of 15-350 keV band
Time interval of the image:
-60.203410 0.024000

# RAcent  DECcent POSerr Theta    Phi  PeakCts   SNR AngSep     Name
#  [deg]    [deg]    ['] [deg]  [deg]                   [']
308.0832  40.9692   67.9  50.4  -31.1   0.0385   0.2    1.6	Cyg X-3
326.0190  38.4246    6.1  37.7  -22.4  -0.2204  -1.9    9.5	Cyg X-2
Pre-slew background subtracted image of 15-350 keV band
Time interval of the image:
0.024000 0.520000

# RAcent  DECcent POSerr Theta    Phi  PeakCts   SNR AngSep     Name
#  [deg]    [deg]    ['] [deg]  [deg]                   [']
308.2307  41.0342   15.3  50.3  -31.0   0.0180   0.8    7.3	Cyg X-3
325.9933  38.4144   10.2  37.7  -22.4  -0.0146  -1.1   10.1	Cyg X-2
 24.2217 -11.7821    2.1  38.1  133.8   0.1182   5.5 ------	UNKNOWN
 12.7060  23.0100    0.9  24.4   63.7   0.1741  13.4 ------	UNKNOWN
 12.9139 -27.4070    3.0  41.5  163.0   0.0663   3.9 ------	UNKNOWN
  7.3075 -26.3830    2.5  38.2  169.1   0.0659   4.6 ------	UNKNOWN
308.6775  12.3679    2.2  42.7  -69.6   0.1709   5.3 ------	UNKNOWN
Post-slew image of 15-350 keV band
Time interval of the image:
60.996600 962.543300

# RAcent  DECcent POSerr Theta    Phi  PeakCts   SNR AngSep     Name
#  [deg]    [deg]    ['] [deg]  [deg]                   [']
325.9830  38.3698   22.2  42.5  -56.1   0.9678   0.5    9.3	Cyg X-2
 50.0780  30.0149    3.1  34.0   71.6   3.9270   3.7 ------	UNKNOWN
 42.8490  -1.0326    3.0  38.0  126.8   4.9513   3.9 ------	UNKNOWN
 29.1050   5.0566    2.8  24.0  137.7   2.3302   4.2 ------	UNKNOWN
 20.9754 -14.6758    2.5  38.6  168.6   3.5795   4.6 ------	UNKNOWN
  6.0076  57.4971    3.1  34.8   -4.7   2.3698   3.7 ------	UNKNOWN
359.8194  16.6602    2.6  13.7 -113.9   2.1108   4.4 ------	UNKNOWN
359.8102 -34.7975    2.4  59.1 -166.1  17.6193   4.9 ------	UNKNOWN
313.1762  57.5854    3.7  54.5  -33.0   8.9162   3.2 ------	UNKNOWN
Plot creation:
Sat May 30 21:06:17 EDT 2015