Click here for the BAT GCN circular template
Image
Pre-slew 15.0-350.0 keV image (Event data)
#   RAcent    DECcent   POSerr    Theta     Phi              Peak Cts       SNR   Name
  154.8454   -20.6389   0.0075    26.0287   167.3440         2.2557843     25.783 TRIG_00508319

Foreground time interval of the image:
 -8.704  41.397 (delta_t =  50.101 [sec])
Background time interval of the image:
-239.704  -8.704 (delta_t = 231.000 [sec])
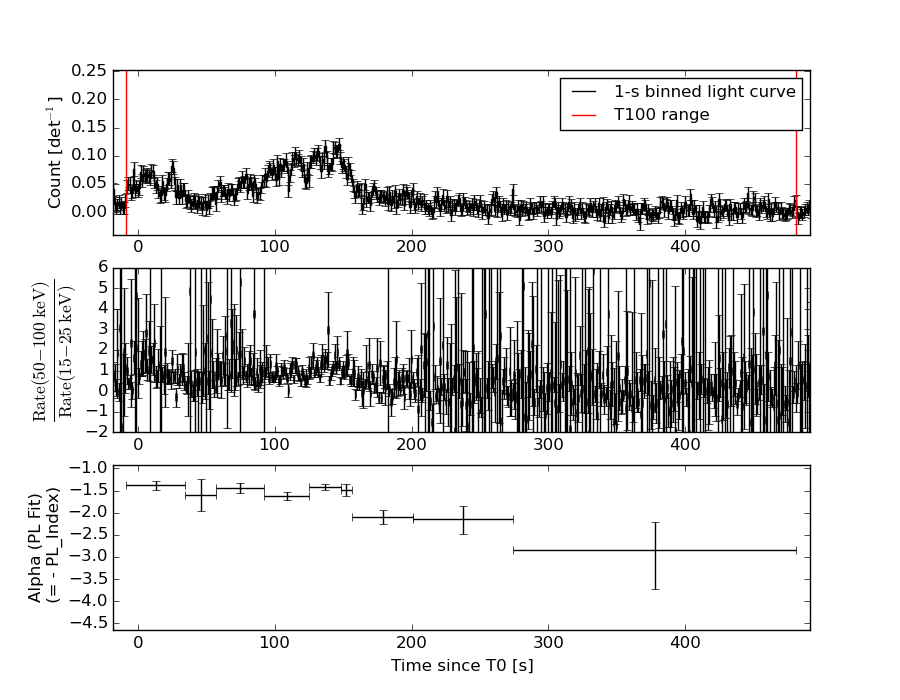
Lightcurves
Notes:
- 1) The mask-weighted light curves are using the flight position.
- 2) Multiple plots of different time binning/intervals are shown to cover all scenarios of short/long GRBs, rate/image triggers, and real/false positives.
- 3) For all the mask-weighted lightcurves, the y-axis units are counts/sec/det where a det is 0.4 x 0.4 = 0.16 sq cm.
- 4) The verticle lines correspond to following: green dotted lines are T50 interval, black dotted lines are T90 interval, blue solid line(s) is a spacecraft slew start time, and orange solid line(s) is a spacecraft slew end time.
- 5) Time of each bin is in the middle of the bin.
1 s binning
From T0-310 s to T0+310 s

From T100_start - 20 s to T100_end + 30 s
Full time interval

64 ms binning
Full time interval

From T100_start to T100_end

From T0-5 sec to T0+5 sec

16 ms binning
From T100_start-5 s to T100_start+5 s

Blue+Cyan dotted lines: Time interval of the scaled map
From 0.000000 to 4.096000
8 ms binning
From T100_start-3 s to T100_start+3 s
Blue+Cyan dotted lines: Time interval of the scaled map
From 0.000000 to 4.096000
2 ms binning
From T100_start-1 s to T100_start+1 s

Blue+Cyan dotted lines: Time interval of the scaled map
From 0.000000 to 4.096000
SN=5 or 10 sec. binning (whichever binning is satisfied first)

SN=5 or 10 sec. binning (T < 200 sec)
Quad-rate summed light curves (from T0-300s to T0+1000s)

The mask-weighted light curves based on cleaned DPHs

Spectral Evolution
Spectra
Notes:
- 1) The fitting includes the systematic errors.
- 2) When the burst includes telescope slew time periods, the fitting uses an average response file made from multiple 5-s response files through out the slew time plus single time preiod for the non-slew times, and weighted by the total counts in the corresponding time period using addrmf. An average response file is needed becuase a spectral fit using the pre-slew DRM will introduce some errors in both a spectral shape and a normalization if the PHA file contains a lot of the slew/post-slew time interval.
- 3) For fits to more complicated models (e.g. a power-law over a cutoff power-law), the BAT team has decided to require a chi-square improvement of more than 6 for each extra dof.
Time averaged spectrum fit using the average DRM
Power-law model

Time interval is from   -8.704 sec. to  481.296 sec.

Spectral model in power-law:
------------------------------------------------------------
Parameters  : value       lower 90%   higher 90%
Photon index: 1.65999     ( -0.0667031   0.0670717 )
Norm@50keV  : 1.56024E-03    ( -5.35195e-05   5.33472e-05 )
------------------------------------------------------------
#Fit statistic : Chi-Squared =          65.25 using 59 PHA bins.
# Reduced chi-squared =          1.145 for     57 degrees of freedom
# Null hypothesis probability =   2.118115e-01

Photon flux (15-150 keV)    in 490 sec: 0.204405 ( -0.00739329  0.00742915 ) ph/cm2/s
Energy fluence (15-150 keV)             : 7.10333e-06 ( -2.5715e-07  2.58446e-07 ) ergs/cm2
Cutoff power-law model

Time interval is from   -8.704 sec. to  481.296 sec.
Spectral model in the cutoff power-law:
------------------------------------------------------------
Parameters  : value       lower 90%   higher 90%
Photon index: 1.65831     ( -0.0671854   0.0674048 )
Epeak [keV] : 1.00000E+04      ( -10000 -10000 )
Norm@50keV  : 1.56339E-03    ( -5.3695e-05   5.20275e-05 )
------------------------------------------------------------
#Fit statistic : Chi-Squared =          65.27 using 59 PHA bins.
# Reduced chi-squared =          1.165 for     56 degrees of freedom
# Null hypothesis probability =   1.857066e-01

Photon flux (15-150 keV)    in 490 sec: 0.204518 ( -0.007566  0.007206 ) ph/cm2/s
Energy fluence (15-150 keV)             : 7.10157e-06 ( -2.43628e-07  2.53281e-07 ) ergs/cm2
Band function

Time interval is from   -8.704 sec. to  481.296 sec.

Spectral model in the Band function:
------------------------------------------------------------
Parameters  : value       lower 90%   higher 90%
alpha       : -1.22008   ( 1.20934   1.20934 )
beta        : -1.66454    ( -0.0820077   0.070293 )
Epeak [keV] : 42.0759      ( -42.8959 -42.8959 )
Norm@50keV   : 3.37468E-03    ( -0.00191834   0 )
------------------------------------------------------------
#Fit statistic : Chi-Squared =          65.14 using 59 PHA bins.
# Reduced chi-squared =          1.184 for     55 degrees of freedom
# Null hypothesis probability =   1.646143e-01

Photon flux (15-150 keV)    in 490 sec:  (    ) ph/cm2/s
Energy fluence (15-150 keV)             : 0 ( 0  0 ) ergs/cm2
Single BB

Spectral model blackbody:
------------------------------------------------------------
Parameters  : value    Lower 90%  Upper 90%
kT [keV]    : 14.7444  (  )
R^2/D10^2   : 2.21958E-02  (   )
(R is the radius in km and D10 is the distance to the source in units of 10 kpc)
------------------------------------------------------------
#Fit statistic : Chi-Squared =         321.09 using 59 PHA bins.
# Reduced chi-squared =         5.6332 for     57 degrees of freedom
# Null hypothesis probability =   1.784662e-38

Energy  Fluence     90% Error
[keV]   [erg/cm2]   [erg/cm2]
15- 25  4.963e-07   3.619e-08
25- 50  1.941e-06   8.355e-08
50-150  2.849e-06   2.053e-07
15-150  5.287e-06   2.033e-07
Thermal bremsstrahlung (OTTB)

Spectral model: thermal bremsstrahlung
------------------------------------------------------------
Parameters  : value         Lower 90%    Upper 90%
kT [keV]    : 167.888       (-28.6167      -167.038)
Norm        : 0.818669       (-0.0329854     0.0361313)
------------------------------------------------------------
#Fit statistic : Chi-Squared =          75.07 using 59 PHA bins.
# Reduced chi-squared =          1.317 for     57 degrees of freedom
# Null hypothesis probability =   5.457816e-02

Energy  Fluence     90% Error
[keV]   [erg/cm2]   [erg/cm2]
15- 25  1.019e-06   5.880e-08
25- 50  1.919e-06   1.517e-07
50-150  3.961e-06   1.090e-06
15-150  6.900e-06   1.187e-06
Double BB

Spectral model: bbodyrad<1> + bbodyrad<2>
------------------------------------------------------------
Parameters  : value         Lower 90%    Upper 90%
kT1 [keV]   : 6.24162        (-0.583309      0.632388)
R1^2/D10^2  : 0.362783        (-0.112391      0.173757)
kT2 [keV]   : 26.0031        (-2.44514      3.09726)
R2^2/D10^2  : 2.46889E-03    (-0.000798967   0.00104561)
------------------------------------------------------------
#Fit statistic : Chi-Squared =          60.07 using 59 PHA bins.
# Reduced chi-squared =          1.092 for     55 degrees of freedom
# Null hypothesis probability =   2.971955e-01

Energy  Fluence     90% Error
[keV]   [erg/cm2]   [erg/cm2]
15- 25  1.111e-06   1.200e-07
25- 50  1.860e-06   1.372e-07
50-150  4.122e-06   3.952e-07
15-150  7.092e-06   5.708e-07
Peak spectrum fit
Power-law model

Time interval is from  146.296 sec. to  147.296 sec.

Spectral model in power-law:
------------------------------------------------------------
Parameters  : value       lower 90%   higher 90%
Photon index: 1.32759     ( -0.267504   0.265115 )
Norm@50keV  : 7.46162E-03    ( -0.0011113   0.00110668 )
------------------------------------------------------------
#Fit statistic : Chi-Squared =          52.76 using 59 PHA bins.
# Reduced chi-squared =         0.9256 for     57 degrees of freedom
# Null hypothesis probability =   6.348161e-01

Photon flux (15-150 keV)    in 1 sec: 0.894874 ( -0.133944  0.134181 ) ph/cm2/s
Energy fluence (15-150 keV)             : 7.32501e-08 ( -1.22876e-08  1.24351e-08 ) ergs/cm2
Cutoff power-law model

Time interval is from  146.296 sec. to  147.296 sec.
Spectral model in the cutoff power-law:
------------------------------------------------------------
Parameters  : value       lower 90%   higher 90%
Photon index: 1.32721     ( -0.608047   0.263534 )
Epeak [keV] : 9999.33      ( -9999.36 -9999.36 )
Norm@50keV  : 7.48891E-03    ( -0.00111579   0.0068813 )
------------------------------------------------------------
#Fit statistic : Chi-Squared =          52.77 using 59 PHA bins.
# Reduced chi-squared =         0.9423 for     56 degrees of freedom
# Null hypothesis probability =   5.979235e-01

Photon flux (15-150 keV)    in 1 sec: 0.896356 ( -0.1358  0.132614 ) ph/cm2/s
Energy fluence (15-150 keV)             : 7.33974e-08 ( -1.23967e-08  1.20447e-08 ) ergs/cm2
Band function

Time interval is from  146.296 sec. to  147.296 sec.

Spectral model in the Band function:
------------------------------------------------------------
Parameters  : value       lower 90%   higher 90%
alpha       : 4.88244   ( -4.88244   -4.88244 )
beta        : -1.37172    ( -0.347888   0.287957 )
Epeak [keV] : 22.3333      ( -22.3333 9.29069 )
Norm@50keV   : 1100.99    ( -161.654   3.2859e+06 )
------------------------------------------------------------
#Fit statistic : Chi-Squared =          52.63 using 59 PHA bins.
# Reduced chi-squared =         0.9570 for     55 degrees of freedom
# Null hypothesis probability =   5.655797e-01

Photon flux (15-150 keV)    in 1 sec:  (    ) ph/cm2/s
Energy fluence (15-150 keV)             : 0 ( 0  0 ) ergs/cm2
Single BB

Spectral model blackbody:
------------------------------------------------------------
Parameters  : value    Lower 90%  Upper 90%
kT [keV]    : 18.3623  (-4.47615  5.92036)
R^2/D10^2   : 5.06767E-02  (-0.0498945   0.078102)
(R is the radius in km and D10 is the distance to the source in units of 10 kpc)
------------------------------------------------------------
#Fit statistic : Chi-Squared =          73.11 using 59 PHA bins.
# Reduced chi-squared =          1.283 for     57 degrees of freedom
# Null hypothesis probability =   7.387410e-02

Energy  Fluence     90% Error
[keV]   [erg/cm2]   [erg/cm2]
15- 25  3.399e-09   1.076e-09
25- 50  1.595e-08   4.404e-09
50-150  3.924e-08   1.429e-08
15-150  5.859e-08   1.511e-08
Thermal bremsstrahlung (OTTB)

Spectral model: thermal bremsstrahlung
------------------------------------------------------------
Parameters  : value         Lower 90%    Upper 90%
kT [keV]    : 200.000       (      )
Norm        : 3.67426       (-0.546399     0.546368)
------------------------------------------------------------
#Fit statistic : Chi-Squared =          55.72 using 59 PHA bins.
# Reduced chi-squared =         0.9775 for     57 degrees of freedom
# Null hypothesis probability =   5.233410e-01

Energy  Fluence     90% Error
[keV]   [erg/cm2]   [erg/cm2]
15- 25  9.150e-09   5.205e-09
25- 50  1.760e-08   9.900e-09
50-150  3.860e-08   2.192e-08
15-150  6.535e-08   3.669e-08
Double BB

Spectral model: bbodyrad<1> + bbodyrad<2>
------------------------------------------------------------
Parameters  : value         Lower 90%    Upper 90%
kT1 [keV]   : 6.59734        (-1.69141      2.21798)
R1^2/D10^2  : 1.25088        (-0.81382      2.57678)
kT2 [keV]   : 36.8521        (-11.6632      36.4294)
R2^2/D10^2  : 4.80033E-03    (-0.00392069   0.0106149)
------------------------------------------------------------
#Fit statistic : Chi-Squared =          49.50 using 59 PHA bins.
# Reduced chi-squared =         0.9000 for     55 degrees of freedom
# Null hypothesis probability =   6.839152e-01

Energy  Fluence     90% Error
[keV]   [erg/cm2]   [erg/cm2]
15- 25  9.081e-09   4.953e-09
25- 50  1.590e-08   8.151e-09
50-150  5.233e-08   2.928e-08
15-150  7.731e-08   3.807e-08
Pre-slew spectrum (Pre-slew PHA with pre-slew DRM)
Power-law model

Spectral model in power-law:
------------------------------------------------------------
Parameters  : value       lower 90%   higher 90%
Photon index: 1.44274     ( -0.106169   0.106292 )
Norm@50keV  : 3.09251E-03    ( -0.000179424   0.000179084 )
------------------------------------------------------------
#Fit statistic : Chi-Squared =          45.70 using 59 PHA bins.
# Reduced chi-squared =         0.8017 for     57 degrees of freedom
# Null hypothesis probability =   8.587006e-01

Photon flux (15-150 keV)    in 50.1 sec: 0.380427 ( -0.0228995  0.0229725 ) ph/cm2/s
Energy fluence (15-150 keV)             : 1.48462e-06 ( -9.43052e-08  9.47642e-08 ) ergs/cm2
Cutoff power-law model

Spectral model in the cutoff power-law:
------------------------------------------------------------
Parameters  : value       lower 90%   higher 90%
Photon index: 1.34418     ( -0.414419   0.194917 )
Epeak [keV] : 326.748      ( -353.247 -353.247 )
Norm@50keV  : 3.44531E-03    ( -0.000516148   0.00189008 )
------------------------------------------------------------
#Fit statistic : Chi-Squared =          45.58 using 59 PHA bins.
# Reduced chi-squared =         0.8140 for     56 degrees of freedom
# Null hypothesis probability =   8.386779e-01

Photon flux (15-150 keV)    in 50.1 sec: 0.378255 ( -0.024295  0.024183 ) ph/cm2/s
Energy fluence (15-150 keV)             : 1.47509e-06 ( -5.17182e-08  1.01142e-07 ) ergs/cm2
Band function

Spectral model in the Band function:
------------------------------------------------------------
Parameters  : value       lower 90%   higher 90%
alpha       : -7.69585   ( 7.69585   7.69585 )
beta        : -1.44273    ( -0.106299   0.106162 )
Epeak [keV] : 77.8801      ( -77.8801 -77.8801 )
Norm@50keV   : 0.420316    ( -0.0243864   0.0243398 )
------------------------------------------------------------
#Fit statistic : Chi-Squared =          45.70 using 59 PHA bins.
# Reduced chi-squared =         0.8308 for     55 degrees of freedom
# Null hypothesis probability =   8.100652e-01

Photon flux (15-150 keV)    in 50.1 sec:  (    ) ph/cm2/s
Energy fluence (15-150 keV)             : 0 ( 0  0 ) ergs/cm2
S(25-50 keV) vs. S(50-100 keV) plot

S(25-50 keV)  = 1.89e-06
S(50-100 keV) = 2.39e-06
T90 vs. Hardness ratio plot

T90                                   = 290 sec.
Hardness ratio (energy fluence ratio) = 1.26455
Color vs. Color plot

Count Ratio  (25-50 keV) / (15-25 keV) = 1.16898
Count Ratio (50-100 keV) / (15-25 keV) = 0.829781
Mask shadow pattern

IMX = -4.764869517058909E-01, IMY = -1.069963987899719E-01
TIME vs. PHA plot around the trigger time

Blue+Cyan dotted lines: Time interval of the scaled map
From 0.000000 to 4.096000
TIME vs. DetID plot around the trigger time

Blue+Cyan dotted lines: Time interval of the scaled map
From 0.000000 to 4.096000
100 us light curve (15-350 keV)
Blue+Cyan dotted lines: Time interval of the scaled map
From 0.000000 to 4.096000
Spacecraft aspect plot

Bright source in the pre-burst/pre-slew/post-slew images
Pre-burst image of 15-350 keV band
Time interval of the image:
-239.704000 -8.704000

# RAcent  DECcent POSerr Theta    Phi  PeakCts   SNR AngSep     Name
#  [deg]    [deg]    ['] [deg]  [deg]                   [']
135.5147 -40.5461    1.2  15.2   94.0   1.8607   9.9    0.8	Vela X-1
170.3180 -60.6414    1.1  16.7  -40.2   1.8885  10.2    1.1	Cen X-3
186.7650 -62.8227    3.9  24.1  -49.2   0.6124   2.9    4.3	GX 301-2
120.8019 -51.2362    2.1  22.5   52.9   1.2469   5.6 ------	UNKNOWN
153.3618  -5.0805    3.0  41.6  165.1   1.3254   3.9 ------	UNKNOWN
183.7814   3.6375    2.4  56.4 -157.3   4.1875   4.9 ------	UNKNOWN
190.1830  -0.3011    2.9  55.7 -148.3   4.0746   4.0 ------	UNKNOWN
202.3893 -24.4301    3.5  43.8 -116.4   2.6116   3.3 ------	UNKNOWN
208.3293 -35.2779    2.7  41.2  -99.0   4.5522   4.2 ------	UNKNOWN
Pre-slew background subtracted image of 15-350 keV band
Time interval of the image:
-8.704000 41.396600

# RAcent  DECcent POSerr Theta    Phi  PeakCts   SNR AngSep     Name
#  [deg]    [deg]    ['] [deg]  [deg]                   [']
135.5505 -40.6489   10.3  15.1   93.7  -0.1009  -1.1    5.7	Vela X-1
170.6206 -60.4727    0.0  16.6  -40.9   0.1268   1.5   12.7	Cen X-3
186.3478 -62.8017    7.1  23.9  -49.0   0.1457   1.6    8.7	GX 301-2
154.8454 -20.6389    0.5  26.0  167.3   2.2558  25.8 ------	UNKNOWN
194.4863 -31.3756    2.4  34.0 -115.3   0.6316   4.8 ------	UNKNOWN
Post-slew image of 15-350 keV band
Time interval of the image:
88.596590 934.496620

# RAcent  DECcent POSerr Theta    Phi  PeakCts   SNR AngSep     Name
#  [deg]    [deg]    ['] [deg]  [deg]                   [']
135.5337 -40.5293    0.7  25.8   18.1   8.0611  15.8    1.5	Vela X-1
170.3211 -60.6356    1.2  41.4  -28.6   7.6981   9.8    0.8	Cen X-3
186.7308 -62.7840    7.9  47.4  -36.3   1.6016   1.5    2.2	GX 301-2
119.4645 -29.4396    2.8  33.1   50.3   3.3883   4.2 ------	UNKNOWN
157.0137  22.1038    2.9  42.8  165.8   3.8400   4.0 ------	UNKNOWN
147.9150 -25.3622    3.1   7.9   35.1   1.5736   3.8 ------	UNKNOWN
154.8560 -20.6384    0.6   0.0 -179.5   8.8341  18.4 ------	UNKNOWN
159.7120  -7.2032    3.3  14.2 -177.2   1.5386   3.5 ------	UNKNOWN
156.2768 -54.5019    2.5  33.9  -18.7   2.5163   4.7 ------	UNKNOWN
185.7250  30.4501    3.0  59.1 -166.1  13.6245   3.8 ------	UNKNOWN
165.3534 -78.8079    3.9  58.4  -19.6   8.2805   3.0 ------	UNKNOWN
Plot creation:
Sat May 30 21:02:54 EDT 2015