Click here for the BAT GCN circular template
Image
Pre-slew 15.0-350.0 keV image (Event data)

#   RAcent    DECcent   POSerr    Theta     Phi              Peak Cts       SNR   Name
  307.4205   -52.7192   0.0184    33.8014   -40.0427         0.4249547     10.417 TRIG_00508712

Foreground time interval of the image:
 -6.292   2.692 (delta_t =   8.984 [sec])
Background time interval of the image:
-400.551 -382.303 (delta_t =  18.248 [sec])
-239.952  -6.292 (delta_t = 233.660 [sec])
Lightcurves
Notes:
- 1) The mask-weighted light curves are using the flight position.
- 2) Multiple plots of different time binning/intervals are shown to cover all scenarios of short/long GRBs, rate/image triggers, and real/false positives.
- 3) For all the mask-weighted lightcurves, the y-axis units are counts/sec/det where a det is 0.4 x 0.4 = 0.16 sq cm.
- 4) The verticle lines correspond to following: green dotted lines are T50 interval, black dotted lines are T90 interval, blue solid line(s) is a spacecraft slew start time, and orange solid line(s) is a spacecraft slew end time.
- 5) Time of each bin is in the middle of the bin.
1 s binning
From T0-310 s to T0+310 s

From T100_start - 20 s to T100_end + 30 s

Full time interval

64 ms binning
Full time interval

From T100_start to T100_end

From T0-5 sec to T0+5 sec

16 ms binning
From T100_start-5 s to T100_start+5 s

Blue+Cyan dotted lines: Time interval of the scaled map
From 0.000000 to 2.048000
8 ms binning
From T100_start-3 s to T100_start+3 s

Blue+Cyan dotted lines: Time interval of the scaled map
From 0.000000 to 2.048000
2 ms binning
From T100_start-1 s to T100_start+1 s

Blue+Cyan dotted lines: Time interval of the scaled map
From 0.000000 to 2.048000
SN=5 or 10 sec. binning (whichever binning is satisfied first)

SN=5 or 10 sec. binning (T < 200 sec)

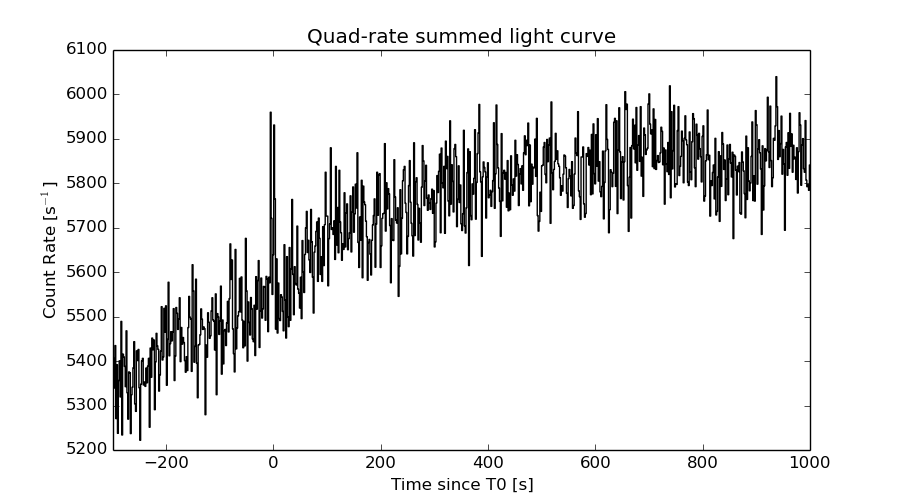
Quad-rate summed light curves (from T0-300s to T0+1000s)
The mask-weighted light curves based on cleaned DPHs

Spectral Evolution
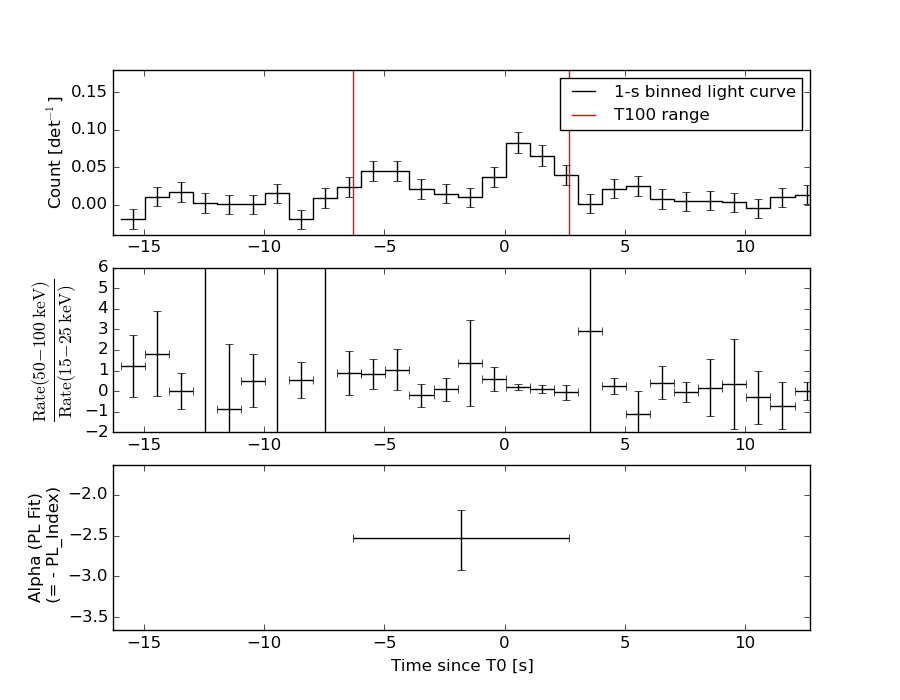
Spectra
Notes:
- 1) The fitting includes the systematic errors.
- 2) When the burst includes telescope slew time periods, the fitting uses an average response file made from multiple 5-s response files through out the slew time plus single time preiod for the non-slew times, and weighted by the total counts in the corresponding time period using addrmf. An average response file is needed becuase a spectral fit using the pre-slew DRM will introduce some errors in both a spectral shape and a normalization if the PHA file contains a lot of the slew/post-slew time interval.
- 3) For fits to more complicated models (e.g. a power-law over a cutoff power-law), the BAT team has decided to require a chi-square improvement of more than 6 for each extra dof.
Time averaged spectrum fit using the average DRM
Power-law model

Time interval is from   -6.292 sec. to    2.692 sec.

Spectral model in power-law:
------------------------------------------------------------
Parameters  : value       lower 90%   higher 90%
Photon index: 2.52721     ( -0.346219   0.399758 )
Norm@50keV  : 2.01380E-03    ( -0.000579231   0.000577113 )
------------------------------------------------------------
#Fit statistic : Chi-Squared =          37.71 using 59 PHA bins.
# Reduced chi-squared =         0.6616 for     57 degrees of freedom
# Null hypothesis probability =   9.771899e-01

Photon flux (15-150 keV)    in 8.984 sec: 0.402287 ( -0.0644778  0.0644975 ) ph/cm2/s
Energy fluence (15-150 keV)             : 1.82268e-07 ( -3.72444e-08  3.94931e-08 ) ergs/cm2
Cutoff power-law model

Time interval is from   -6.292 sec. to    2.692 sec.
Spectral model in the cutoff power-law:
------------------------------------------------------------
Parameters  : value       lower 90%   higher 90%
Photon index: 1.98046     ( -2.07696   0.016119 )
Epeak [keV] : 1.22064      ( -0.578687 26.1798 )
Norm@50keV  : 4.56870E-03    (     )
------------------------------------------------------------
#Fit statistic : Chi-Squared =          37.79 using 59 PHA bins.
# Reduced chi-squared =         0.6749 for     56 degrees of freedom
# Null hypothesis probability =   9.704716e-01

Photon flux (15-150 keV)    in 8.984 sec: 0.399900 ( -0.065884  0.065965 ) ph/cm2/s
Energy fluence (15-150 keV)             : 1.77667e-07 ( -4.59586e-08  4.3311e-08 ) ergs/cm2
Band function

Time interval is from   -6.292 sec. to    2.692 sec.

Spectral model in the Band function:
------------------------------------------------------------
Parameters  : value       lower 90%   higher 90%
alpha       : -4.53593   ( 4.53593   4.53593 )
beta        : -2.52722    ( -0.399692   0.346138 )
Epeak [keV] : 4.81946      ( -4.81946 -4.81946 )
Norm@50keV   : 0.273702    ( -0.0787239   0.0784395 )
------------------------------------------------------------
#Fit statistic : Chi-Squared =          37.71 using 59 PHA bins.
# Reduced chi-squared =         0.6857 for     55 degrees of freedom
# Null hypothesis probability =   9.637892e-01

Photon flux (15-150 keV)    in 8.984 sec: 0.398760 ( 6.60124  -0.063611 ) ph/cm2/s
Energy fluence (15-150 keV)             : 0 ( 0  0 ) ergs/cm2
Single BB

Spectral model blackbody:
------------------------------------------------------------
Parameters  : value    Lower 90%  Upper 90%
kT [keV]    : 6.30831  (-1.04244  1.24972)
R^2/D10^2   : 1.16219  (-0.625169   1.38765)
(R is the radius in km and D10 is the distance to the source in units of 10 kpc)
------------------------------------------------------------
#Fit statistic : Chi-Squared =          42.53 using 59 PHA bins.
# Reduced chi-squared =         0.7462 for     57 degrees of freedom
# Null hypothesis probability =   9.231004e-01

Energy  Fluence     90% Error
[keV]   [erg/cm2]   [erg/cm2]
15- 25  5.912e-08   1.607e-08
25- 50  6.563e-08   2.126e-08
50-150  7.349e-09   4.691e-09
15-150  1.321e-07   3.846e-08
Thermal bremsstrahlung (OTTB)

Spectral model: thermal bremsstrahlung
------------------------------------------------------------
Parameters  : value         Lower 90%    Upper 90%
kT [keV]    : 28.3357       (-9.71008      17.1303)
Norm        : 3.37397       (-1.09599     1.8561)
------------------------------------------------------------
#Fit statistic : Chi-Squared =          38.47 using 59 PHA bins.
# Reduced chi-squared =         0.6749 for     57 degrees of freedom
# Null hypothesis probability =   9.716430e-01

Energy  Fluence     90% Error
[keV]   [erg/cm2]   [erg/cm2]
15- 25  5.985e-08   1.498e-08
25- 50  6.621e-08   1.786e-08
50-150  3.360e-08   1.853e-08
15-150  1.597e-07   4.115e-08
Double BB

Spectral model: bbodyrad<1> + bbodyrad<2>
------------------------------------------------------------
Parameters  : value         Lower 90%    Upper 90%
kT1 [keV]   : 5.32291        (-1.33818      1.31579)
R1^2/D10^2  : 2.14420        (-1.28612      1.54061)
kT2 [keV]   : 24.0893        (-10.5141      90.6041)
R2^2/D10^2  : 2.82358E-03    (-0.00280557   0.0558649)
------------------------------------------------------------
#Fit statistic : Chi-Squared =          36.13 using 59 PHA bins.
# Reduced chi-squared =         0.6570 for     55 degrees of freedom
# Null hypothesis probability =   9.768864e-01

Energy  Fluence     90% Error
[keV]   [erg/cm2]   [erg/cm2]
15- 25  6.240e-08   3.463e-08
25- 50  5.993e-08   2.869e-08
50-150  6.518e-08   4.459e-08
15-150  1.875e-07   9.588e-08
Peak spectrum fit
Power-law model

Time interval is from    0.412 sec. to    1.412 sec.

Spectral model in power-law:
------------------------------------------------------------
Parameters  : value       lower 90%   higher 90%
Photon index: 2.32264     ( -0.432614   0.523375 )
Norm@50keV  : 5.21793E-03    ( -0.00180037   0.00171411 )
------------------------------------------------------------
#Fit statistic : Chi-Squared =          56.36 using 59 PHA bins.
# Reduced chi-squared =         0.9888 for     57 degrees of freedom
# Null hypothesis probability =   4.990420e-01

Photon flux (15-150 keV)    in 1 sec: 0.923502 ( -0.20087  0.200871 ) ph/cm2/s
Energy fluence (15-150 keV)             : 5.00773e-08 ( -1.33379e-08  1.40913e-08 ) ergs/cm2
Cutoff power-law model

Time interval is from    0.412 sec. to    1.412 sec.
Spectral model in the cutoff power-law:
------------------------------------------------------------
Parameters  : value       lower 90%   higher 90%
Photon index: 1.87227     (     )
Epeak [keV] : 11.5886      (   )
Norm@50keV  : 9.60368E-03    (     )
------------------------------------------------------------
#Fit statistic : Chi-Squared =          56.24 using 59 PHA bins.
# Reduced chi-squared =          1.004 for     56 degrees of freedom
# Null hypothesis probability =   4.656946e-01

Photon flux (15-150 keV)    in 1 sec: 0.914443 ( -0.103257  0.204627 ) ph/cm2/s
Energy fluence (15-150 keV)             : 4.87281e-08 ( -1.39603e-08  1.50527e-08 ) ergs/cm2
Band function

Time interval is from    0.412 sec. to    1.412 sec.

Spectral model in the Band function:
------------------------------------------------------------
Parameters  : value       lower 90%   higher 90%
alpha       : -1.98441   ( -0.0791934   1.98442 )
beta        : -9.37167    ( 9.37167   19.3717 )
Epeak [keV] : 1.86670      ( -1.22127 -1.8667 )
Norm@50keV   : 8.27284E-03    ( -0.00179722   0.0756998 )
------------------------------------------------------------
#Fit statistic : Chi-Squared =          56.23 using 59 PHA bins.
# Reduced chi-squared =          1.022 for     55 degrees of freedom
# Null hypothesis probability =   4.286782e-01

Photon flux (15-150 keV)    in 1 sec: 0.918064 (    ) ph/cm2/s
Energy fluence (15-150 keV)             : 4.91783e-08 ( 0  0 ) ergs/cm2
Single BB

Spectral model blackbody:
------------------------------------------------------------
Parameters  : value    Lower 90%  Upper 90%
kT [keV]    : 7.86489  (-1.88344  2.63965)
R^2/D10^2   : 1.05730  (-0.723894   2.18332)
(R is the radius in km and D10 is the distance to the source in units of 10 kpc)
------------------------------------------------------------
#Fit statistic : Chi-Squared =          61.44 using 59 PHA bins.
# Reduced chi-squared =          1.078 for     57 degrees of freedom
# Null hypothesis probability =   3.199443e-01

Energy  Fluence     90% Error
[keV]   [erg/cm2]   [erg/cm2]
15- 25  1.167e-08   5.441e-09
25- 50  1.983e-08   8.190e-09
50-150  4.922e-09   3.238e-09
15-150  3.643e-08   1.623e-08
Thermal bremsstrahlung (OTTB)

Spectral model: thermal bremsstrahlung
------------------------------------------------------------
Parameters  : value         Lower 90%    Upper 90%
kT [keV]    : 42.7524       (-19.0909      44.3679)
Norm        : 5.69434       (-1.97725     3.60773)
------------------------------------------------------------
#Fit statistic : Chi-Squared =          56.64 using 59 PHA bins.
# Reduced chi-squared =         0.9937 for     57 degrees of freedom
# Null hypothesis probability =   4.884395e-01

Energy  Fluence     90% Error
[keV]   [erg/cm2]   [erg/cm2]
15- 25  1.336e-08   4.469e-09
25- 50  1.807e-08   6.083e-09
50-150  1.501e-08   8.587e-09
15-150  4.644e-08   1.849e-08
Double BB

Spectral model: bbodyrad<1> + bbodyrad<2>
------------------------------------------------------------
Parameters  : value         Lower 90%    Upper 90%
kT1 [keV]   : 5.10162        (-5.10543      2.77604)
R1^2/D10^2  : 4.66665        (-3.76211      -4.64496)
kT2 [keV]   : 17.8200        (-16.9236      30.4624)
R2^2/D10^2  : 2.72560E-02    (-0.0265026   1.23747)
------------------------------------------------------------
#Fit statistic : Chi-Squared =          56.51 using 59 PHA bins.
# Reduced chi-squared =          1.027 for     55 degrees of freedom
# Null hypothesis probability =   4.183055e-01

Energy  Fluence     90% Error
[keV]   [erg/cm2]   [erg/cm2]
15- 25  1.403e-08   8.260e-09
25- 50  1.641e-08   8.630e-09
50-150  1.872e-08   1.290e-08
15-150  4.916e-08   2.496e-08
Pre-slew spectrum (Pre-slew PHA with pre-slew DRM)
Power-law model

Spectral model in power-law:
------------------------------------------------------------
Parameters  : value       lower 90%   higher 90%
Photon index: 2.52721     ( -0.346219   0.399758 )
Norm@50keV  : 2.01380E-03    ( -0.000579231   0.000577113 )
------------------------------------------------------------
#Fit statistic : Chi-Squared =          37.71 using 59 PHA bins.
# Reduced chi-squared =         0.6616 for     57 degrees of freedom
# Null hypothesis probability =   9.771899e-01

Photon flux (15-150 keV)    in 8.984 sec: 0.402287 ( -0.0644778  0.0644975 ) ph/cm2/s
Energy fluence (15-150 keV)             : 1.82268e-07 ( -3.72444e-08  3.94931e-08 ) ergs/cm2
Cutoff power-law model

Spectral model in the cutoff power-law:
------------------------------------------------------------
Parameters  : value       lower 90%   higher 90%
Photon index: 1.98046     ( -2.07696   0.016119 )
Epeak [keV] : 1.22064      ( -0.578687 26.1798 )
Norm@50keV  : 4.56870E-03    (     )
------------------------------------------------------------
#Fit statistic : Chi-Squared =          37.79 using 59 PHA bins.
# Reduced chi-squared =         0.6749 for     56 degrees of freedom
# Null hypothesis probability =   9.704716e-01

Photon flux (15-150 keV)    in 8.984 sec: 0.399900 ( -0.065884  0.065965 ) ph/cm2/s
Energy fluence (15-150 keV)             : 1.77667e-07 ( -4.59586e-08  4.3311e-08 ) ergs/cm2
Band function

Spectral model in the Band function:
------------------------------------------------------------
Parameters  : value       lower 90%   higher 90%
alpha       : -4.53593   ( 4.53593   4.53593 )
beta        : -2.52722    ( -0.399692   0.346138 )
Epeak [keV] : 4.81946      ( -4.81946 -4.81946 )
Norm@50keV   : 0.273702    ( -0.0787239   0.0784395 )
------------------------------------------------------------
#Fit statistic : Chi-Squared =          37.71 using 59 PHA bins.
# Reduced chi-squared =         0.6857 for     55 degrees of freedom
# Null hypothesis probability =   9.637892e-01

Photon flux (15-150 keV)    in 8.984 sec: 0.398760 ( 6.60124  -0.063611 ) ph/cm2/s
Energy fluence (15-150 keV)             : 0 ( 0  0 ) ergs/cm2
S(25-50 keV) vs. S(50-100 keV) plot

S(25-50 keV)  = 6.06e-08
S(50-100 keV) = 4.21e-08
T90 vs. Hardness ratio plot

T90                                   = 8.47599995136261 sec.
Hardness ratio (energy fluence ratio) = 0.694719
Color vs. Color plot
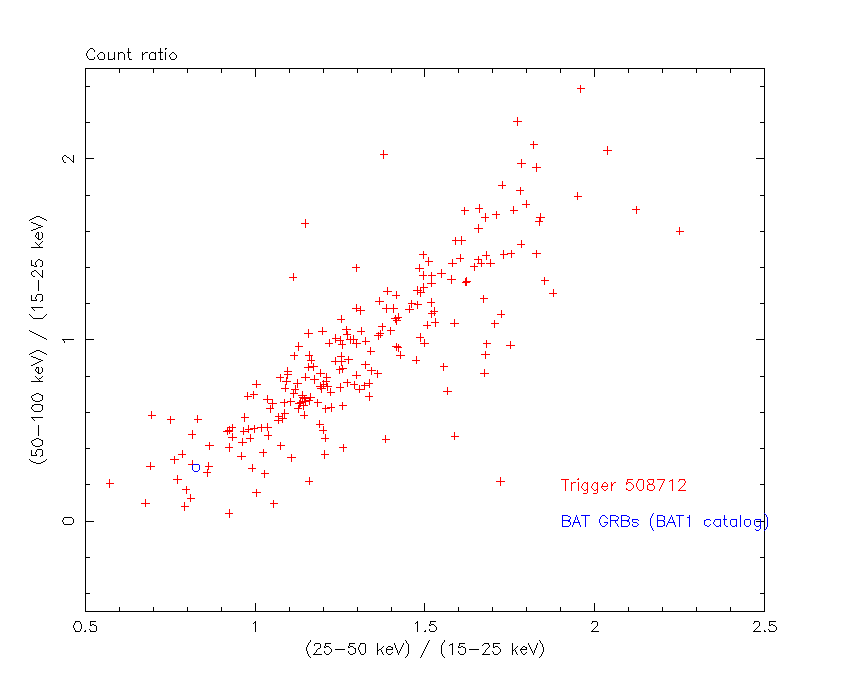
Count Ratio  (25-50 keV) / (15-25 keV) = 0.825538
Count Ratio (50-100 keV) / (15-25 keV) = 0.293977
Mask shadow pattern

IMX = 5.125278822604804E-01, IMY = 4.307130417598712E-01
TIME vs. PHA plot around the trigger time

Blue+Cyan dotted lines: Time interval of the scaled map
From 0.000000 to 2.048000
TIME vs. DetID plot around the trigger time

Blue+Cyan dotted lines: Time interval of the scaled map
From 0.000000 to 2.048000
100 us light curve (15-350 keV)

Blue+Cyan dotted lines: Time interval of the scaled map
From 0.000000 to 2.048000
Spacecraft aspect plot

Bright source in the pre-burst/pre-slew/post-slew images
Pre-burst image of 15-350 keV band
Time interval of the image:
-400.551400 -382.303200
-239.952000 -6.292000

# RAcent  DECcent POSerr Theta    Phi  PeakCts   SNR AngSep     Name
#  [deg]    [deg]    ['] [deg]  [deg]                   [']
170.4378 -60.5787    4.8  46.4 -144.0   1.1069   2.4    4.5	Cen X-3
186.5930 -62.8049    1.6  45.1 -133.0   3.7224   7.3    2.7	GX 301-2
350.5340 -43.3839    2.8  30.8   17.2   0.9121   4.0 ------	UNKNOWN
  7.6431 -58.7257    2.1  13.5   37.4   1.0183   5.6 ------	UNKNOWN
125.6891 -47.4216    3.0  51.5  178.3   2.1443   3.9 ------	UNKNOWN
325.3922 -29.3352    3.0  49.9   -7.0   1.6412   3.9 ------	UNKNOWN
290.4424 -67.3939    3.0  27.0  -70.9   0.9566   3.8 ------	UNKNOWN
311.2988 -32.2895    2.3  51.1  -23.1   2.4932   4.9 ------	UNKNOWN
239.3947 -63.3524    4.4  41.2  -99.3   2.9056   2.6 ------	UNKNOWN
Pre-slew background subtracted image of 15-350 keV band
Time interval of the image:
-6.292000 2.692000

# RAcent  DECcent POSerr Theta    Phi  PeakCts   SNR AngSep     Name
#  [deg]    [deg]    ['] [deg]  [deg]                   [']
170.1862 -60.7035   24.8  46.3 -144.1  -0.0329  -0.5    6.1	Cen X-3
186.6574 -62.8694   16.8  45.1 -133.0  -0.0556  -0.7    5.9	GX 301-2
103.8518 -76.6608    2.5  22.3 -165.8   0.1403   4.6 ------	UNKNOWN
307.4205 -52.7192    1.1  33.8  -40.0   0.4250  10.4 ------	UNKNOWN
Post-slew image of 15-350 keV band
Time interval of the image:
76.148590 748.848590

# RAcent  DECcent POSerr Theta    Phi  PeakCts   SNR AngSep     Name
#  [deg]    [deg]    ['] [deg]  [deg]                   [']
186.6200 -62.7770    1.4  55.6 -159.9  12.7296   8.1    1.1	GX 301-2
256.0527 -37.9995   45.8  38.1  -96.7   0.3390   0.3    9.8	4U 1700-377
256.2363 -36.3717    8.8  39.0  -94.5   2.5608   1.3   10.1	GX 349+2
264.7946 -44.4563    8.3  28.9  -99.1   0.8784   1.4    2.2	4U 1735-44
270.1551 -25.0515   68.6  39.4  -68.4   0.1904   0.2    7.2	GX 5-1
270.4279 -25.8360   93.1  38.6  -68.8   0.1222   0.1    8.8	GRS 1758-258
275.7288 -30.3803   23.1  32.1  -66.9   0.3044   0.5   10.2	H1820-303
284.9094 -24.8379    7.4  32.7  -48.5  -0.8299  -1.6    8.5	HT1900.1-2455
263.1157 -33.7662    7.6  36.7  -85.1  -1.7124  -1.5    7.5	GX 354-0
320.6722 -42.4199    3.4  13.6   37.6   1.3384   3.4 ------	UNKNOWN
263.5616 -76.4721    2.3  28.9 -168.7   1.9750   5.0 ------	UNKNOWN
306.0356  -2.6744    2.6  50.1  -10.2   3.4519   4.4 ------	UNKNOWN
304.1700  -0.6991    3.6  52.1  -12.5   3.1612   3.2 ------	UNKNOWN
172.7708 -62.8326    3.4  59.1 -166.1   9.5990   3.4 ------	UNKNOWN
249.0092 -54.7842    3.0  33.6 -125.8   2.1067   3.9 ------	UNKNOWN
251.6929 -37.3769    5.2  41.1  -99.4   5.5559   2.2 ------	UNKNOWN
Plot creation:
Sat May 30 21:01:08 EDT 2015