Click here for the BAT GCN circular template
Image
Pre-slew 15.0-350.0 keV image (Event data)
#   RAcent    DECcent   POSerr    Theta     Phi              Peak Cts       SNR   Name
  191.4943    -7.1752   0.0136    10.1190   -48.1709         0.2632532     14.219 TRIG_00509419

Foreground time interval of the image:
 -2.328   0.360 (delta_t =   2.688 [sec])
Background time interval of the image:
-239.848  -2.328 (delta_t = 237.520 [sec])
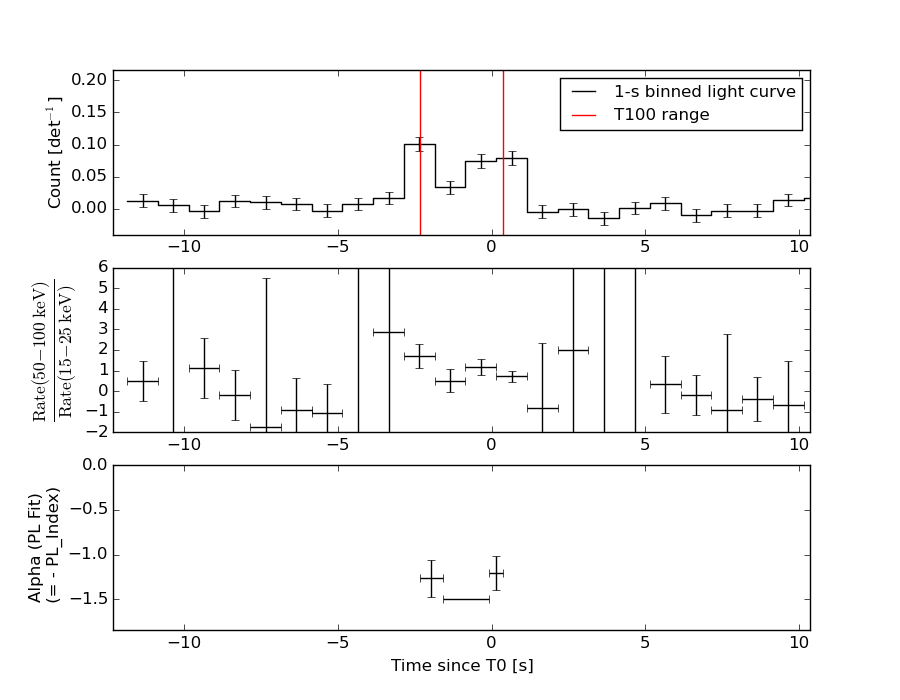
Lightcurves
Notes:
- 1) The mask-weighted light curves are using the flight position.
- 2) Multiple plots of different time binning/intervals are shown to cover all scenarios of short/long GRBs, rate/image triggers, and real/false positives.
- 3) For all the mask-weighted lightcurves, the y-axis units are counts/sec/det where a det is 0.4 x 0.4 = 0.16 sq cm.
- 4) The verticle lines correspond to following: green dotted lines are T50 interval, black dotted lines are T90 interval, blue solid line(s) is a spacecraft slew start time, and orange solid line(s) is a spacecraft slew end time.
- 5) Time of each bin is in the middle of the bin.
1 s binning
From T0-310 s to T0+310 s

From T100_start - 20 s to T100_end + 30 s
Full time interval
64 ms binning
Full time interval
From T100_start to T100_end

From T0-5 sec to T0+5 sec

16 ms binning
From T100_start-5 s to T100_start+5 s

Blue+Cyan dotted lines: Time interval of the scaled map
From 0.000000 to 0.256000
8 ms binning
From T100_start-3 s to T100_start+3 s
Blue+Cyan dotted lines: Time interval of the scaled map
From 0.000000 to 0.256000
2 ms binning
From T100_start-1 s to T100_start+1 s

Blue+Cyan dotted lines: Time interval of the scaled map
From 0.000000 to 0.256000
SN=5 or 10 sec. binning (whichever binning is satisfied first)

SN=5 or 10 sec. binning (T < 200 sec)

Quad-rate summed light curves (from T0-300s to T0+1000s)

The mask-weighted light curves based on cleaned DPHs

Spectral Evolution
Spectra
Notes:
- 1) The fitting includes the systematic errors.
- 2) When the burst includes telescope slew time periods, the fitting uses an average response file made from multiple 5-s response files through out the slew time plus single time preiod for the non-slew times, and weighted by the total counts in the corresponding time period using addrmf. An average response file is needed becuase a spectral fit using the pre-slew DRM will introduce some errors in both a spectral shape and a normalization if the PHA file contains a lot of the slew/post-slew time interval.
- 3) For fits to more complicated models (e.g. a power-law over a cutoff power-law), the BAT team has decided to require a chi-square improvement of more than 6 for each extra dof.
Time averaged spectrum fit using the average DRM
Power-law model

Time interval is from   -2.328 sec. to    0.360 sec.

Spectral model in power-law:
------------------------------------------------------------
Parameters  : value       lower 90%   higher 90%
Photon index: 1.29672     ( -0.194316   0.193882 )
Norm@50keV  : 6.17146E-03    ( -0.0006915   0.000689334 )
------------------------------------------------------------
#Fit statistic : Chi-Squared =          61.14 using 59 PHA bins.
# Reduced chi-squared =          1.073 for     57 degrees of freedom
# Null hypothesis probability =   3.297087e-01

Photon flux (15-150 keV)    in 2.688 sec: 0.735828 ( -0.082068  0.0821284 ) ph/cm2/s
Energy fluence (15-150 keV)             : 1.6406e-07 ( -2.09219e-08  2.1191e-08 ) ergs/cm2
Cutoff power-law model

Time interval is from   -2.328 sec. to    0.360 sec.
Spectral model in the cutoff power-law:
------------------------------------------------------------
Parameters  : value       lower 90%   higher 90%
Photon index: 1.03317     ( -0.83299   0.432527 )
Epeak [keV] : 186.076      ( -186.076 -186.076 )
Norm@50keV  : 8.37288E-03    ( -0.00354553   0.012993 )
------------------------------------------------------------
#Fit statistic : Chi-Squared =          60.75 using 59 PHA bins.
# Reduced chi-squared =          1.085 for     56 degrees of freedom
# Null hypothesis probability =   3.086161e-01

Photon flux (15-150 keV)    in 2.688 sec: 0.727836 ( -0.08513  0.084845 ) ph/cm2/s
Energy fluence (15-150 keV)             : 1.60633e-07 ( -2.33162e-08  2.3123e-08 ) ergs/cm2
Band function
Time interval is from   -2.328 sec. to    0.360 sec.

Spectral model in the Band function:
------------------------------------------------------------
Parameters  : value       lower 90%   higher 90%
alpha       : -0.786016   ( 0.87548   0.87548 )
beta        : -1.43146    ( 1.42733   0.306771 )
Epeak [keV] : 97.9370      ( -96.3363 -96.3363 )
Norm@50keV   : 1.20237E-02    ( -0.00671646   0 )
------------------------------------------------------------
#Fit statistic : Chi-Squared =          60.64 using 59 PHA bins.
# Reduced chi-squared =          1.103 for     55 degrees of freedom
# Null hypothesis probability =   2.798388e-01

Photon flux (15-150 keV)    in 2.688 sec:  (    ) ph/cm2/s
Energy fluence (15-150 keV)             : 0 ( 0  0 ) ergs/cm2
Single BB

Spectral model blackbody:
------------------------------------------------------------
Parameters  : value    Lower 90%  Upper 90%
kT [keV]    : 16.4798  (-2.34969  2.86653)
R^2/D10^2   : 6.26664E-02  (-0.0261153   0.0429131)
(R is the radius in km and D10 is the distance to the source in units of 10 kpc)
------------------------------------------------------------
#Fit statistic : Chi-Squared =          77.01 using 59 PHA bins.
# Reduced chi-squared =          1.351 for     57 degrees of freedom
# Null hypothesis probability =   3.987532e-02

Energy  Fluence     90% Error
[keV]   [erg/cm2]   [erg/cm2]
15- 25  9.393e-09   2.114e-09
25- 50  4.052e-08   6.263e-09
50-150  7.776e-08   1.671e-08
15-150  1.277e-07   1.956e-08
Thermal bremsstrahlung (OTTB)

Spectral model: thermal bremsstrahlung
------------------------------------------------------------
Parameters  : value         Lower 90%    Upper 90%
kT [keV]    : 200.000       (      )
Norm        : 3.01338       (-0.335541     0.335524)
------------------------------------------------------------
#Fit statistic : Chi-Squared =          65.17 using 59 PHA bins.
# Reduced chi-squared =          1.143 for     57 degrees of freedom
# Null hypothesis probability =   2.137989e-01

Energy  Fluence     90% Error
[keV]   [erg/cm2]   [erg/cm2]
15- 25  2.017e-08   1.137e-08
25- 50  3.881e-08   2.111e-08
50-150  8.512e-08   4.664e-08
15-150  1.441e-07   7.939e-08
Double BB

Spectral model: bbodyrad<1> + bbodyrad<2>
------------------------------------------------------------
Parameters  : value         Lower 90%    Upper 90%
kT1 [keV]   : 8.23759        (-3.46997      3.68947)
R1^2/D10^2  : 0.401037        (-0.259987      1.96649)
kT2 [keV]   : 31.7261        (-11.0712      65.6281)
R2^2/D10^2  : 5.58479E-03    (-0.00528696   0.0205135)
------------------------------------------------------------
#Fit statistic : Chi-Squared =          61.15 using 59 PHA bins.
# Reduced chi-squared =          1.112 for     55 degrees of freedom
# Null hypothesis probability =   2.647206e-01

Energy  Fluence     90% Error
[keV]   [erg/cm2]   [erg/cm2]
15- 25  1.579e-08   8.768e-09
25- 50  3.925e-08   1.988e-08
50-150  1.071e-07   5.871e-08
15-150  1.622e-07   8.039e-08
Peak spectrum fit
Power-law model
Time interval is from   -2.330 sec. to   -1.330 sec.

Spectral model in power-law:
------------------------------------------------------------
Parameters  : value       lower 90%   higher 90%
Photon index: 1.23598     ( -0.229384   0.227381 )
Norm@50keV  : 8.69517E-03    ( -0.00116985   0.00116695 )
------------------------------------------------------------
#Fit statistic : Chi-Squared =          68.52 using 59 PHA bins.
# Reduced chi-squared =          1.202 for     57 degrees of freedom
# Null hypothesis probability =   1.410398e-01

Photon flux (15-150 keV)    in 1 sec: 1.02611 ( -0.139129  0.139297 ) ph/cm2/s
Energy fluence (15-150 keV)             : 8.73462e-08 ( -1.32123e-08  1.33863e-08 ) ergs/cm2
Cutoff power-law model

Time interval is from   -2.330 sec. to   -1.330 sec.
Spectral model in the cutoff power-law:
------------------------------------------------------------
Parameters  : value       lower 90%   higher 90%
Photon index: 0.480585     ( -1.28898   0.853161 )
Epeak [keV] : 103.419      ( -36.8784 -103.408 )
Norm@50keV  : 2.05032E-02    ( -0.0124899   0.0650614 )
------------------------------------------------------------
#Fit statistic : Chi-Squared =          66.87 using 59 PHA bins.
# Reduced chi-squared =          1.194 for     56 degrees of freedom
# Null hypothesis probability =   1.515804e-01

Photon flux (15-150 keV)    in 1 sec: 0.995289 ( -0.073741  0.145671 ) ph/cm2/s
Energy fluence (15-150 keV)             : 8.25621e-08 ( -1.49219e-08  1.49493e-08 ) ergs/cm2
Band function

Time interval is from   -2.330 sec. to   -1.330 sec.

Spectral model in the Band function:
------------------------------------------------------------
Parameters  : value       lower 90%   higher 90%
alpha       : -0.236322   ( 0.219108   5.18766 )
beta        : -1.73920    ( 1.74481   0.631883 )
Epeak [keV] : 84.3703      ( -80.933 310.168 )
Norm@50keV   : 2.83894E-02    ( -0.0311635   94.5116 )
------------------------------------------------------------
#Fit statistic : Chi-Squared =          66.61 using 59 PHA bins.
# Reduced chi-squared =          1.211 for     55 degrees of freedom
# Null hypothesis probability =   1.357184e-01

Photon flux (15-150 keV)    in 1 sec:  (    ) ph/cm2/s
Energy fluence (15-150 keV)             : 0 ( 0  0 ) ergs/cm2
Single BB
Spectral model blackbody:
------------------------------------------------------------
Parameters  : value    Lower 90%  Upper 90%
kT [keV]    : 16.9493  (-2.5316  3.19923)
R^2/D10^2   : 8.25409E-02  (-0.0364513   0.0602945)
(R is the radius in km and D10 is the distance to the source in units of 10 kpc)
------------------------------------------------------------
#Fit statistic : Chi-Squared =          72.16 using 59 PHA bins.
# Reduced chi-squared =          1.266 for     57 degrees of freedom
# Null hypothesis probability =   8.502977e-02

Energy  Fluence     90% Error
[keV]   [erg/cm2]   [erg/cm2]
15- 25  4.833e-09   1.292e-09
25- 50  2.133e-08   4.610e-09
50-150  4.372e-08   1.045e-08
15-150  6.988e-08   1.346e-08
Thermal bremsstrahlung (OTTB)
Spectral model: thermal bremsstrahlung
------------------------------------------------------------
Parameters  : value         Lower 90%    Upper 90%
kT [keV]    : 200.000       (      )
Norm        : 4.20936       (-0.570651     0.570622)
------------------------------------------------------------
#Fit statistic : Chi-Squared =          72.56 using 59 PHA bins.
# Reduced chi-squared =          1.273 for     57 degrees of freedom
# Null hypothesis probability =   8.018637e-02

Energy  Fluence     90% Error
[keV]   [erg/cm2]   [erg/cm2]
15- 25  1.048e-08   5.945e-09
25- 50  2.016e-08   1.137e-08
50-150  4.422e-08   2.454e-08
15-150  7.487e-08   4.193e-08
Double BB

R1^2/D10^2  : 0.217832        (-3001.92      96648.4)
kT2 [keV]   : 38.0766        (      )
R2^2/D10^2  : 3.66399E-03    (   )
------------------------------------------------------------
#Fit statistic : Chi-Squared =          67.67 using 59 PHA bins.
#Fit statistic : Chi-Squared =          67.11 using 59 PHA bins.
#Fit statistic : Chi-Squared =          67.09 using 59 PHA bins.
# Reduced chi-squared =          1.230 for     55 degrees of freedom
# Reduced chi-squared =          1.220 for     55 degrees of freedom
# Reduced chi-squared =          1.220 for     55 degrees of freedom
# Null hypothesis probability =   1.173010e-01
# Null hypothesis probability =   1.267523e-01
# Null hypothesis probability =   1.271262e-01

Energy  Fluence     90% Error
[keV]   [erg/cm2]   [erg/cm2]
15- 25  6.256e-09   1.714e-09
25- 50  1.982e-08   4.445e-09
50-150  4.640e-08   1.341e-08
15-150  7.248e-08   1.540e-08
Pre-slew spectrum (Pre-slew PHA with pre-slew DRM)
Power-law model

Spectral model in power-law:
------------------------------------------------------------
Parameters  : value       lower 90%   higher 90%
Photon index: 1.29672     ( -0.194316   0.193882 )
Norm@50keV  : 6.17146E-03    ( -0.0006915   0.000689334 )
------------------------------------------------------------
#Fit statistic : Chi-Squared =          61.14 using 59 PHA bins.
# Reduced chi-squared =          1.073 for     57 degrees of freedom
# Null hypothesis probability =   3.297087e-01

Photon flux (15-150 keV)    in 2.688 sec: 0.735828 ( -0.082068  0.0821284 ) ph/cm2/s
Energy fluence (15-150 keV)             : 1.6406e-07 ( -2.09219e-08  2.1191e-08 ) ergs/cm2
Cutoff power-law model

Spectral model in the cutoff power-law:
------------------------------------------------------------
Parameters  : value       lower 90%   higher 90%
Photon index: 1.03317     ( -0.83299   0.432527 )
Epeak [keV] : 186.076      ( -186.076 -186.076 )
Norm@50keV  : 8.37288E-03    ( -0.00354553   0.012993 )
------------------------------------------------------------
#Fit statistic : Chi-Squared =          60.75 using 59 PHA bins.
# Reduced chi-squared =          1.085 for     56 degrees of freedom
# Null hypothesis probability =   3.086161e-01

Photon flux (15-150 keV)    in 2.688 sec: 0.727836 ( -0.08513  0.084845 ) ph/cm2/s
Energy fluence (15-150 keV)             : 1.60633e-07 ( -2.33162e-08  2.3123e-08 ) ergs/cm2
Band function

Spectral model in the Band function:
------------------------------------------------------------
Parameters  : value       lower 90%   higher 90%
alpha       : -0.786016   ( 0.87548   0.87548 )
beta        : -1.43146    ( 1.42733   0.306771 )
Epeak [keV] : 97.9370      ( -96.3363 -96.3363 )
Norm@50keV   : 1.20237E-02    ( -0.00671646   0 )
------------------------------------------------------------
#Fit statistic : Chi-Squared =          60.64 using 59 PHA bins.
# Reduced chi-squared =          1.103 for     55 degrees of freedom
# Null hypothesis probability =   2.798388e-01

Photon flux (15-150 keV)    in 2.688 sec:  (    ) ph/cm2/s
Energy fluence (15-150 keV)             : 0 ( 0  0 ) ergs/cm2
S(25-50 keV) vs. S(50-100 keV) plot

S(25-50 keV)  = 3.64e-08
S(50-100 keV) = 5.93e-08
T90 vs. Hardness ratio plot

T90                                   = 2.51599991321564 sec.
Hardness ratio (energy fluence ratio) = 1.62912
Color vs. Color plot
Count Ratio  (25-50 keV) / (15-25 keV) = 1.38604
Count Ratio (50-100 keV) / (15-25 keV) = 1.17691
Mask shadow pattern

IMX = 1.190234813146320E-01, IMY = 1.329845045493814E-01
TIME vs. PHA plot around the trigger time
Blue+Cyan dotted lines: Time interval of the scaled map
From 0.000000 to 0.256000
TIME vs. DetID plot around the trigger time
Blue+Cyan dotted lines: Time interval of the scaled map
From 0.000000 to 0.256000
100 us light curve (15-350 keV)

Blue+Cyan dotted lines: Time interval of the scaled map
From 0.000000 to 0.256000
Spacecraft aspect plot

Bright source in the pre-burst/pre-slew/post-slew images
Pre-burst image of 15-350 keV band
Time interval of the image:
-239.848000 -2.328000

# RAcent  DECcent POSerr Theta    Phi  PeakCts   SNR AngSep     Name
#  [deg]    [deg]    ['] [deg]  [deg]                   [']
180.3176  -6.8980    2.5  11.3   14.3   0.8486   4.7 ------	UNKNOWN
192.8264   6.6337    2.4   7.2 -153.3   0.8076   4.8 ------	UNKNOWN
210.2682 -44.2971    3.8  50.7  -44.7   3.1236   3.1 ------	UNKNOWN
Pre-slew background subtracted image of 15-350 keV band
Time interval of the image:
-2.328000 0.360000

# RAcent  DECcent POSerr Theta    Phi  PeakCts   SNR AngSep     Name
#  [deg]    [deg]    ['] [deg]  [deg]                   [']
209.3342  52.2980    2.0  53.6  173.2   0.4292   5.8 ------	UNKNOWN
191.4942  -7.1752    0.8  10.1  -48.2   0.2633  14.2 ------	UNKNOWN
233.9461  35.0845    2.1  54.5 -156.4   0.3323   5.6 ------	UNKNOWN
Post-slew image of 15-350 keV band
Time interval of the image:
44.652590 962.210500

# RAcent  DECcent POSerr Theta    Phi  PeakCts   SNR AngSep     Name
#  [deg]    [deg]    ['] [deg]  [deg]                   [']
170.3003 -60.6236   16.1  55.8   -9.4   1.3699   0.7    0.5	Cen X-3
186.6688 -62.7692  297.2  55.7  -19.1   0.0792   0.0    0.3	GX 301-2
166.9109 -24.7469    2.2  29.3   28.6   3.4793   5.3 ------	UNKNOWN
208.4637  12.9108    2.5  26.2 -161.7   2.5006   4.7 ------	UNKNOWN
231.4221  38.8740    3.5  59.1 -166.1  13.4366   3.3 ------	UNKNOWN
221.9707 -13.3847    5.4  30.6  -97.6   1.7340   2.1 ------	UNKNOWN
214.3201 -58.0153    3.3  53.8  -36.5  11.0310   3.5 ------	UNKNOWN
220.5732 -51.8065    4.3  50.6  -44.7   8.6689   2.7 ------	UNKNOWN
235.1439  -2.1297    3.1  43.8 -116.2   8.9034   3.8 ------	UNKNOWN
Plot creation:
Sat May 30 20:55:38 EDT 2015