Special notes of this burst
Image
Pre-slew 15.0-350.0 keV image (Event data)
#   RAcent    DECcent   POSerr    Theta     Phi              Peak Cts       SNR   Name
  310.4417   -68.5849   0.0141    36.2066   -58.8916         2.0917704     13.628 TRIG_00509543

Foreground time interval of the image:
 -5.768  47.149 (delta_t =  52.917 [sec])
Background time interval of the image:
-239.752  -5.768 (delta_t = 233.984 [sec])
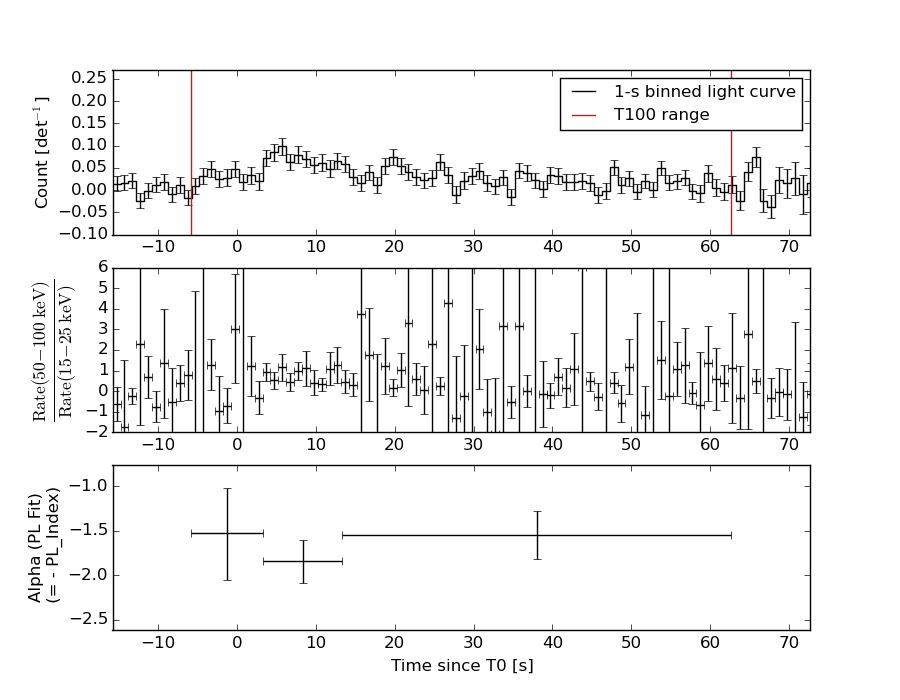
Lightcurves
Notes:
- 1) The mask-weighted light curves are using the flight position.
- 2) Multiple plots of different time binning/intervals are shown to cover all scenarios of short/long GRBs, rate/image triggers, and real/false positives.
- 3) For all the mask-weighted lightcurves, the y-axis units are counts/sec/det where a det is 0.4 x 0.4 = 0.16 sq cm.
- 4) The verticle lines correspond to following: green dotted lines are T50 interval, black dotted lines are T90 interval, blue solid line(s) is a spacecraft slew start time, and orange solid line(s) is a spacecraft slew end time.
- 5) Time of each bin is in the middle of the bin.
1 s binning
From T0-310 s to T0+310 s
From T100_start - 20 s to T100_end + 30 s
Full time interval
64 ms binning
Full time interval

From T100_start to T100_end
From T0-5 sec to T0+5 sec
16 ms binning
From T100_start-5 s to T100_start+5 s
Blue+Cyan dotted lines: Time interval of the scaled map
From 0.000000 to 8.192000
8 ms binning
From T100_start-3 s to T100_start+3 s
Blue+Cyan dotted lines: Time interval of the scaled map
From 0.000000 to 8.192000
2 ms binning
From T100_start-1 s to T100_start+1 s
Blue+Cyan dotted lines: Time interval of the scaled map
From 0.000000 to 8.192000
SN=5 or 10 sec. binning (whichever binning is satisfied first)

SN=5 or 10 sec. binning (T < 200 sec)

Quad-rate summed light curves (from T0-300s to T0+1000s)

The mask-weighted light curves based on cleaned DPHs

Spectral Evolution
Spectra
Notes:
- 1) The fitting includes the systematic errors.
- 2) When the burst includes telescope slew time periods, the fitting uses an average response file made from multiple 5-s response files through out the slew time plus single time preiod for the non-slew times, and weighted by the total counts in the corresponding time period using addrmf. An average response file is needed becuase a spectral fit using the pre-slew DRM will introduce some errors in both a spectral shape and a normalization if the PHA file contains a lot of the slew/post-slew time interval.
- 3) For fits to more complicated models (e.g. a power-law over a cutoff power-law), the BAT team has decided to require a chi-square improvement of more than 6 for each extra dof.
Time averaged spectrum fit using the average DRM
Power-law model
Time interval is from   -5.768 sec. to   62.648 sec.

Spectral model in power-law:
------------------------------------------------------------
Parameters  : value       lower 90%   higher 90%
Photon index: 1.62767     ( -0.183353   0.18673 )
Norm@50keV  : 2.17482E-03    ( -0.000246178   0.000244095 )
------------------------------------------------------------
#Fit statistic : Chi-Squared =          55.05 using 59 PHA bins.
# Reduced chi-squared =         0.9658 for     57 degrees of freedom
# Null hypothesis probability =   5.486172e-01

Photon flux (15-150 keV)    in 68.42 sec: 0.281922 ( -0.030986  0.0310454 ) ph/cm2/s
Energy fluence (15-150 keV)             : 1.38716e-06 ( -1.66031e-07  1.67762e-07 ) ergs/cm2
Cutoff power-law model
Time interval is from   -5.768 sec. to   62.648 sec.
Spectral model in the cutoff power-law:
------------------------------------------------------------
Parameters  : value       lower 90%   higher 90%
Photon index: 0.877180     ( -0.996054   0.79653 )
Epeak [keV] : 71.0926      ( -18.8476 -71.0947 )
Norm@50keV  : 5.39299E-03    ( -0.00327642   0.0125144 )
------------------------------------------------------------
#Fit statistic : Chi-Squared =          52.51 using 59 PHA bins.
# Reduced chi-squared =         0.9377 for     56 degrees of freedom
# Null hypothesis probability =   6.077860e-01

Photon flux (15-150 keV)    in 68.42 sec: 0.273197 ( -0.03253  0.032458 ) ph/cm2/s
Energy fluence (15-150 keV)             : 1.30669e-06 ( -1.87888e-07  1.89599e-07 ) ergs/cm2
Band function

Time interval is from   -5.768 sec. to   62.648 sec.

Spectral model in the Band function:
------------------------------------------------------------
Parameters  : value       lower 90%   higher 90%
alpha       : -0.464359   ( -1.3961   5.43812 )
beta        : -2.08419    ( 2.08807   0.493119 )
Epeak [keV] : 56.3094      ( -34.5273 142.424 )
Norm@50keV   : 9.66172E-03    ( -0.00632384   31.2135 )
------------------------------------------------------------
#Fit statistic : Chi-Squared =          51.74 using 59 PHA bins.
# Reduced chi-squared =         0.9407 for     55 degrees of freedom
# Null hypothesis probability =   6.000369e-01

Photon flux (15-150 keV)    in 68.42 sec:  (    ) ph/cm2/s
Energy fluence (15-150 keV)             : 1.31742e-06 ( 0  0 ) ergs/cm2
Single BB

Spectral model blackbody:
------------------------------------------------------------
Parameters  : value    Lower 90%  Upper 90%
kT [keV]    : 13.1639  (-1.55606  1.8177)
R^2/D10^2   : 5.04172E-02  (-0.0190683   0.029501)
(R is the radius in km and D10 is the distance to the source in units of 10 kpc)
------------------------------------------------------------
#Fit statistic : Chi-Squared =          64.05 using 59 PHA bins.
# Reduced chi-squared =          1.124 for     57 degrees of freedom
# Null hypothesis probability =   2.430316e-01

Energy  Fluence     90% Error
[keV]   [erg/cm2]   [erg/cm2]
15- 25  1.267e-07   2.819e-08
25- 50  4.424e-07   6.418e-08
50-150  4.883e-07   1.184e-07
15-150  1.057e-06   1.516e-07
Thermal bremsstrahlung (OTTB)

Spectral model: thermal bremsstrahlung
------------------------------------------------------------
Parameters  : value         Lower 90%    Upper 90%
kT [keV]    : 151.594       (-56.4796      -151.389)
Norm        : 1.17156       (-0.140542     0.163748)
------------------------------------------------------------
#Fit statistic : Chi-Squared =          53.08 using 59 PHA bins.
# Reduced chi-squared =         0.9313 for     57 degrees of freedom
# Null hypothesis probability =   6.227699e-01

Energy  Fluence     90% Error
[keV]   [erg/cm2]   [erg/cm2]
15- 25  2.057e-07   3.989e-08
25- 50  3.818e-07   1.616e-07
50-150  7.570e-07   3.986e-07
15-150  1.345e-06   6.590e-07
Double BB
------------------------------------------------------------
Parameters  : value         Lower 90%    Upper 90%
kT1 [keV]   : 9.26827        (      )
R1^2/D10^2  : 0.134814        (-0.0722263      0.357384)
kT2 [keV]   : 33.1179        (-15.1234      -32.5133)
R2^2/D10^2  : 1.11019E-03    (-0.00120022   0.013184)
------------------------------------------------------------
#Fit statistic : Chi-Squared =          54.41 using 59 PHA bins.
#Fit statistic : Chi-Squared =          52.06 using 59 PHA bins.
# Reduced chi-squared =         0.9892 for     55 degrees of freedom
# Reduced chi-squared =         0.9466 for     55 degrees of freedom
# Null hypothesis probability =   4.972824e-01
# Null hypothesis probability =   5.875069e-01

Energy  Fluence     90% Error
[keV]   [erg/cm2]   [erg/cm2]
15- 25  1.730e-07   1.048e-07
25- 50  3.862e-07   2.072e-07
50-150  6.208e-07   3.671e-07
15-150  1.180e-06   6.373e-07
Peak spectrum fit
Power-law model
Time interval is from    4.764 sec. to    5.764 sec.

Spectral model in power-law:
------------------------------------------------------------
Parameters  : value       lower 90%   higher 90%
Photon index: 1.68945     ( -0.559221   0.590093 )
Norm@50keV  : 6.22025E-03    ( -0.00216004   0.00206579 )
------------------------------------------------------------
#Fit statistic : Chi-Squared =          65.85 using 59 PHA bins.
# Reduced chi-squared =          1.155 for     57 degrees of freedom
# Null hypothesis probability =   1.974067e-01

Photon flux (15-150 keV)    in 1 sec: 0.823098 ( -0.259166  0.260001 ) ph/cm2/s
Energy fluence (15-150 keV)             : 5.76414e-08 ( -2.01148e-08  2.08644e-08 ) ergs/cm2
Cutoff power-law model
Time interval is from    4.764 sec. to    5.764 sec.
Spectral model in the cutoff power-law:
------------------------------------------------------------
Parameters  : value       lower 90%   higher 90%
Photon index: 1.65793     ( -2.43791   0.722911 )
Epeak [keV] : 493.586      (   )
Norm@50keV  : 6.47348E-03    ( -0.00648641   0.226083 )
------------------------------------------------------------
#Fit statistic : Chi-Squared =          65.84 using 59 PHA bins.
# Reduced chi-squared =          1.176 for     56 degrees of freedom
# Null hypothesis probability =   1.728682e-01

Photon flux (15-150 keV)    in 1 sec: 0.821689 ( -0.261446  0.260691 ) ph/cm2/s
Energy fluence (15-150 keV)             : 5.70605e-08 ( -2.22656e-08  2.13282e-08 ) ergs/cm2
Band function
Time interval is from    4.764 sec. to    5.764 sec.

Spectral model in the Band function:
------------------------------------------------------------
Parameters  : value       lower 90%   higher 90%
alpha       : 4.96462   ( -4.96462   -4.96462 )
beta        : -1.94924    ( -1.24727   0.701446 )
Epeak [keV] : 26.5734      ( -26.5734 62.6401 )
Norm@50keV   : 534.319    ( -163.582   7.71932e+06 )
------------------------------------------------------------
#Fit statistic : Chi-Squared =          65.11 using 59 PHA bins.
# Reduced chi-squared =          1.184 for     55 degrees of freedom
# Null hypothesis probability =   1.651555e-01

Photon flux (15-150 keV)    in 1 sec:  (    ) ph/cm2/s
Energy fluence (15-150 keV)             : 0 ( 0  0 ) ergs/cm2
Single BB
Spectral model blackbody:
------------------------------------------------------------
Parameters  : value    Lower 90%  Upper 90%
kT [keV]    : 10.4753  (-3.67986  8.64855)
R^2/D10^2   : 0.320908  (-0.316019   1.33411)
(R is the radius in km and D10 is the distance to the source in units of 10 kpc)
------------------------------------------------------------
#Fit statistic : Chi-Squared =          69.35 using 59 PHA bins.
# Reduced chi-squared =          1.217 for     57 degrees of freedom
# Null hypothesis probability =   1.264426e-01

Energy  Fluence     90% Error
[keV]   [erg/cm2]   [erg/cm2]
15- 25  7.274e-09   4.489e-09
25- 50  1.929e-08   1.238e-08
50-150  1.149e-08   8.365e-09
15-150  3.805e-08   2.355e-08
Thermal bremsstrahlung (OTTB)
Spectral model: thermal bremsstrahlung
------------------------------------------------------------
Parameters  : value         Lower 90%    Upper 90%
kT [keV]    : 161.749       (-157.209      -157.209)
Norm        : 3.29226       (-1.08145     2.13579)
------------------------------------------------------------
#Fit statistic : Chi-Squared =          65.98 using 59 PHA bins.
# Reduced chi-squared =          1.158 for     57 degrees of freedom
# Null hypothesis probability =   1.942739e-01

Energy  Fluence     90% Error
[keV]   [erg/cm2]   [erg/cm2]
15- 25  8.398e-09   5.220e-09
25- 50  1.573e-08   9.250e-09
50-150  3.201e-08   2.032e-08
15-150  5.614e-08   3.457e-08
Double BB

Spectral model: bbodyrad<1> + bbodyrad<2>
------------------------------------------------------------
Parameters  : value         Lower 90%    Upper 90%
kT1 [keV]   : 6.89447        (-3.06259      4.61136)
R1^2/D10^2  : 1.23020        (-1.04442      10.1587)
kT2 [keV]   : 33.8116        (-19.7636      -33.7099)
R2^2/D10^2  : 3.87915E-03    (-0.00387957   0.0844751)
------------------------------------------------------------
#Fit statistic : Chi-Squared =          64.75 using 59 PHA bins.
# Reduced chi-squared =          1.177 for     55 degrees of freedom
# Null hypothesis probability =   1.728845e-01

Energy  Fluence     90% Error
[keV]   [erg/cm2]   [erg/cm2]
15- 25  9.887e-09   6.250e-09
25- 50  1.644e-08   9.250e-09
50-150  3.361e-08   1.957e-08
15-150  5.994e-08   3.288e-08
Pre-slew spectrum (Pre-slew PHA with pre-slew DRM)
Power-law model

Spectral model in power-law:
------------------------------------------------------------
Parameters  : value       lower 90%   higher 90%
Photon index: 1.61599     ( -0.187446   0.190537 )
Norm@50keV  : 2.45826E-03    ( -0.000281664   0.000279236 )
------------------------------------------------------------
#Fit statistic : Chi-Squared =          61.93 using 59 PHA bins.
# Reduced chi-squared =          1.086 for     57 degrees of freedom
# Null hypothesis probability =   3.046809e-01

Photon flux (15-150 keV)    in 52.92 sec: 0.317482 ( -0.0353838  0.035447 ) ph/cm2/s
Energy fluence (15-150 keV)             : 1.21433e-06 ( -1.47611e-07  1.49141e-07 ) ergs/cm2
Cutoff power-law model
Spectral model in the cutoff power-law:
------------------------------------------------------------
Parameters  : value       lower 90%   higher 90%
Photon index: 1.09791     ( -0.90862   0.647214 )
Epeak [keV] : 83.4151      ( -28.4129 -83.417 )
Norm@50keV  : 4.59486E-03    ( -0.00233185   0.00899701 )
------------------------------------------------------------
#Fit statistic : Chi-Squared =          60.58 using 59 PHA bins.
# Reduced chi-squared =          1.082 for     56 degrees of freedom
# Null hypothesis probability =   3.140316e-01

Photon flux (15-150 keV)    in 52.92 sec: 0.310753 ( -0.036884  0.036787 ) ph/cm2/s
Energy fluence (15-150 keV)             : 1.16546e-06 ( -1.65777e-07  1.65936e-07 ) ergs/cm2
Band function
Spectral model in the Band function:
------------------------------------------------------------
Parameters  : value       lower 90%   higher 90%
alpha       : 0.317414   ( -1.14677   -1.14677 )
beta        : -1.83211    ( 1.83929   0.316333 )
Epeak [keV] : 40.2763      ( -36.2866 27.6924 )
Norm@50keV   : 4.16428E-02    ( -0.0418556   52.2332 )
------------------------------------------------------------
#Fit statistic : Chi-Squared =          59.92 using 59 PHA bins.
# Reduced chi-squared =          1.089 for     55 degrees of freedom
# Null hypothesis probability =   3.020294e-01

Photon flux (15-150 keV)    in 52.92 sec:  (    ) ph/cm2/s
Energy fluence (15-150 keV)             : 1.17932e-06 ( 0  0 ) ergs/cm2
S(25-50 keV) vs. S(50-100 keV) plot
S(25-50 keV)  = 3.64e-07
S(50-100 keV) = 4.71e-07
T90 vs. Hardness ratio plot
T90                                   = 56.3040000200272 sec.
Hardness ratio (energy fluence ratio) = 1.29396
Color vs. Color plot
Count Ratio  (25-50 keV) / (15-25 keV) = 1.75169
Count Ratio (50-100 keV) / (15-25 keV) = 1.16389
Mask shadow pattern

IMX = 3.782290248953952E-01, IMY = 6.267895714224447E-01
TIME vs. PHA plot around the trigger time
Blue+Cyan dotted lines: Time interval of the scaled map
From 0.000000 to 8.192000
TIME vs. DetID plot around the trigger time
Blue+Cyan dotted lines: Time interval of the scaled map
From 0.000000 to 8.192000
100 us light curve (15-350 keV)
Blue+Cyan dotted lines: Time interval of the scaled map
From 0.000000 to 8.192000
Spacecraft aspect plot
Bright source in the pre-burst/pre-slew/post-slew images
Pre-burst image of 15-350 keV band
Time interval of the image:
-239.752000 -5.768000

# RAcent  DECcent POSerr Theta    Phi  PeakCts   SNR AngSep     Name
#  [deg]    [deg]    ['] [deg]  [deg]                   [']
135.5362 -40.5629    0.8  42.2  168.4   5.5647  14.4    0.6	Vela X-1
170.3919 -60.6278    1.8  36.0 -145.3   1.6942   6.4    2.3	Cen X-3
186.7725 -62.6251    9.5  38.5 -132.7   0.4009   1.2    9.3	GX 301-2
 91.9995 -52.5704    2.7  19.4  121.4   0.8830   4.2 ------	UNKNOWN
 18.0342 -36.8426    2.5  45.0   17.4   1.8223   4.7 ------	UNKNOWN
356.7936 -31.1575    2.9  57.2   -0.5   4.7676   4.0 ------	UNKNOWN
190.5762 -51.0674    3.6  49.8 -137.5   2.5570   3.2 ------	UNKNOWN
Pre-slew background subtracted image of 15-350 keV band
Time interval of the image:
-5.768000 47.148600

# RAcent  DECcent POSerr Theta    Phi  PeakCts   SNR AngSep     Name
#  [deg]    [deg]    ['] [deg]  [deg]                   [']
135.6372 -40.6321    7.4  42.1  168.6  -0.2361  -1.6    6.8	Vela X-1
170.5531 -60.6784    4.1  36.0 -145.2  -0.3287  -2.8    7.7	Cen X-3
186.2577 -62.6923    6.9  38.3 -133.0   0.2430   1.7   11.9	GX 301-2
310.4417 -68.5849    0.8  36.2  -58.9   2.0921  13.6 ------	UNKNOWN
Post-slew image of 15-350 keV band
Time interval of the image:
239.748610 962.294300

# RAcent  DECcent POSerr Theta    Phi  PeakCts   SNR AngSep     Name
#  [deg]    [deg]    ['] [deg]  [deg]                   [']
 70.3934  35.2974    3.0  32.2   90.9   2.9173   3.9 ------	UNKNOWN
 46.5450  22.4567    2.7  39.0  132.0   4.3713   4.4 ------	UNKNOWN
 95.4736  50.7263    2.3  31.6   45.1   2.9995   5.0 ------	UNKNOWN
 36.4537  44.7068    3.3  16.6  150.6   1.3072   3.5 ------	UNKNOWN
 36.2596  55.4695    3.0   6.1  162.6   1.4445   3.8 ------	UNKNOWN
 24.8437  77.8700    2.4  17.4  -49.2   1.8848   4.9 ------	UNKNOWN
356.1527  11.4217    3.0  59.1 -166.1  10.7074   3.8 ------	UNKNOWN
339.0940  30.3813    4.1  49.9 -137.8   5.7403   2.8 ------	UNKNOWN
267.8779  69.6385    3.2  44.9  -60.0   7.7377   3.6 ------	UNKNOWN
327.9690  44.7895    3.3  43.8 -116.1   6.8935   3.5 ------	UNKNOWN
Plot creation:
Sat May 30 20:53:51 EDT 2015