Click here for the BAT GCN circular template
Image
Pre-slew 15.0-350.0 keV image (Event data)
#   RAcent    DECcent   POSerr    Theta     Phi              Peak Cts       SNR   Name
  150.0634    18.2840   0.0099    41.3190    13.0057         3.3234719     19.511 TRIG_00510649

Foreground time interval of the image:
-12.820  40.573 (delta_t =  53.393 [sec])
Background time interval of the image:
-239.328 -12.820 (delta_t = 226.508 [sec])
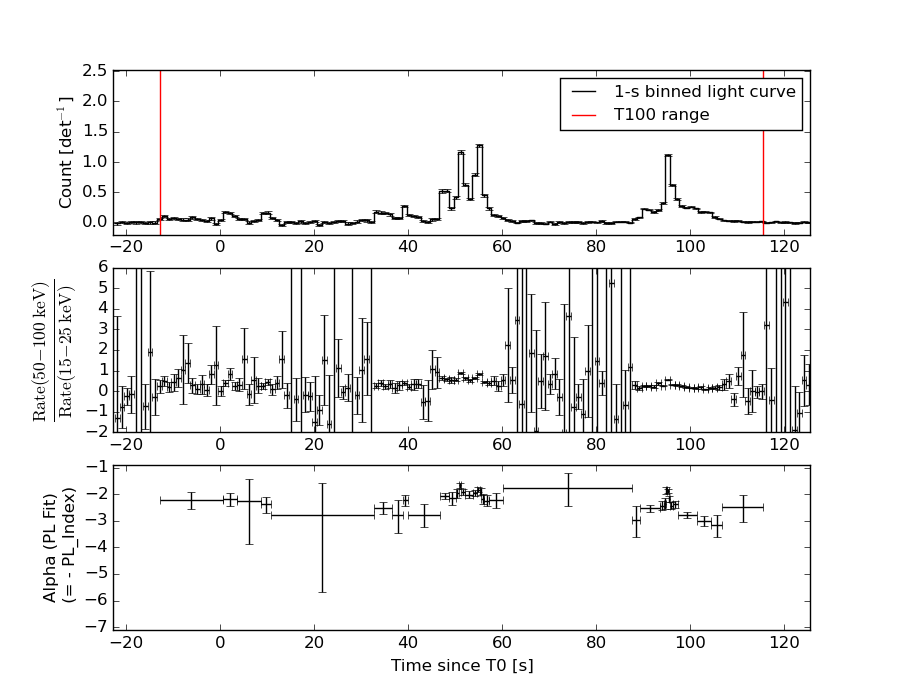
Lightcurves
Notes:
- 1) The mask-weighted light curves are using the flight position.
- 2) Multiple plots of different time binning/intervals are shown to cover all scenarios of short/long GRBs, rate/image triggers, and real/false positives.
- 3) For all the mask-weighted lightcurves, the y-axis units are counts/sec/det where a det is 0.4 x 0.4 = 0.16 sq cm.
- 4) The verticle lines correspond to following: green dotted lines are T50 interval, black dotted lines are T90 interval, blue solid line(s) is a spacecraft slew start time, and orange solid line(s) is a spacecraft slew end time.
- 5) Time of each bin is in the middle of the bin.
1 s binning
From T0-310 s to T0+310 s

From T100_start - 20 s to T100_end + 30 s
Full time interval
64 ms binning
Full time interval
From T100_start to T100_end
From T0-5 sec to T0+5 sec

16 ms binning
From T100_start-5 s to T100_start+5 s
Blue+Cyan dotted lines: Time interval of the scaled map
From 0.000000 to 4.096000
8 ms binning
From T100_start-3 s to T100_start+3 s

Blue+Cyan dotted lines: Time interval of the scaled map
From 0.000000 to 4.096000
2 ms binning
From T100_start-1 s to T100_start+1 s
Blue+Cyan dotted lines: Time interval of the scaled map
From 0.000000 to 4.096000
SN=5 or 10 sec. binning (whichever binning is satisfied first)
SN=5 or 10 sec. binning (T < 200 sec)
Quad-rate summed light curves (from T0-300s to T0+1000s)
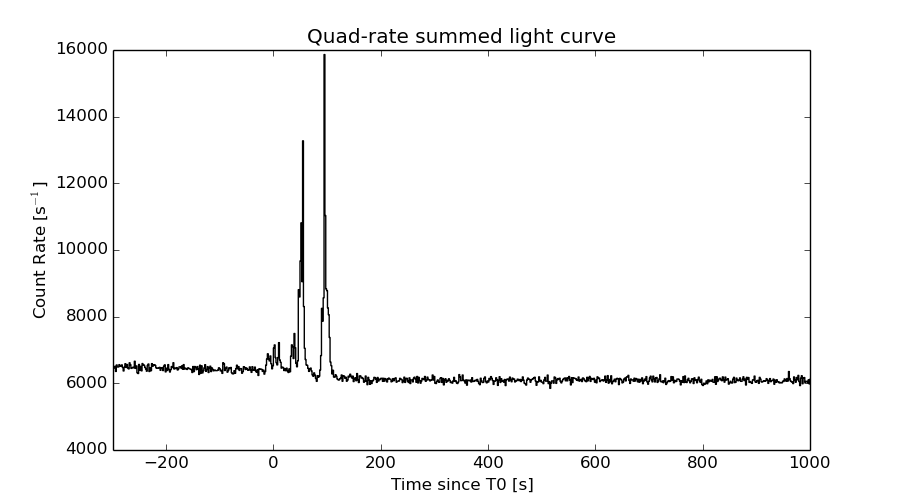
The mask-weighted light curves based on cleaned DPHs

Spectral Evolution
Spectra
Notes:
- 1) The fitting includes the systematic errors.
- 2) When the burst includes telescope slew time periods, the fitting uses an average response file made from multiple 5-s response files through out the slew time plus single time preiod for the non-slew times, and weighted by the total counts in the corresponding time period using addrmf. An average response file is needed becuase a spectral fit using the pre-slew DRM will introduce some errors in both a spectral shape and a normalization if the PHA file contains a lot of the slew/post-slew time interval.
- 3) For fits to more complicated models (e.g. a power-law over a cutoff power-law), the BAT team has decided to require a chi-square improvement of more than 6 for each extra dof.
Time averaged spectrum fit using the average DRM
Power-law model

Time interval is from  -12.820 sec. to  115.428 sec.

Spectral model in power-law:
------------------------------------------------------------
Parameters  : value       lower 90%   higher 90%
Photon index: 2.22061     ( -0.0613036   0.0620512 )
Norm@50keV  : 6.84058E-03    ( -0.000212105   0.000210881 )
------------------------------------------------------------
#Fit statistic : Chi-Squared =          59.68 using 59 PHA bins.
# Reduced chi-squared =          1.047 for     57 degrees of freedom
# Null hypothesis probability =   3.783704e-01

Photon flux (15-150 keV)    in 128.2 sec: 1.14490 ( -0.0372663  0.0375815 ) ph/cm2/s
Energy fluence (15-150 keV)             : 8.27002e-06 ( -2.29319e-07  2.29697e-07 ) ergs/cm2
Cutoff power-law model

Time interval is from  -12.820 sec. to  115.428 sec.
Spectral model in the cutoff power-law:
------------------------------------------------------------
Parameters  : value       lower 90%   higher 90%
Photon index: 1.99397     ( -1.99397   -1.99397 )
Epeak [keV] : 1.34765      ( -0.310627 0.554126 )
Norm@50keV  : 8.79318E-03    ( -0.000377227   0.000564291 )
------------------------------------------------------------
#Fit statistic : Chi-Squared =          61.60 using 59 PHA bins.
# Reduced chi-squared =          1.100 for     56 degrees of freedom
# Null hypothesis probability =   2.826491e-01

Photon flux (15-150 keV)    in 128.2 sec: 1.14073 ( -0.04531  0.04098 ) ph/cm2/s
Energy fluence (15-150 keV)             : 8.23238e-06 ( -2.79617e-07  2.64784e-07 ) ergs/cm2
Band function
Time interval is from  -12.820 sec. to  115.428 sec.

Spectral model in the Band function:
------------------------------------------------------------
Parameters  : value       lower 90%   higher 90%
alpha       : -1.62555   ( 1.62552   1.62552 )
beta        : -2.22357    ( 2.22357   0.06313 )
Epeak [keV] : 13.6940      ( -13.6942 71.7858 )
Norm@50keV   : 2.03975E-02    ( -0.0113284   0 )
------------------------------------------------------------
#Fit statistic : Chi-Squared =          59.63 using 59 PHA bins.
# Reduced chi-squared =          1.084 for     55 degrees of freedom
# Null hypothesis probability =   3.112137e-01

Photon flux (15-150 keV)    in 128.2 sec:  (    ) ph/cm2/s
Energy fluence (15-150 keV)             : 0 ( 0  0 ) ergs/cm2
Single BB
Spectral model blackbody:
------------------------------------------------------------
Parameters  : value    Lower 90%  Upper 90%
kT [keV]    : 10.9423  (  )
R^2/D10^2   : 0.317662  (   )
(R is the radius in km and D10 is the distance to the source in units of 10 kpc)
------------------------------------------------------------
#Fit statistic : Chi-Squared =         383.96 using 59 PHA bins.
# Reduced chi-squared =         6.7361 for     57 degrees of freedom
# Null hypothesis probability =   5.276477e-50

Energy  Fluence     90% Error
[keV]   [erg/cm2]   [erg/cm2]
15- 25  1.018e-06   5.660e-08
25- 50  2.858e-06   9.230e-08
50-150  1.925e-06   1.282e-07
15-150  5.801e-06   1.711e-07
Thermal bremsstrahlung (OTTB)
Spectral model: thermal bremsstrahlung
------------------------------------------------------------
Parameters  : value         Lower 90%    Upper 90%
kT [keV]    : 58.8867       (-4.84633      5.51728)
Norm        : 5.60795       (-0.327683     0.354005)
------------------------------------------------------------
#Fit statistic : Chi-Squared =          91.04 using 59 PHA bins.
# Reduced chi-squared =          1.597 for     57 degrees of freedom
# Null hypothesis probability =   2.797678e-03

Energy  Fluence     90% Error
[keV]   [erg/cm2]   [erg/cm2]
15- 25  1.801e-06   8.974e-08
25- 50  2.726e-06   8.397e-08
50-150  3.053e-06   1.897e-07
15-150  7.580e-06   2.288e-07
Double BB

Spectral model: bbodyrad<1> + bbodyrad<2>
------------------------------------------------------------
Parameters  : value         Lower 90%    Upper 90%
kT1 [keV]   : 5.30411        (-0.464827      0.5023)
R1^2/D10^2  : 4.61420        (-1.48996      2.38351)
kT2 [keV]   : 18.9617        (-1.54224      1.87407)
R2^2/D10^2  : 2.78848E-02    (-0.00899387   0.0118805)
------------------------------------------------------------
#Fit statistic : Chi-Squared =          67.59 using 59 PHA bins.
# Reduced chi-squared =          1.229 for     55 degrees of freedom
# Null hypothesis probability =   1.185582e-01

Energy  Fluence     90% Error
[keV]   [erg/cm2]   [erg/cm2]
15- 25  2.064e-06   2.186e-07
25- 50  2.579e-06   1.551e-07
50-150  3.281e-06   2.551e-07
15-150  7.924e-06   4.846e-07
Peak spectrum fit
Power-law model

Time interval is from   54.556 sec. to   55.556 sec.

Spectral model in power-law:
------------------------------------------------------------
Parameters  : value       lower 90%   higher 90%
Photon index: 1.83354     ( -0.0747641   0.0755567 )
Norm@50keV  : 8.76024E-02    ( -0.00373315   0.0037189 )
------------------------------------------------------------
#Fit statistic : Chi-Squared =          53.62 using 59 PHA bins.
# Reduced chi-squared =         0.9407 for     57 degrees of freedom
# Null hypothesis probability =   6.025669e-01

Photon flux (15-150 keV)    in 1 sec: 12.2320 ( -0.53429  0.535815 ) ph/cm2/s
Energy fluence (15-150 keV)             : 8.05712e-07 ( -3.4632e-08  3.47176e-08 ) ergs/cm2
Cutoff power-law model

Time interval is from   54.556 sec. to   55.556 sec.
Spectral model in the cutoff power-law:
------------------------------------------------------------
Parameters  : value       lower 90%   higher 90%
Photon index: 1.64395     ( -0.295883   0.241192 )
Epeak [keV] : 93.7143      ( -34.0459 -93.7145 )
Norm@50keV  : 0.109152    ( -0.0241208   0.043464 )
------------------------------------------------------------
#Fit statistic : Chi-Squared =          52.28 using 59 PHA bins.
# Reduced chi-squared =         0.9337 for     56 degrees of freedom
# Null hypothesis probability =   6.162964e-01

Photon flux (15-150 keV)    in 1 sec: 12.0886 ( -0.5705  0.5721 ) ph/cm2/s
Energy fluence (15-150 keV)             : 7.95394e-07 ( -3.8188e-08  3.801e-08 ) ergs/cm2
Band function

Time interval is from   54.556 sec. to   55.556 sec.

Spectral model in the Band function:
------------------------------------------------------------
Parameters  : value       lower 90%   higher 90%
alpha       : -0.410718   ( -0.994616   0.954275 )
beta        : -1.92246    ( -0.144926   0.112657 )
Epeak [keV] : 34.7136      ( -17.9674 113.183 )
Norm@50keV   : 0.758209    ( -0.633342   7920.75 )
------------------------------------------------------------
#Fit statistic : Chi-Squared =          49.81 using 59 PHA bins.
# Reduced chi-squared =         0.9057 for     55 degrees of freedom
# Null hypothesis probability =   6.725742e-01

Photon flux (15-150 keV)    in 1 sec:  (    ) ph/cm2/s
Energy fluence (15-150 keV)             : 7.90482e-07 ( 0  0 ) ergs/cm2
Single BB
Spectral model blackbody:
------------------------------------------------------------
Parameters  : value    Lower 90%  Upper 90%
kT [keV]    : 12.7741  (  )
R^2/D10^2   : 2.21924  (   )
(R is the radius in km and D10 is the distance to the source in units of 10 kpc)
------------------------------------------------------------
#Fit statistic : Chi-Squared =         215.74 using 59 PHA bins.
# Reduced chi-squared =         3.7849 for     57 degrees of freedom
# Null hypothesis probability =   2.662363e-20

Energy  Fluence     90% Error
[keV]   [erg/cm2]   [erg/cm2]
15- 25  7.681e-08   6.385e-09
25- 50  2.595e-07   1.215e-08
50-150  2.650e-07   2.465e-08
15-150  6.013e-07   2.645e-08
Thermal bremsstrahlung (OTTB)
Spectral model: thermal bremsstrahlung
------------------------------------------------------------
Parameters  : value         Lower 90%    Upper 90%
kT [keV]    : 99.9635       (-10.1413      27.4876)
Norm        : 53.3394       (-4.34046     2.74831)
------------------------------------------------------------
#Fit statistic : Chi-Squared =          56.26 using 59 PHA bins.
# Reduced chi-squared =         0.9871 for     57 degrees of freedom
# Null hypothesis probability =   5.027165e-01

Energy  Fluence     90% Error
[keV]   [erg/cm2]   [erg/cm2]
15- 25  1.394e-07   1.165e-08
25- 50  2.411e-07   1.235e-08
50-150  3.906e-07   9.975e-08
15-150  7.710e-07   1.064e-07
Double BB

Spectral model: bbodyrad<1> + bbodyrad<2>
------------------------------------------------------------
Parameters  : value         Lower 90%    Upper 90%
kT1 [keV]   : 6.79309        (-0.72935      0.777431)
R1^2/D10^2  : 17.0084        (-5.46562      8.88207)
kT2 [keV]   : 25.2962        (-3.16768      4.38596)
R2^2/D10^2  : 0.130745    (-0.0584037   0.0885823)
------------------------------------------------------------
#Fit statistic : Chi-Squared =          49.95 using 59 PHA bins.
# Reduced chi-squared =         0.9081 for     55 degrees of freedom
# Null hypothesis probability =   6.676182e-01

Energy  Fluence     90% Error
[keV]   [erg/cm2]   [erg/cm2]
15- 25  1.365e-07   1.695e-08
25- 50  2.401e-07   2.210e-08
50-150  4.138e-07   6.540e-08
15-150  7.904e-07   8.490e-08
Pre-slew spectrum (Pre-slew PHA with pre-slew DRM)
Power-law model

Spectral model in power-law:
------------------------------------------------------------
Parameters  : value       lower 90%   higher 90%
Photon index: 2.40402     ( -0.16817   0.178201 )
Norm@50keV  : 3.16045E-03    ( -0.00036245   0.000354875 )
------------------------------------------------------------
#Fit statistic : Chi-Squared =          59.75 using 59 PHA bins.
# Reduced chi-squared =          1.048 for     57 degrees of freedom
# Null hypothesis probability =   3.761891e-01

Photon flux (15-150 keV)    in 53.39 sec: 0.586142 ( -0.0446645  0.0447695 ) ph/cm2/s
Energy fluence (15-150 keV)             : 1.64748e-06 ( -1.43157e-07  1.45637e-07 ) ergs/cm2
Cutoff power-law model

Spectral model in the cutoff power-law:
------------------------------------------------------------
Parameters  : value       lower 90%   higher 90%
Photon index: 1.98621     (     )
Epeak [keV] : 1.45318      ( -0.507015 18.4725 )
Norm@50keV  : 5.35955E-03    (     )
------------------------------------------------------------
#Fit statistic : Chi-Squared =          61.57 using 59 PHA bins.
# Reduced chi-squared =          1.099 for     56 degrees of freedom
# Null hypothesis probability =   2.835204e-01

Photon flux (15-150 keV)    in 53.39 sec: 0.585865 (    ) ph/cm2/s
Energy fluence (15-150 keV)             : 1.64623e-06 ( -1.57661e-07  1.46801e-07 ) ergs/cm2
Band function
Spectral model in the Band function:
------------------------------------------------------------
Parameters  : value       lower 90%   higher 90%
alpha       : -2.33289   ( 2.33289   2.33289 )
beta        : -2.40402    ( -0.178203   0.168225 )
Epeak [keV] : 25.4223      ( -25.4223 -25.4223 )
Norm@50keV   : 0.429551    ( -0.0492624   0.0482322 )
------------------------------------------------------------
#Fit statistic : Chi-Squared =          59.75 using 59 PHA bins.
# Reduced chi-squared =          1.086 for     55 degrees of freedom
# Null hypothesis probability =   3.073479e-01

Photon flux (15-150 keV)    in 53.39 sec:  (    ) ph/cm2/s
Energy fluence (15-150 keV)             : 0 ( 0  0 ) ergs/cm2
S(25-50 keV) vs. S(50-100 keV) plot
S(25-50 keV)  = 2.63e-06
S(50-100 keV) = 2.26e-06
T90 vs. Hardness ratio plot
T90                                   = 101.243999898434 sec.
Hardness ratio (energy fluence ratio) = 0.859316
Color vs. Color plot
Count Ratio  (25-50 keV) / (15-25 keV) = 0.871388
Count Ratio (50-100 keV) / (15-25 keV) = 0.435974
Mask shadow pattern

IMX = 8.565586181937285E-01, IMY = -1.978418512008792E-01
TIME vs. PHA plot around the trigger time
Blue+Cyan dotted lines: Time interval of the scaled map
From 0.000000 to 4.096000
TIME vs. DetID plot around the trigger time
Blue+Cyan dotted lines: Time interval of the scaled map
From 0.000000 to 4.096000
100 us light curve (15-350 keV)
Blue+Cyan dotted lines: Time interval of the scaled map
From 0.000000 to 4.096000
Spacecraft aspect plot
Bright source in the pre-burst/pre-slew/post-slew images
Pre-burst image of 15-350 keV band
Time interval of the image:
-239.328000 -12.820000

# RAcent  DECcent POSerr Theta    Phi  PeakCts   SNR AngSep     Name
#  [deg]    [deg]    ['] [deg]  [deg]                   [']
 83.6410  22.0135    0.3  26.7  145.6   9.2785  34.0    0.4	Crab
127.8268  78.3131    2.8  40.8  -88.1   4.8447   4.2 ------	UNKNOWN
Pre-slew background subtracted image of 15-350 keV band
Time interval of the image:
-12.820000 40.572590

# RAcent  DECcent POSerr Theta    Phi  PeakCts   SNR AngSep     Name
#  [deg]    [deg]    ['] [deg]  [deg]                   [']
 83.5589  22.1247   12.5  26.7  145.9   0.1111   0.9    7.8	Crab
 63.4992   8.2395    2.1  50.3  151.2   2.5296   5.6 ------	UNKNOWN
150.0634  18.2840    0.6  41.3   13.0   3.3234  19.5 ------	UNKNOWN
Post-slew image of 15-350 keV band
Time interval of the image:
132.972600 962.732800

# RAcent  DECcent POSerr Theta    Phi  PeakCts   SNR AngSep     Name
#  [deg]    [deg]    ['] [deg]  [deg]                   [']
131.7109 -30.4594    3.0  51.8    5.0   5.5424   3.9 ------	UNKNOWN
Plot creation:
Sat May 30 20:48:24 EDT 2015