Click here for the BAT GCN circular template
Image
Pre-slew 15.0-350.0 keV image (Event data)
#   RAcent    DECcent   POSerr    Theta     Phi              Peak Cts       SNR   Name
   76.6117   -84.7042   0.0268    30.3790    -0.1810         0.3303993      7.195 TRIG_00510736

Foreground time interval of the image:
 -0.972  11.901 (delta_t =  12.873 [sec])
Background time interval of the image:
-239.000  -0.972 (delta_t = 238.028 [sec])
Lightcurves
Notes:
- 1) The mask-weighted light curves are using the flight position.
- 2) Multiple plots of different time binning/intervals are shown to cover all scenarios of short/long GRBs, rate/image triggers, and real/false positives.
- 3) For all the mask-weighted lightcurves, the y-axis units are counts/sec/det where a det is 0.4 x 0.4 = 0.16 sq cm.
- 4) The verticle lines correspond to following: green dotted lines are T50 interval, black dotted lines are T90 interval, blue solid line(s) is a spacecraft slew start time, and orange solid line(s) is a spacecraft slew end time.
- 5) Time of each bin is in the middle of the bin.
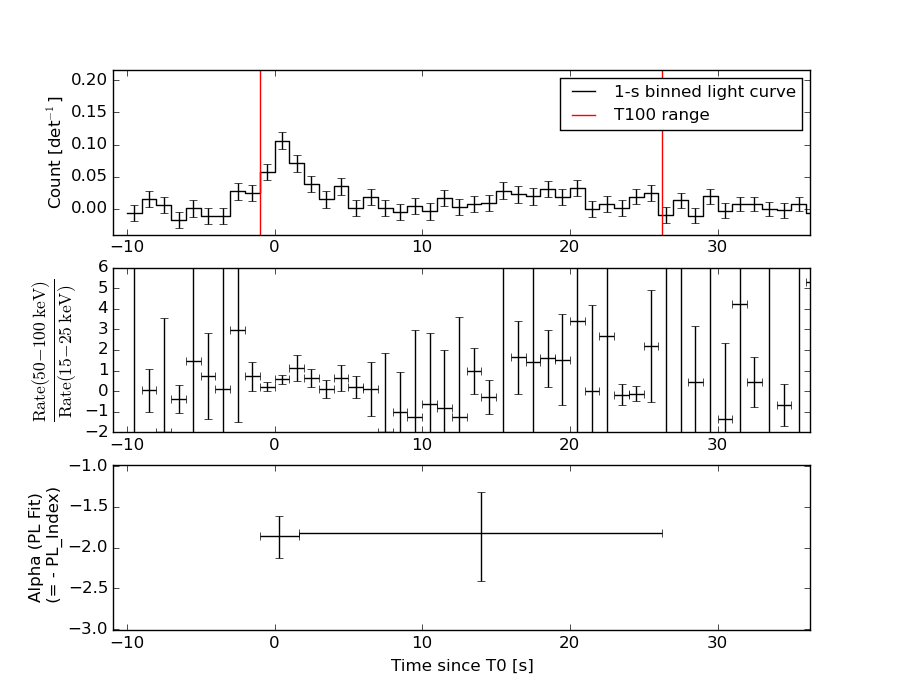
1 s binning
From T0-310 s to T0+310 s
From T100_start - 20 s to T100_end + 30 s
Full time interval
64 ms binning
Full time interval
From T100_start to T100_end

From T0-5 sec to T0+5 sec
16 ms binning
From T100_start-5 s to T100_start+5 s

Blue+Cyan dotted lines: Time interval of the scaled map
From 0.000000 to 1.024000
8 ms binning
From T100_start-3 s to T100_start+3 s

Blue+Cyan dotted lines: Time interval of the scaled map
From 0.000000 to 1.024000
2 ms binning
From T100_start-1 s to T100_start+1 s
Blue+Cyan dotted lines: Time interval of the scaled map
From 0.000000 to 1.024000
SN=5 or 10 sec. binning (whichever binning is satisfied first)

SN=5 or 10 sec. binning (T < 200 sec)
Quad-rate summed light curves (from T0-300s to T0+1000s)

The mask-weighted light curves based on cleaned DPHs

Spectral Evolution
Spectra
Notes:
- 1) The fitting includes the systematic errors.
- 2) When the burst includes telescope slew time periods, the fitting uses an average response file made from multiple 5-s response files through out the slew time plus single time preiod for the non-slew times, and weighted by the total counts in the corresponding time period using addrmf. An average response file is needed becuase a spectral fit using the pre-slew DRM will introduce some errors in both a spectral shape and a normalization if the PHA file contains a lot of the slew/post-slew time interval.
- 3) For fits to more complicated models (e.g. a power-law over a cutoff power-law), the BAT team has decided to require a chi-square improvement of more than 6 for each extra dof.
Time averaged spectrum fit using the average DRM
Power-law model
Time interval is from   -0.972 sec. to   26.260 sec.

Spectral model in power-law:
------------------------------------------------------------
Parameters  : value       lower 90%   higher 90%
Photon index: 1.83262     ( -0.317734   0.342637 )
Norm@50keV  : 1.34065E-03    ( -0.00028331   0.000271607 )
------------------------------------------------------------
#Fit statistic : Chi-Squared =          48.99 using 59 PHA bins.
# Reduced chi-squared =         0.8595 for     57 degrees of freedom
# Null hypothesis probability =   7.658039e-01

Photon flux (15-150 keV)    in 27.23 sec: 0.187127 ( -0.0324712  0.0324879 ) ph/cm2/s
Energy fluence (15-150 keV)             : 3.35765e-07 ( -6.94014e-08  7.13843e-08 ) ergs/cm2
Cutoff power-law model

Time interval is from   -0.972 sec. to   26.260 sec.
Spectral model in the cutoff power-law:
------------------------------------------------------------
Parameters  : value       lower 90%   higher 90%
Photon index: 1.81782     ( -1.23049   0.674577 )
Epeak [keV] : 535.695      (   )
Norm@50keV  : 1.36638E-03    ( -0.00136927   0.00525422 )
------------------------------------------------------------
#Fit statistic : Chi-Squared =          48.99 using 59 PHA bins.
# Reduced chi-squared =         0.8748 for     56 degrees of freedom
# Null hypothesis probability =   7.351641e-01

Photon flux (15-150 keV)    in 27.23 sec: 0.187051 ( -0.033477  0.032435 ) ph/cm2/s
Energy fluence (15-150 keV)             : 3.34515e-07 ( -7.5569e-08  7.21922e-08 ) ergs/cm2
Band function

Time interval is from   -0.972 sec. to   26.260 sec.

Spectral model in the Band function:
------------------------------------------------------------
Parameters  : value       lower 90%   higher 90%
alpha       : -2.90472   ( 3.28998   2.90472 )
beta        : -1.83262    ( -0.342637   0.317766 )
Epeak [keV] : 69.6206      ( -69.6206 -69.6206 )
Norm@50keV   : 0.182213    ( -0.0385058   0.0369154 )
------------------------------------------------------------
#Fit statistic : Chi-Squared =          48.99 using 59 PHA bins.
# Reduced chi-squared =         0.8908 for     55 degrees of freedom
# Null hypothesis probability =   7.022690e-01

Photon flux (15-150 keV)    in 27.23 sec: 0.187319 (    ) ph/cm2/s
Energy fluence (15-150 keV)             : 0 ( 0  0 ) ergs/cm2
Single BB
Spectral model blackbody:
------------------------------------------------------------
Parameters  : value    Lower 90%  Upper 90%
kT [keV]    : 11.5135  (-2.81118  3.65067)
R^2/D10^2   : 5.04414E-02  (-0.031791   0.0919744)
(R is the radius in km and D10 is the distance to the source in units of 10 kpc)
------------------------------------------------------------
#Fit statistic : Chi-Squared =          61.04 using 59 PHA bins.
# Reduced chi-squared =          1.071 for     57 degrees of freedom
# Null hypothesis probability =   3.330566e-01

Energy  Fluence     90% Error
[keV]   [erg/cm2]   [erg/cm2]
15- 25  3.833e-08   1.459e-08
25- 50  1.148e-07   3.460e-08
50-150  8.892e-08   3.642e-08
15-150  2.420e-07   6.825e-08
Thermal bremsstrahlung (OTTB)
Spectral model: thermal bremsstrahlung
------------------------------------------------------------
Parameters  : value         Lower 90%    Upper 90%
kT [keV]    : 98.7582       (-46.1202      -98.7582)
Norm        : 0.824985       (-0.17039     0.259663)
------------------------------------------------------------
#Fit statistic : Chi-Squared =          49.54 using 59 PHA bins.
# Reduced chi-squared =         0.8692 for     57 degrees of freedom
# Null hypothesis probability =   7.480516e-01

Energy  Fluence     90% Error
[keV]   [erg/cm2]   [erg/cm2]
15- 25  5.871e-08   1.430e-08
25- 50  1.013e-07   2.428e-08
50-150  1.629e-07   1.101e-07
15-150  3.229e-07   1.420e-07
Double BB
Spectral model: bbodyrad<1> + bbodyrad<2>
------------------------------------------------------------
Parameters  : value         Lower 90%    Upper 90%
kT1 [keV]   : 5.06167        (-2.10229      2.59334)
R1^2/D10^2  : 0.802845        (-0.63698      8.63746)
kT2 [keV]   : 21.1330        (-6.81266      16.732)
R2^2/D10^2  : 4.40826E-03    (-0.00374654   0.00712411)
------------------------------------------------------------
#Fit statistic : Chi-Squared =          48.45 using 59 PHA bins.
# Reduced chi-squared =         0.8809 for     55 degrees of freedom
# Null hypothesis probability =   7.214459e-01

Energy  Fluence     90% Error
[keV]   [erg/cm2]   [erg/cm2]
15- 25  6.593e-08   3.699e-08
25- 50  8.970e-08   4.858e-08
50-150  1.752e-07   1.055e-07
15-150  3.308e-07   1.754e-07
Peak spectrum fit
Power-law model

Time interval is from    0.120 sec. to    1.120 sec.

Spectral model in power-law:
------------------------------------------------------------
Parameters  : value       lower 90%   higher 90%
Photon index: 1.64863     ( -0.317629   0.333418 )
Norm@50keV  : 7.41028E-03    ( -0.00151282   0.00147495 )
------------------------------------------------------------
#Fit statistic : Chi-Squared =          43.25 using 59 PHA bins.
# Reduced chi-squared =         0.7587 for     57 degrees of freedom
# Null hypothesis probability =   9.107624e-01

Photon flux (15-150 keV)    in 1 sec: 0.967164 ( -0.180306  0.180462 ) ph/cm2/s
Energy fluence (15-150 keV)             : 6.8928e-08 ( -1.46914e-08  1.50018e-08 ) ergs/cm2
Cutoff power-law model
Time interval is from    0.120 sec. to    1.120 sec.
Spectral model in the cutoff power-law:
------------------------------------------------------------
Parameters  : value       lower 90%   higher 90%
Photon index: 1.38086     ( -1.49871   0.590239 )
Epeak [keV] : 108.560      ( -108.563 -108.563 )
Norm@50keV  : 1.03266E-02    (     )
------------------------------------------------------------
#Fit statistic : Chi-Squared =          43.10 using 59 PHA bins.
# Reduced chi-squared =         0.7696 for     56 degrees of freedom
# Null hypothesis probability =   8.967816e-01

Photon flux (15-150 keV)    in 1 sec: 0.958684 ( -0.184547  0.092076 ) ph/cm2/s
Energy fluence (15-150 keV)             : 6.74751e-08 ( -1.63358e-08  1.6061e-08 ) ergs/cm2
Band function

Time interval is from    0.120 sec. to    1.120 sec.

Spectral model in the Band function:
------------------------------------------------------------
Parameters  : value       lower 90%   higher 90%
alpha       : -0.995187   ( 0.996202   5.99462 )
beta        : -1.83808    ( 1.84292   0.493082 )
Epeak [keV] : 59.3419      ( -57.9794 -57.9794 )
Norm@50keV   : 1.81908E-02    ( -0.0188201   692.299 )
------------------------------------------------------------
#Fit statistic : Chi-Squared =          42.95 using 59 PHA bins.
# Reduced chi-squared =         0.7809 for     55 degrees of freedom
# Null hypothesis probability =   8.811445e-01

Photon flux (15-150 keV)    in 1 sec:  (    ) ph/cm2/s
Energy fluence (15-150 keV)             : 6.76739e-08 ( 0  0 ) ergs/cm2
Single BB
Spectral model blackbody:
------------------------------------------------------------
Parameters  : value    Lower 90%  Upper 90%
kT [keV]    : 12.4613  (-2.73923  3.69367)
R^2/D10^2   : 0.206563  (-0.125408   0.299944)
(R is the radius in km and D10 is the distance to the source in units of 10 kpc)
------------------------------------------------------------
#Fit statistic : Chi-Squared =          50.29 using 59 PHA bins.
# Reduced chi-squared =         0.8822 for     57 degrees of freedom
# Null hypothesis probability =   7.231759e-01

Energy  Fluence     90% Error
[keV]   [erg/cm2]   [erg/cm2]
15- 25  6.800e-09   2.685e-09
25- 50  2.235e-08   6.370e-09
50-150  2.138e-08   9.935e-09
15-150  5.053e-08   1.833e-08
Thermal bremsstrahlung (OTTB)

Spectral model: thermal bremsstrahlung
------------------------------------------------------------
Parameters  : value         Lower 90%    Upper 90%
kT [keV]    : 155.078       (-84.5504      -153.566)
Norm        : 3.99224       (-0.786372     1.1056)
------------------------------------------------------------
#Fit statistic : Chi-Squared =          43.11 using 59 PHA bins.
# Reduced chi-squared =         0.7564 for     57 degrees of freedom
# Null hypothesis probability =   9.131386e-01

Energy  Fluence     90% Error
[keV]   [erg/cm2]   [erg/cm2]
15- 25  1.022e-08   5.840e-09
25- 50  1.904e-08   1.057e-08
50-150  3.810e-08   2.335e-08
15-150  6.736e-08   3.859e-08
Double BB
Spectral model: bbodyrad<1> + bbodyrad<2>
------------------------------------------------------------
Parameters  : value         Lower 90%    Upper 90%
kT1 [keV]   : 7.40161        (-3.86985      4.17392)
R1^2/D10^2  : 0.972233        (-0.733168      1.16926)
kT2 [keV]   : 28.4918        (-18.8632      -28.5175)
R2^2/D10^2  : 7.69944E-03    (-0.00761409   0.0185779)
------------------------------------------------------------
#Fit statistic : Chi-Squared =          43.10 using 59 PHA bins.
# Reduced chi-squared =         0.7837 for     55 degrees of freedom
# Null hypothesis probability =   8.777055e-01

Energy  Fluence     90% Error
[keV]   [erg/cm2]   [erg/cm2]
15- 25  1.004e-08   5.855e-09
25- 50  1.984e-08   1.085e-08
50-150  3.833e-08   2.274e-08
15-150  6.822e-08   3.428e-08
Pre-slew spectrum (Pre-slew PHA with pre-slew DRM)
Power-law model
Spectral model in power-law:
------------------------------------------------------------
Parameters  : value       lower 90%   higher 90%
Photon index: 1.94320     ( -0.382779   0.423302 )
Norm@50keV  : 1.59808E-03    ( -0.000431521   0.00040884 )
------------------------------------------------------------
#Fit statistic : Chi-Squared =          46.18 using 59 PHA bins.
# Reduced chi-squared =         0.8101 for     57 degrees of freedom
# Null hypothesis probability =   8.467521e-01

Photon flux (15-150 keV)    in 12.87 sec: 0.233664 ( -0.0475493  0.0475531 ) ph/cm2/s
Energy fluence (15-150 keV)             : 1.89235e-07 ( -4.71455e-08  4.92102e-08 ) ergs/cm2
Cutoff power-law model

Spectral model in the cutoff power-law:
------------------------------------------------------------
Parameters  : value       lower 90%   higher 90%
Photon index: 1.94768     ( -1.36187   1.42591 )
Epeak [keV] : 383.406      (   )
Norm@50keV  : 1.58563E-03    (     )
------------------------------------------------------------
#Fit statistic : Chi-Squared =          46.18 using 59 PHA bins.
# Reduced chi-squared =         0.8246 for     56 degrees of freedom
# Null hypothesis probability =   8.223967e-01

Photon flux (15-150 keV)    in 12.87 sec: 0.233640 ( -0.047597  0.047511 ) ph/cm2/s
Energy fluence (15-150 keV)             : 1.88199e-07 ( -5.06846e-08  4.93873e-08 ) ergs/cm2
Band function

Spectral model in the Band function:
------------------------------------------------------------
Parameters  : value       lower 90%   higher 90%
alpha       : 4.69329   ( -4.69329   -4.69329 )
beta        : -2.07875    ( -0.602708   0.454179 )
Epeak [keV] : 22.0471      ( -22.0471 7.82845 )
Norm@50keV   : 328.451    ( -66.6142   2.63587e+06 )
------------------------------------------------------------
#Fit statistic : Chi-Squared =          45.83 using 59 PHA bins.
# Reduced chi-squared =         0.8332 for     55 degrees of freedom
# Null hypothesis probability =   8.062104e-01

Photon flux (15-150 keV)    in 12.87 sec:  (    ) ph/cm2/s
Energy fluence (15-150 keV)             : 0 ( 0  0 ) ergs/cm2
S(25-50 keV) vs. S(50-100 keV) plot

S(25-50 keV)  = 9.57e-08
S(50-100 keV) = 1.07e-07
T90 vs. Hardness ratio plot

T90                                   = 25.3719999194145 sec.
Hardness ratio (energy fluence ratio) = 1.11808
Color vs. Color plot

Count Ratio  (25-50 keV) / (15-25 keV) = 1.18439
Count Ratio (50-100 keV) / (15-25 keV) = 0.747285
Mask shadow pattern
IMX = 5.862015600200567E-01, IMY = 1.852211076233686E-03
TIME vs. PHA plot around the trigger time

Blue+Cyan dotted lines: Time interval of the scaled map
From 0.000000 to 1.024000
TIME vs. DetID plot around the trigger time
Blue+Cyan dotted lines: Time interval of the scaled map
From 0.000000 to 1.024000
100 us light curve (15-350 keV)

Blue+Cyan dotted lines: Time interval of the scaled map
From 0.000000 to 1.024000
Spacecraft aspect plot
Bright source in the pre-burst/pre-slew/post-slew images
Pre-burst image of 15-350 keV band
Time interval of the image:
-239.000000 -0.972000

# RAcent  DECcent POSerr Theta    Phi  PeakCts   SNR AngSep     Name
#  [deg]    [deg]    ['] [deg]  [deg]                   [']
170.2653 -60.6190    1.6  13.3   77.3   1.5193   7.0    1.5	Cen X-3
186.7263 -62.7563    1.3   5.2   75.2   1.8965   9.2    2.1	GX 301-2
171.3987 -24.2229    2.6  42.4  133.3   3.0626   4.4 ------	UNKNOWN
118.3039 -55.7435    2.4  38.8   53.2   2.6672   4.8 ------	UNKNOWN
124.3455 -60.9452    2.8  33.0   49.8   1.5236   4.1 ------	UNKNOWN
202.9550 -66.0706    2.3   3.9  -38.4   0.9405   5.0 ------	UNKNOWN
248.4784 -47.3543    1.9  31.5 -104.3   1.9377   6.0 ------	UNKNOWN
230.2174 -14.6761    2.3  53.0 -149.2   3.9125   5.0 ------	UNKNOWN
238.8153 -28.9058    2.5  42.8 -132.0   2.1561   4.5 ------	UNKNOWN
332.2565 -61.5810    3.2  51.0  -35.2   2.3430   3.6 ------	UNKNOWN
Pre-slew background subtracted image of 15-350 keV band
Time interval of the image:
-0.972000 11.900600

# RAcent  DECcent POSerr Theta    Phi  PeakCts   SNR AngSep     Name
#  [deg]    [deg]    ['] [deg]  [deg]                   [']
170.2867 -60.6119 1767.6  13.3   77.3   0.0002   0.0    1.1	Cen X-3
186.7170 -62.9384    4.7   5.2   73.2   0.0954   2.4   10.2	GX 301-2
 76.6121 -84.7043    1.6  30.4   -0.2   0.3304   7.2 ------	UNKNOWN
211.9591 -62.1576    2.4   6.4  -97.9   0.2003   4.9 ------	UNKNOWN
224.0994 -12.0924    2.3  53.9 -157.2   0.6268   4.9 ------	UNKNOWN
Post-slew image of 15-350 keV band
Time interval of the image:
67.300600 833.300650

# RAcent  DECcent POSerr Theta    Phi  PeakCts   SNR AngSep     Name
#  [deg]    [deg]    ['] [deg]  [deg]                   [']
170.1692 -60.6055    2.0  30.2  171.7   3.3236   5.9    4.4	Cen X-3
186.5867 -62.7756    1.2  29.5 -172.1   5.2455   9.7    1.9	GX 301-2
160.3639 -59.5240    2.2  30.4  161.8   3.3423   5.2 ------	UNKNOWN
280.2776 -57.6510    3.3  37.2  -90.3   4.7286   3.6 ------	UNKNOWN
Plot creation:
Sat May 30 20:46:32 EDT 2015