Special notes of this burst
Image
Pre-slew 15.0-350.0 keV image (Event data)
#   RAcent    DECcent   POSerr    Theta     Phi              Peak Cts       SNR   Name
  276.2237    24.7134   0.0032    29.5089   -27.3265         5.9343614     60.280 TRIG_00510922

Foreground time interval of the image:
  0.768  36.149 (delta_t =  35.381 [sec])
Background time interval of the image:
-170.851   0.768 (delta_t = 171.619 [sec])
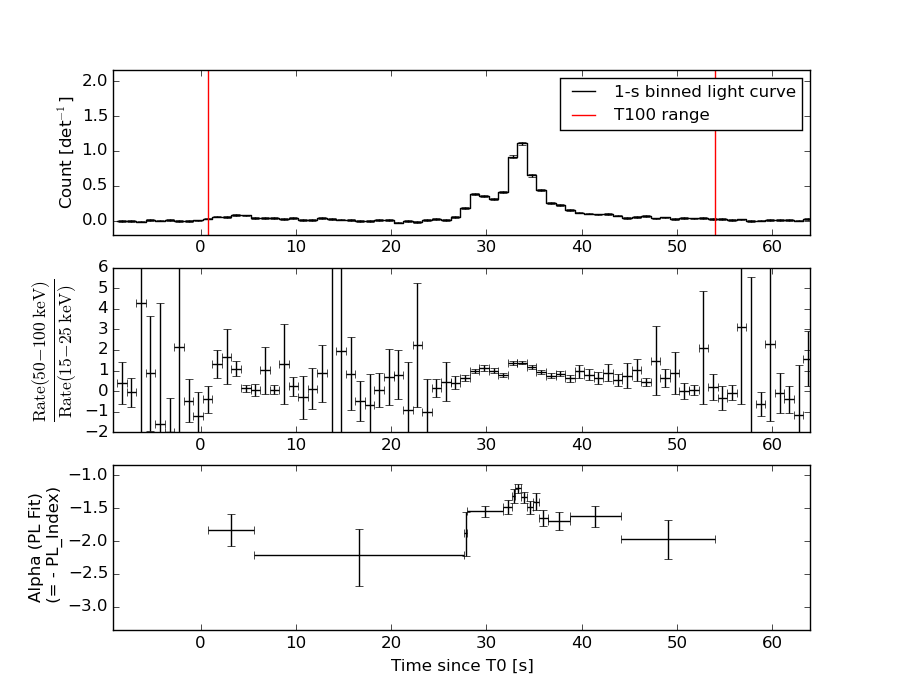
Lightcurves
Notes:
- 1) The mask-weighted light curves are using the flight position.
- 2) Multiple plots of different time binning/intervals are shown to cover all scenarios of short/long GRBs, rate/image triggers, and real/false positives.
- 3) For all the mask-weighted lightcurves, the y-axis units are counts/sec/det where a det is 0.4 x 0.4 = 0.16 sq cm.
- 4) The verticle lines correspond to following: green dotted lines are T50 interval, black dotted lines are T90 interval, blue solid line(s) is a spacecraft slew start time, and orange solid line(s) is a spacecraft slew end time.
- 5) Time of each bin is in the middle of the bin.
1 s binning
From T0-310 s to T0+310 s
From T100_start - 20 s to T100_end + 30 s
Full time interval
64 ms binning
Full time interval
From T100_start to T100_end
From T0-5 sec to T0+5 sec
16 ms binning
From T100_start-5 s to T100_start+5 s
Blue+Cyan dotted lines: Time interval of the scaled map
From 0.000000 to 4.096000
8 ms binning
From T100_start-3 s to T100_start+3 s
Blue+Cyan dotted lines: Time interval of the scaled map
From 0.000000 to 4.096000
2 ms binning
From T100_start-1 s to T100_start+1 s
Blue+Cyan dotted lines: Time interval of the scaled map
From 0.000000 to 4.096000
SN=5 or 10 sec. binning (whichever binning is satisfied first)
SN=5 or 10 sec. binning (T < 200 sec)
Quad-rate summed light curves (from T0-300s to T0+1000s)

The mask-weighted light curves based on cleaned DPHs

Spectral Evolution
Spectra
Notes:
- 1) The fitting includes the systematic errors.
- 2) When the burst includes telescope slew time periods, the fitting uses an average response file made from multiple 5-s response files through out the slew time plus single time preiod for the non-slew times, and weighted by the total counts in the corresponding time period using addrmf. An average response file is needed becuase a spectral fit using the pre-slew DRM will introduce some errors in both a spectral shape and a normalization if the PHA file contains a lot of the slew/post-slew time interval.
- 3) For fits to more complicated models (e.g. a power-law over a cutoff power-law), the BAT team has decided to require a chi-square improvement of more than 6 for each extra dof.
Time averaged spectrum fit using the average DRM
Power-law model
Time interval is from    0.768 sec. to   53.940 sec.

Spectral model in power-law:
------------------------------------------------------------
Parameters  : value       lower 90%   higher 90%
Photon index: 1.58977     ( -0.0523032   0.0523504 )
Norm@50keV  : 8.67504E-03    ( -0.000233633   0.000233562 )
------------------------------------------------------------
#Fit statistic : Chi-Squared =          55.99 using 59 PHA bins.
# Reduced chi-squared =         0.9823 for     57 degrees of freedom
# Null hypothesis probability =   5.128854e-01

Photon flux (15-150 keV)    in 53.17 sec: 1.11128 ( -0.0335082  0.0336824 ) ph/cm2/s
Energy fluence (15-150 keV)             : 4.31915e-06 ( -1.21806e-07  1.22059e-07 ) ergs/cm2
Cutoff power-law model

Time interval is from    0.768 sec. to   53.940 sec.
Spectral model in the cutoff power-law:
------------------------------------------------------------
Parameters  : value       lower 90%   higher 90%
Photon index: 1.58855     ( -0.0533209   0.0519758 )
Epeak [keV] : 9999.36      ( -9999.36 -9999.36 )
Norm@50keV  : 8.69375E-03    ( -0.000233956   0.00159871 )
------------------------------------------------------------
#Fit statistic : Chi-Squared =          56.01 using 59 PHA bins.
# Reduced chi-squared =          1.000 for     56 degrees of freedom
# Null hypothesis probability =   4.746390e-01

Photon flux (15-150 keV)    in 53.17 sec: 1.11135 ( -0.03387  0.03294 ) ph/cm2/s
Energy fluence (15-150 keV)             : 4.31835e-06 ( -1.18835e-07  1.21536e-07 ) ergs/cm2
Band function
Time interval is from    0.768 sec. to   53.940 sec.

Spectral model in the Band function:
------------------------------------------------------------
Parameters  : value       lower 90%   higher 90%
alpha       : 0.939928   ( -2.12488   -0.9403 )
beta        : -1.62495    ( -0.066052   0.0621273 )
Epeak [keV] : 29.9597      ( -7.56791 99.3477 )
Norm@50keV   : 0.600393    ( -0.601778   427.643 )
------------------------------------------------------------
#Fit statistic : Chi-Squared =          52.31 using 59 PHA bins.
# Reduced chi-squared =         0.9510 for     55 degrees of freedom
# Null hypothesis probability =   5.782244e-01

Photon flux (15-150 keV)    in 53.17 sec:  (    ) ph/cm2/s
Energy fluence (15-150 keV)             : 0 ( 0  0 ) ergs/cm2
Single BB
Spectral model blackbody:
------------------------------------------------------------
Parameters  : value    Lower 90%  Upper 90%
kT [keV]    : 15.7138  (  )
R^2/D10^2   : 9.87698E-02  (   )
(R is the radius in km and D10 is the distance to the source in units of 10 kpc)
------------------------------------------------------------
#Fit statistic : Chi-Squared =         427.25 using 59 PHA bins.
# Reduced chi-squared =         7.4956 for     57 degrees of freedom
# Null hypothesis probability =   3.896992e-58

Energy  Fluence     90% Error
[keV]   [erg/cm2]   [erg/cm2]
15- 25  2.692e-07   1.545e-08
25- 50  1.115e-06   4.121e-08
50-150  1.911e-06   9.464e-08
15-150  3.295e-06   1.061e-07
Thermal bremsstrahlung (OTTB)
Spectral model: thermal bremsstrahlung
------------------------------------------------------------
Parameters  : value         Lower 90%    Upper 90%
kT [keV]    : 200.000       (      )
Norm        : 4.45198       (-0.119686     0.119649)
------------------------------------------------------------
#Fit statistic : Chi-Squared =          64.95 using 59 PHA bins.
# Reduced chi-squared =          1.139 for     57 degrees of freedom
# Null hypothesis probability =   2.193443e-01

Energy  Fluence     90% Error
[keV]   [erg/cm2]   [erg/cm2]
15- 25  5.897e-07   1.675e-08
25- 50  1.134e-06   3.562e-08
50-150  2.487e-06   7.763e-08
15-150  4.211e-06   1.388e-07
Double BB
Spectral model: bbodyrad<1> + bbodyrad<2>
------------------------------------------------------------
Parameters  : value         Lower 90%    Upper 90%
kT1 [keV]   : 7.54783        (-0.567769      0.599137)
R1^2/D10^2  : 0.977824        (-0.230822      0.32022)
kT2 [keV]   : 31.3287        (-3.02799      3.91785)
R2^2/D10^2  : 7.13014E-03    (-0.0022942   0.00298546)
------------------------------------------------------------
#Fit statistic : Chi-Squared =          46.13 using 59 PHA bins.
# Reduced chi-squared =         0.8387 for     55 degrees of freedom
# Null hypothesis probability =   7.972809e-01

Energy  Fluence     90% Error
[keV]   [erg/cm2]   [erg/cm2]
15- 25  5.678e-07   5.078e-08
25- 50  1.162e-06   6.061e-08
50-150  2.595e-06   2.010e-07
15-150  4.325e-06   2.568e-07
Peak spectrum fit
Power-law model
Time interval is from   32.752 sec. to   33.752 sec.

Spectral model in power-law:
------------------------------------------------------------
Parameters  : value       lower 90%   higher 90%
Photon index: 1.22050     ( -0.0618537   0.0616772 )
Norm@50keV  : 8.66305E-02    ( -0.00291148   0.00291074 )
------------------------------------------------------------
#Fit statistic : Chi-Squared =          63.86 using 59 PHA bins.
# Reduced chi-squared =          1.120 for     57 degrees of freedom
# Null hypothesis probability =   2.480569e-01

Photon flux (15-150 keV)    in 1 sec: 10.1990 ( -0.360934  0.361662 ) ph/cm2/s
Energy fluence (15-150 keV)             : 8.739e-07 ( -3.19979e-08  3.20881e-08 ) ergs/cm2
Cutoff power-law model
Time interval is from   32.752 sec. to   33.752 sec.
Spectral model in the cutoff power-law:
------------------------------------------------------------
Parameters  : value       lower 90%   higher 90%
Photon index: 1.21607     ( -0.20739   0.0649608 )
Epeak [keV] : 1.00000E+04      (   )
Norm@50keV  : 8.70358E-02    ( -0.0029189   0.00291859 )
------------------------------------------------------------
#Fit statistic : Chi-Squared =          63.89 using 59 PHA bins.
# Reduced chi-squared =          1.141 for     56 degrees of freedom
# Null hypothesis probability =   2.191325e-01

Photon flux (15-150 keV)    in 1 sec: 10.1994 (    ) ph/cm2/s
Energy fluence (15-150 keV)             : 8.73687e-07 ( -3.1575e-08  1.6909e-08 ) ergs/cm2
Band function

Time interval is from   32.752 sec. to   33.752 sec.

Spectral model in the Band function:
------------------------------------------------------------
Parameters  : value       lower 90%   higher 90%
alpha       : 4.97953   ( -4.97953   -4.97953 )
beta        : -1.23714    ( -0.0645074   0.064166 )
Epeak [keV] : 23.0564      ( -23.0564 3.75577 )
Norm@50keV   : 1.10216E+04    ( -369.505   1.92755e+07 )
------------------------------------------------------------
#Fit statistic : Chi-Squared =          62.79 using 59 PHA bins.
# Reduced chi-squared =          1.142 for     55 degrees of freedom
# Null hypothesis probability =   2.198182e-01

Photon flux (15-150 keV)    in 1 sec:  (    ) ph/cm2/s
Energy fluence (15-150 keV)             : 0 ( 0  0 ) ergs/cm2
Single BB
Spectral model blackbody:
------------------------------------------------------------
Parameters  : value    Lower 90%  Upper 90%
kT [keV]    : 19.7293  (  )
R^2/D10^2   : 0.479572  (   )
(R is the radius in km and D10 is the distance to the source in units of 10 kpc)
------------------------------------------------------------
#Fit statistic : Chi-Squared =         273.76 using 59 PHA bins.
# Reduced chi-squared =         4.8028 for     57 degrees of freedom
# Null hypothesis probability =   4.376020e-30

Energy  Fluence     90% Error
[keV]   [erg/cm2]   [erg/cm2]
15- 25  3.618e-08   2.660e-09
25- 50  1.786e-07   8.550e-09
50-150  5.143e-07   2.945e-08
15-150  7.290e-07   2.905e-08
Thermal bremsstrahlung (OTTB)
Spectral model: thermal bremsstrahlung
------------------------------------------------------------
Parameters  : value         Lower 90%    Upper 90%
kT [keV]    : 199.363       (      )
Norm        : 42.7010       (     )
------------------------------------------------------------
#Fit statistic : Chi-Squared =         155.15 using 59 PHA bins.
# Reduced chi-squared =         2.7220 for     57 degrees of freedom
# Null hypothesis probability =   5.050612e-11

Energy  Fluence     90% Error
[keV]   [erg/cm2]   [erg/cm2]
15- 25  1.063e-07   3.800e-09
25- 50  2.045e-07   7.250e-09
50-150  4.486e-07   1.645e-08
15-150  7.595e-07   2.805e-08
Double BB
Spectral model: bbodyrad<1> + bbodyrad<2>
------------------------------------------------------------
Parameters  : value         Lower 90%    Upper 90%
kT1 [keV]   : 8.03082        (-1.01562      1.13714)
R1^2/D10^2  : 5.80790        (-1.9696      3.30642)
kT2 [keV]   : 35.3393        (-4.4126      6.62759)
R2^2/D10^2  : 6.19462E-02    (-0.0253562   0.0334171)
------------------------------------------------------------
#Fit statistic : Chi-Squared =          67.46 using 59 PHA bins.
# Reduced chi-squared =          1.226 for     55 degrees of freedom
# Null hypothesis probability =   1.208397e-01

Energy  Fluence     90% Error
[keV]   [erg/cm2]   [erg/cm2]
15- 25  7.881e-08   9.465e-09
25- 50  1.911e-07   1.650e-08
50-150  6.120e-07   6.700e-08
15-150  8.819e-07   7.630e-08
Pre-slew spectrum (Pre-slew PHA with pre-slew DRM)
Power-law model
Spectral model in power-law:
------------------------------------------------------------
Parameters  : value       lower 90%   higher 90%
Photon index: 1.53376     ( -0.0541583   0.0542096 )
Norm@50keV  : 1.02366E-02    ( -0.000289501   0.000289449 )
------------------------------------------------------------
#Fit statistic : Chi-Squared =          49.74 using 59 PHA bins.
# Reduced chi-squared =         0.8726 for     57 degrees of freedom
# Null hypothesis probability =   7.415348e-01

Photon flux (15-150 keV)    in 35.38 sec: 1.28988 ( -0.0403906  0.0405826 ) ph/cm2/s
Energy fluence (15-150 keV)             : 3.41761e-06 ( -1.0198e-07  1.02215e-07 ) ergs/cm2
Cutoff power-law model

Spectral model in the cutoff power-law:
------------------------------------------------------------
Parameters  : value       lower 90%   higher 90%
Photon index: 1.47478     ( -0.208074   0.0846953 )
Epeak [keV] : 483.747      ( -483.747 -483.747 )
Norm@50keV  : 1.09026E-02    ( -0.000898846   0.00262829 )
------------------------------------------------------------
#Fit statistic : Chi-Squared =          49.49 using 59 PHA bins.
# Reduced chi-squared =         0.8838 for     56 degrees of freedom
# Null hypothesis probability =   7.180379e-01

Photon flux (15-150 keV)    in 35.38 sec: 1.28407 ( -0.04443  0.04373 ) ph/cm2/s
Energy fluence (15-150 keV)             : 3.40523e-06 ( -1.12678e-07  1.10991e-07 ) ergs/cm2
Band function
Spectral model in the Band function:
------------------------------------------------------------
Parameters  : value       lower 90%   higher 90%
alpha       : 0.366598   ( -1.07975   -1.07975 )
beta        : -1.56335    ( -0.107192   0.0642494 )
Epeak [keV] : 32.7874      ( -29.4228 114.888 )
Norm@50keV   : 0.237887    ( -0.237203   580.409 )
------------------------------------------------------------
#Fit statistic : Chi-Squared =          47.54 using 59 PHA bins.
# Reduced chi-squared =         0.8644 for     55 degrees of freedom
# Null hypothesis probability =   7.522446e-01

Photon flux (15-150 keV)    in 35.38 sec:  (    ) ph/cm2/s
Energy fluence (15-150 keV)             : 0 ( 0  0 ) ergs/cm2
S(25-50 keV) vs. S(50-100 keV) plot
S(25-50 keV)  = 1.11e-06
S(50-100 keV) = 1.48e-06
T90 vs. Hardness ratio plot
T90                                   = 38.7080000042915 sec.
Hardness ratio (energy fluence ratio) = 1.33333
Color vs. Color plot
Count Ratio  (25-50 keV) / (15-25 keV) = 1.35843
Count Ratio (50-100 keV) / (15-25 keV) = 0.937822
Mask shadow pattern
IMX = 5.028183394531438E-01, IMY = 2.598187050693557E-01
TIME vs. PHA plot around the trigger time
Blue+Cyan dotted lines: Time interval of the scaled map
From 0.000000 to 4.096000
TIME vs. DetID plot around the trigger time
Blue+Cyan dotted lines: Time interval of the scaled map
From 0.000000 to 4.096000
100 us light curve (15-350 keV)
Blue+Cyan dotted lines: Time interval of the scaled map
From 0.000000 to 4.096000
Spacecraft aspect plot
Bright source in the pre-burst/pre-slew/post-slew images
Pre-burst image of 15-350 keV band
Time interval of the image:
-170.851400 0.768000

# RAcent  DECcent POSerr Theta    Phi  PeakCts   SNR AngSep     Name
#  [deg]    [deg]    ['] [deg]  [deg]                   [']
254.3714  35.2953    4.5  49.2  -12.8   0.8510   2.6    5.1	Her X-1
288.8029  10.9421    1.0  20.2  -65.8   2.1121  11.3    0.3	GRS 1915+105
299.6010  35.2056    0.3  17.1   24.0   5.6851  34.6    0.6	Cyg X-1
308.1198  40.9657    1.8  21.3   47.9   1.3556   6.3    0.9	Cyg X-3
326.4318  38.3054    0.0  24.7   84.1   0.3972   1.7   12.3	Cyg X-2
352.5469  16.8036    2.7  42.6  133.4   2.3548   4.3 ------	UNKNOWN
259.8029   7.3501    3.3  48.0  -51.0   2.6471   3.6 ------	UNKNOWN
Pre-slew background subtracted image of 15-350 keV band
Time interval of the image:
0.768000 36.148600

# RAcent  DECcent POSerr Theta    Phi  PeakCts   SNR AngSep     Name
#  [deg]    [deg]    ['] [deg]  [deg]                   [']
254.4835  35.4435    6.9  49.1  -12.6   0.3126   1.7    6.2	Her X-1
288.7759  11.1552    0.0  20.1  -65.2   0.3132   3.2   12.6	GRS 1915+105
299.8067  35.1803    5.3  17.0   24.4  -0.1914  -2.2   10.7	Cyg X-1
308.0918  40.9868   80.4  21.3   47.9   0.0148   0.1    2.2	Cyg X-3
326.2790  38.2142   45.8  24.5   84.1   0.0320   0.3    8.2	Cyg X-2
333.3791  20.9841    2.8  24.1  129.5   0.4665   4.2 ------	UNKNOWN
350.2908 -20.0273    3.3  57.6  178.2   2.2485   3.5 ------	UNKNOWN
276.2237  24.7134    0.2  29.5  -27.3   5.9343  60.3 ------	UNKNOWN
258.0705   9.2754    1.9  49.0  -47.8   2.4484   5.9 ------	UNKNOWN
Post-slew image of 15-350 keV band
Time interval of the image:
101.348600 962.428000

# RAcent  DECcent POSerr Theta    Phi  PeakCts   SNR AngSep     Name
#  [deg]    [deg]    ['] [deg]  [deg]                   [']
244.9612 -15.6312    1.6  50.5  -42.3  24.2019   7.3    1.2	Sco X-1
254.2720  35.3481    5.6  21.7   41.9   1.3251   2.0    9.1	Her X-1
268.3857  -1.4600    2.7  27.2  -65.4   3.4588   4.3    1.2	SW J1753.5-0127
274.0616 -14.1285    3.7  38.9  -79.3   7.0927   3.2    6.4	GX 17+2
288.7680  10.9370    0.8  18.2 -125.8   8.9995  14.5    1.9	GRS 1915+105
299.5915  35.2001    0.2  22.8  154.5  29.4400  48.8    0.1	Cyg X-1
308.1115  40.9575    1.1  31.1  148.1   8.1595  10.2    0.3	Cyg X-3
326.3103  38.3944    7.4  44.3  156.9   2.1268   1.6    7.8	Cyg X-2
226.2909  -7.5887    3.2  58.3  -19.6  11.6139   3.5 ------	UNKNOWN
230.3886 -11.5665    3.8  57.5  -26.3  10.8773   3.1 ------	UNKNOWN
Plot creation:
Sat May 30 20:44:38 EDT 2015