Click here for the BAT GCN circular template
Image
Pre-slew 15.0-350.0 keV image (Event data)

#   RAcent    DECcent   POSerr    Theta     Phi              Peak Cts       SNR   Name
   66.1305    64.0489   0.0089    28.9334    16.1265         1.3642821     21.684 TRIG_00511235

Foreground time interval of the image:
 -6.284  12.301 (delta_t =  18.585 [sec])
Background time interval of the image:
-748.599 -731.865 (delta_t =  16.734 [sec])
-239.000 -34.849 (delta_t = 204.151 [sec])
-34.000  -6.284 (delta_t =  27.716 [sec])
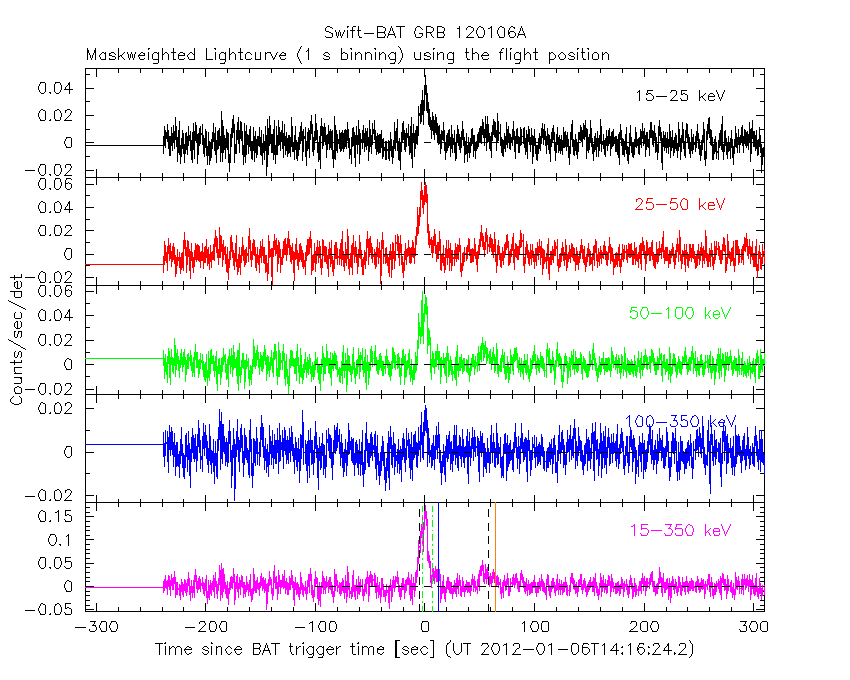
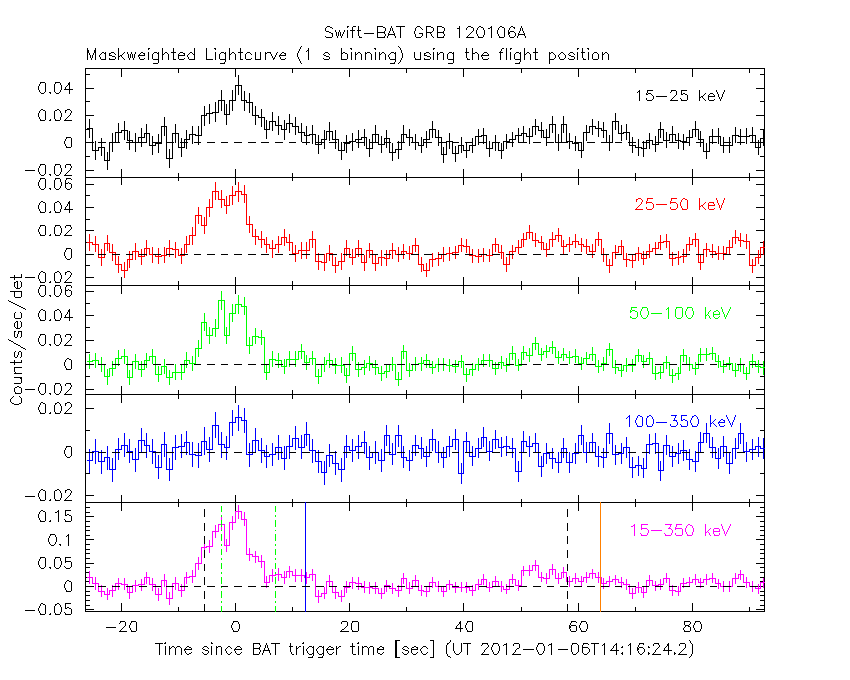
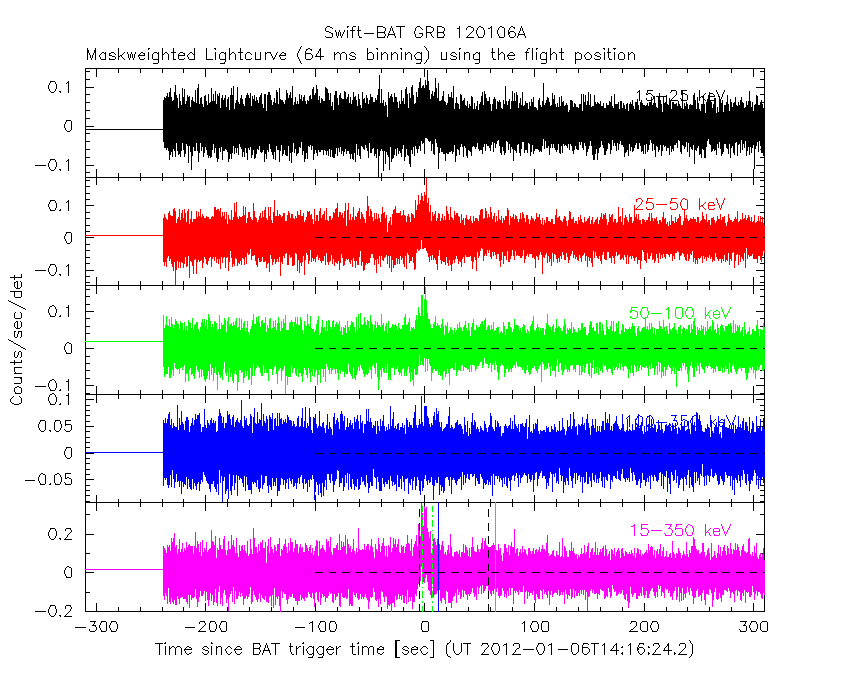
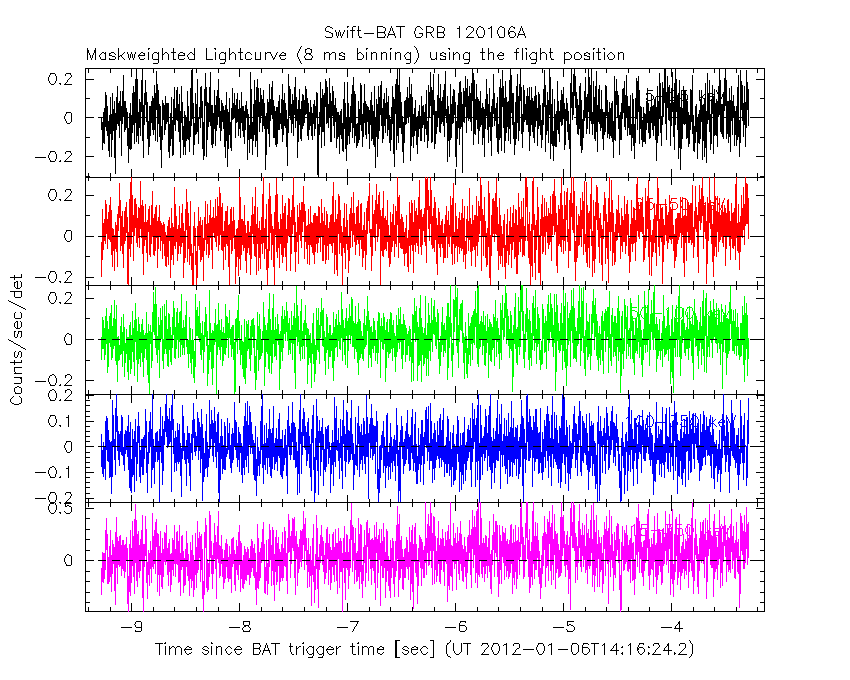
Lightcurves
Notes:
- 1) The mask-weighted light curves are using the flight position.
- 2) Multiple plots of different time binning/intervals are shown to cover all scenarios of short/long GRBs, rate/image triggers, and real/false positives.
- 3) For all the mask-weighted lightcurves, the y-axis units are counts/sec/det where a det is 0.4 x 0.4 = 0.16 sq cm.
- 4) The verticle lines correspond to following: green dotted lines are T50 interval, black dotted lines are T90 interval, blue solid line(s) is a spacecraft slew start time, and orange solid line(s) is a spacecraft slew end time.
- 5) Time of each bin is in the middle of the bin.
1 s binning
From T0-310 s to T0+310 s
From T100_start - 20 s to T100_end + 30 s
Full time interval

64 ms binning
Full time interval
From T100_start to T100_end

From T0-5 sec to T0+5 sec

16 ms binning
From T100_start-5 s to T100_start+5 s

Blue+Cyan dotted lines: Time interval of the scaled map
From 0.000000 to 1.024000
8 ms binning
From T100_start-3 s to T100_start+3 s
Blue+Cyan dotted lines: Time interval of the scaled map
From 0.000000 to 1.024000
2 ms binning
From T100_start-1 s to T100_start+1 s
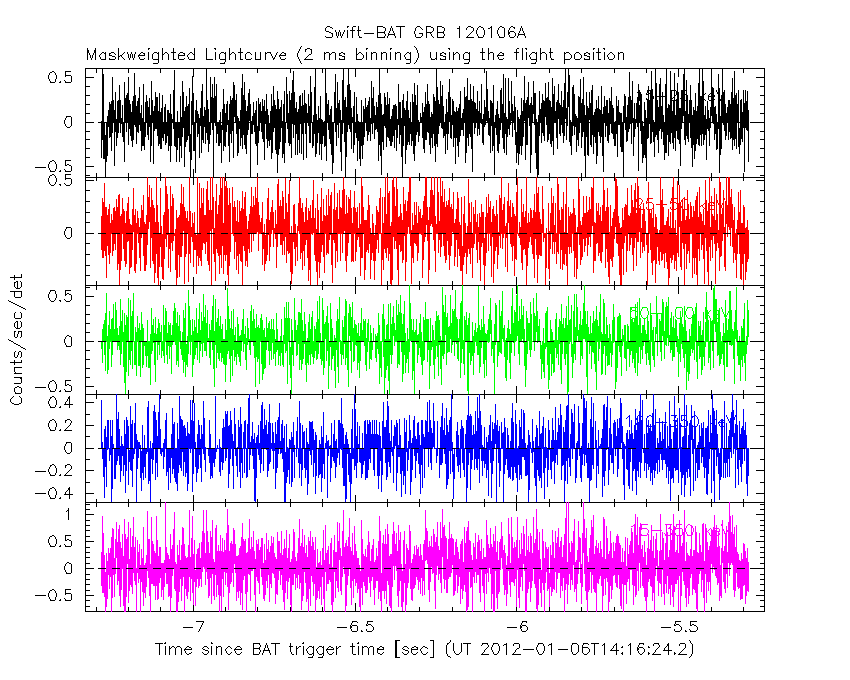
Blue+Cyan dotted lines: Time interval of the scaled map
From 0.000000 to 1.024000
SN=5 or 10 sec. binning (whichever binning is satisfied first)
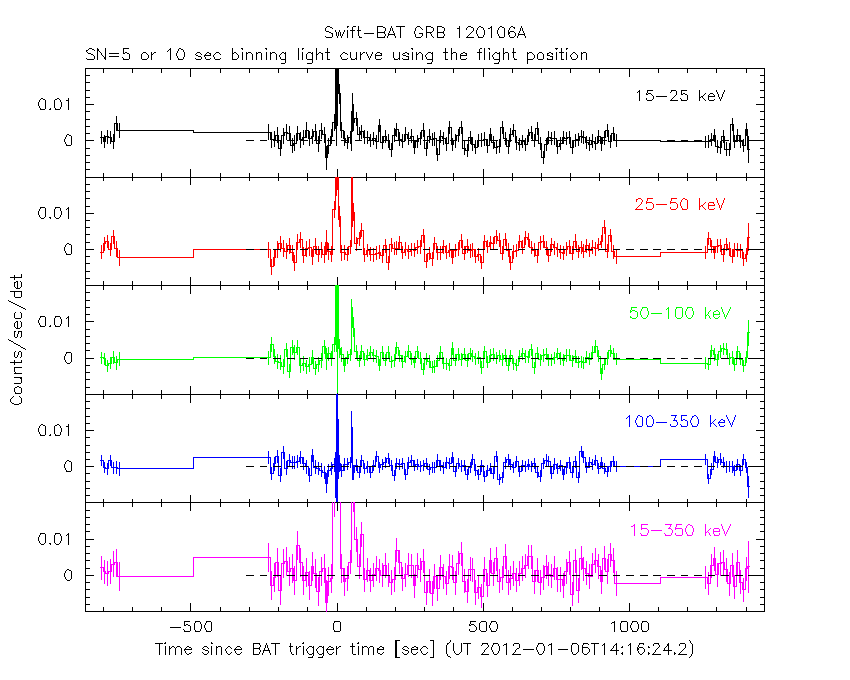
SN=5 or 10 sec. binning (T < 200 sec)

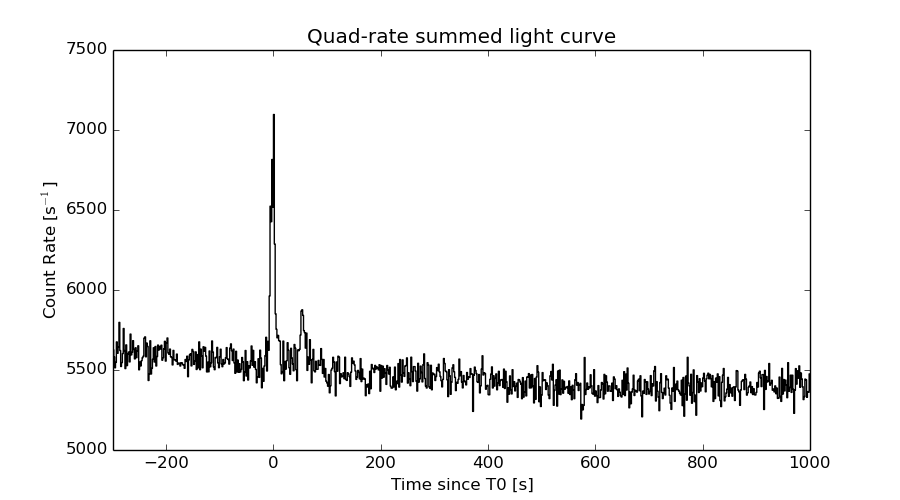
Quad-rate summed light curves (from T0-300s to T0+1000s)
The mask-weighted light curves based on cleaned DPHs

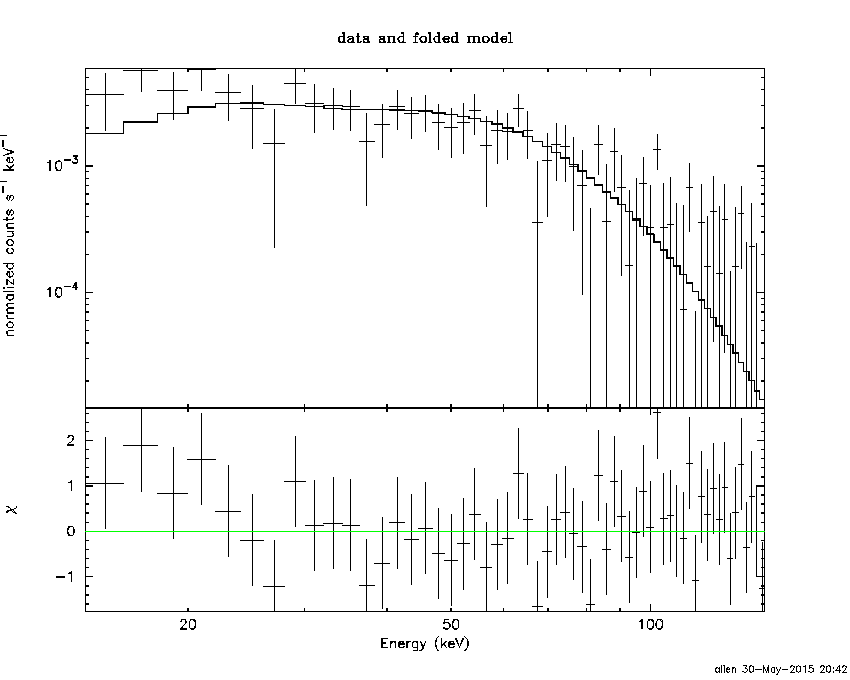
Spectral Evolution

Spectra
Notes:
- 1) The fitting includes the systematic errors.
- 2) When the burst includes telescope slew time periods, the fitting uses an average response file made from multiple 5-s response files through out the slew time plus single time preiod for the non-slew times, and weighted by the total counts in the corresponding time period using addrmf. An average response file is needed becuase a spectral fit using the pre-slew DRM will introduce some errors in both a spectral shape and a normalization if the PHA file contains a lot of the slew/post-slew time interval.
- 3) For fits to more complicated models (e.g. a power-law over a cutoff power-law), the BAT team has decided to require a chi-square improvement of more than 6 for each extra dof.
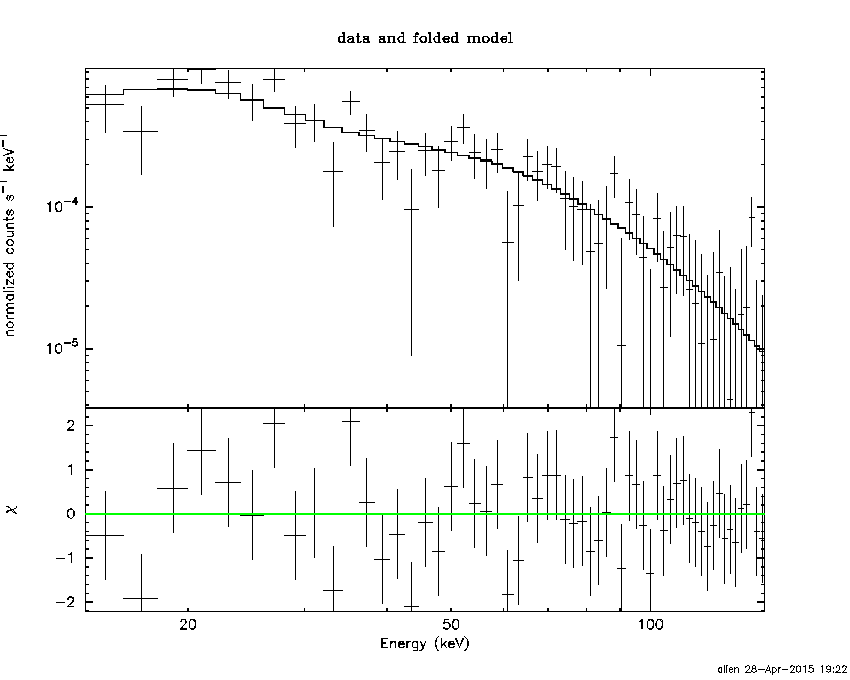
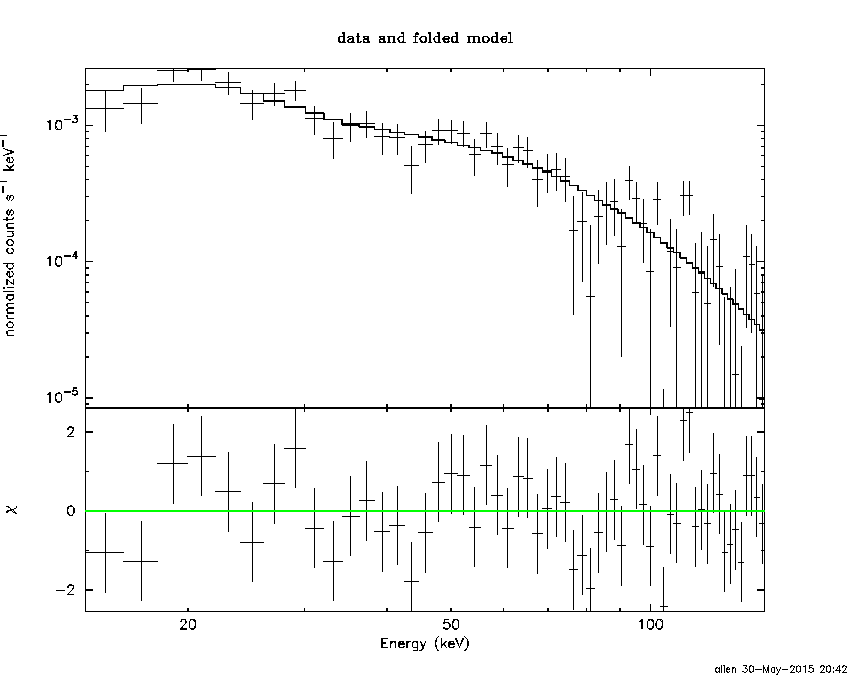
Time averaged spectrum fit using the average DRM
Power-law model
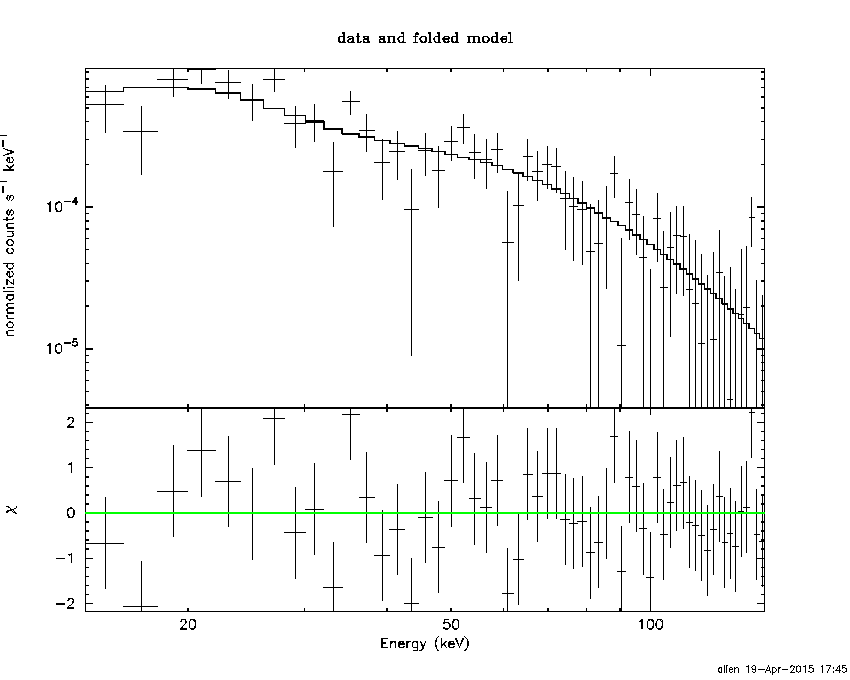
Time interval is from   -6.284 sec. to   62.640 sec.

Spectral model in power-law:
------------------------------------------------------------
Parameters  : value       lower 90%   higher 90%
Photon index: 1.52732     ( -0.165795   0.167349 )
Norm@50keV  : 1.52209E-03    ( -0.000151025   0.000149772 )
------------------------------------------------------------
#Fit statistic : Chi-Squared =          54.39 using 59 PHA bins.
# Reduced chi-squared =         0.9543 for     57 degrees of freedom
# Null hypothesis probability =   5.734797e-01

Photon flux (15-150 keV)    in 68.92 sec: 0.191447 ( -0.0182203  0.0182342 ) ph/cm2/s
Energy fluence (15-150 keV)             : 9.90877e-07 ( -1.07548e-07  1.08847e-07 ) ergs/cm2
Cutoff power-law model
Time interval is from   -6.284 sec. to   62.640 sec.
Spectral model in the cutoff power-law:
------------------------------------------------------------
Parameters  : value       lower 90%   higher 90%
Photon index: 1.31581     ( -0.659743   0.358554 )
Epeak [keV] : 154.316      ( -154.334 -154.334 )
Norm@50keV  : 1.96894E-03    ( -0.000729848   0.00233694 )
------------------------------------------------------------
#Fit statistic : Chi-Squared =          54.02 using 59 PHA bins.
# Reduced chi-squared =         0.9647 for     56 degrees of freedom
# Null hypothesis probability =   5.501570e-01

Photon flux (15-150 keV)    in 68.92 sec: 0.189741 ( -0.018825  0.018796 ) ph/cm2/s
Energy fluence (15-150 keV)             : 9.71848e-07 ( -1.2101e-07  1.20327e-07 ) ergs/cm2
Band function

Time interval is from   -6.284 sec. to   62.640 sec.

Spectral model in the Band function:
------------------------------------------------------------
Parameters  : value       lower 90%   higher 90%
alpha       : 4.93702   ( -13.8377   -4.93702 )
beta        : -1.65982    ( -0.24139   0.198445 )
Epeak [keV] : 25.3158      ( -6.19266 4.22044 )
Norm@50keV   : 141.433    ( -13.2045   752.945 )
------------------------------------------------------------
#Fit statistic : Chi-Squared =          50.95 using 59 PHA bins.
# Reduced chi-squared =         0.9264 for     55 degrees of freedom
# Null hypothesis probability =   6.300284e-01

Photon flux (15-150 keV)    in 68.92 sec:  (    ) ph/cm2/s
Energy fluence (15-150 keV)             : 0 ( 0  0 ) ergs/cm2
Single BB
Spectral model blackbody:
------------------------------------------------------------
Parameters  : value    Lower 90%  Upper 90%
kT [keV]    : 14.0350  (-1.80186  2.10926)
R^2/D10^2   : 2.67819E-02  (-0.0103949   0.0168666)
(R is the radius in km and D10 is the distance to the source in units of 10 kpc)
------------------------------------------------------------
#Fit statistic : Chi-Squared =          83.87 using 59 PHA bins.
# Reduced chi-squared =          1.471 for     57 degrees of freedom
# Null hypothesis probability =   1.179265e-02

Energy  Fluence     90% Error
[keV]   [erg/cm2]   [erg/cm2]
15- 25  7.678e-08   1.324e-08
25- 50  2.863e-07   3.894e-08
50-150  3.718e-07   8.436e-08
15-150  7.349e-07   9.918e-08
Thermal bremsstrahlung (OTTB)

Spectral model: thermal bremsstrahlung
------------------------------------------------------------
Parameters  : value         Lower 90%    Upper 90%
kT [keV]    : 199.329       (-72.7754      -199.344)
Norm        : 0.780451       (-0.0732821     0.0733539)
------------------------------------------------------------
#Fit statistic : Chi-Squared =          54.06 using 59 PHA bins.
# Reduced chi-squared =         0.9485 for     57 degrees of freedom
# Null hypothesis probability =   5.859971e-01

Energy  Fluence     90% Error
[keV]   [erg/cm2]   [erg/cm2]
15- 25  1.339e-07   4.494e-08
25- 50  2.577e-07   7.602e-08
50-150  5.650e-07   2.999e-07
15-150  9.566e-07   3.933e-07
Double BB

Spectral model: bbodyrad<1> + bbodyrad<2>
------------------------------------------------------------
Parameters  : value         Lower 90%    Upper 90%
kT1 [keV]   : 6.48690        (-1.40826      1.80073)
R1^2/D10^2  : 0.278349        (-0.156908      0.396331)
kT2 [keV]   : 26.1651        (-6.02892      12.4063)
R2^2/D10^2  : 2.43581E-03    (-0.00175439   0.00378911)
------------------------------------------------------------
#Fit statistic : Chi-Squared =          51.28 using 59 PHA bins.
# Reduced chi-squared =         0.9323 for     55 degrees of freedom
# Null hypothesis probability =   6.175733e-01

Energy  Fluence     90% Error
[keV]   [erg/cm2]   [erg/cm2]
15- 25  1.385e-07   5.671e-08
25- 50  2.530e-07   8.208e-08
50-150  5.868e-07   2.980e-07
15-150  9.783e-07   3.701e-07
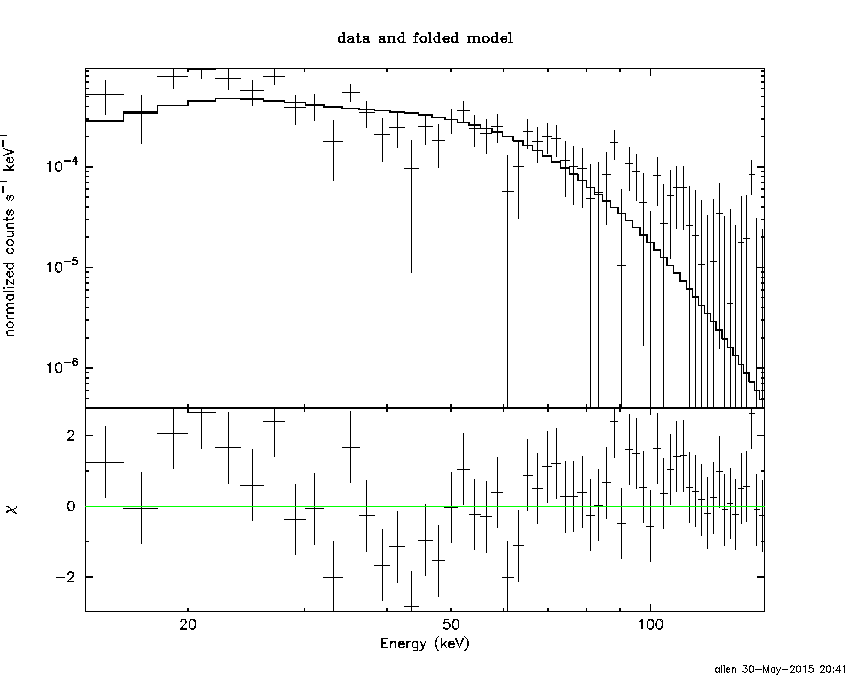
Peak spectrum fit
Power-law model

Time interval is from    0.460 sec. to    1.460 sec.

Spectral model in power-law:
------------------------------------------------------------
Parameters  : value       lower 90%   higher 90%
Photon index: 1.33705     ( -0.200885   0.202973 )
Norm@50keV  : 1.24783E-02    ( -0.00152589   0.0015219 )
------------------------------------------------------------
#Fit statistic : Chi-Squared =          37.58 using 59 PHA bins.
# Reduced chi-squared =         0.6593 for     57 degrees of freedom
# Null hypothesis probability =   9.780491e-01

Photon flux (15-150 keV)    in 1 sec: 1.49933 ( -0.183847  0.184042 ) ph/cm2/s
Energy fluence (15-150 keV)             : 1.22231e-07 ( -1.66277e-08  1.67798e-08 ) ergs/cm2
Cutoff power-law model

Time interval is from    0.460 sec. to    1.460 sec.
Spectral model in the cutoff power-law:
------------------------------------------------------------
Parameters  : value       lower 90%   higher 90%
Photon index: 0.644469     ( -1.02836   0.772776 )
Epeak [keV] : 103.628      ( -34.71 -103.627 )
Norm@50keV  : 2.70038E-02    ( -0.0152669   0.0546578 )
------------------------------------------------------------
#Fit statistic : Chi-Squared =          35.59 using 59 PHA bins.
# Reduced chi-squared =         0.6355 for     56 degrees of freedom
# Null hypothesis probability =   9.848147e-01

Photon flux (15-150 keV)    in 1 sec: 1.46375 ( -0.19024  0.18949 ) ph/cm2/s
Energy fluence (15-150 keV)             : 1.18022e-07 ( -1.7803e-08  1.7771e-08 ) ergs/cm2
Band function
Time interval is from    0.460 sec. to    1.460 sec.

Spectral model in the Band function:
------------------------------------------------------------
Parameters  : value       lower 90%   higher 90%
alpha       : -0.645371   ( -0.548016   0.895865 )
beta        : -10.0000    ( 10   0 )
Epeak [keV] : 103.679      ( -27.8412 635.652 )
Norm@50keV   : 2.69767E-02    ( -0.0152323   0.0546554 )
------------------------------------------------------------
#Fit statistic : Chi-Squared =          35.59 using 59 PHA bins.
# Reduced chi-squared =         0.6471 for     55 degrees of freedom
# Null hypothesis probability =   9.804324e-01

Photon flux (15-150 keV)    in 1 sec: 1.47641 (    ) ph/cm2/s
Energy fluence (15-150 keV)             : 1.20081e-07 ( 0  0 ) ergs/cm2
Single BB
Spectral model blackbody:
------------------------------------------------------------
Parameters  : value    Lower 90%  Upper 90%
kT [keV]    : 17.0209  (-2.31854  2.75694)
R^2/D10^2   : 0.118226  (-0.0471958   0.0756749)
(R is the radius in km and D10 is the distance to the source in units of 10 kpc)
------------------------------------------------------------
#Fit statistic : Chi-Squared =          44.22 using 59 PHA bins.
# Reduced chi-squared =         0.7758 for     57 degrees of freedom
# Null hypothesis probability =   8.918671e-01

Energy  Fluence     90% Error
[keV]   [erg/cm2]   [erg/cm2]
15- 25  6.973e-09   1.560e-09
25- 50  3.088e-08   5.315e-09
50-150  6.391e-08   1.596e-08
15-150  1.018e-07   1.657e-08
Thermal bremsstrahlung (OTTB)

Spectral model: thermal bremsstrahlung
------------------------------------------------------------
Parameters  : value         Lower 90%    Upper 90%
kT [keV]    : 200.000       (      )
Norm        : 6.18996       (-0.751505     0.751463)
------------------------------------------------------------
#Fit statistic : Chi-Squared =          39.56 using 59 PHA bins.
# Reduced chi-squared =         0.6940 for     57 degrees of freedom
# Null hypothesis probability =   9.619415e-01

Energy  Fluence     90% Error
[keV]   [erg/cm2]   [erg/cm2]
15- 25  1.541e-08   8.625e-09
25- 50  2.965e-08   1.622e-08
50-150  6.503e-08   3.561e-08
15-150  1.101e-07   6.105e-08
Double BB

Spectral model: bbodyrad<1> + bbodyrad<2>
------------------------------------------------------------
Parameters  : value         Lower 90%    Upper 90%
kT1 [keV]   : 4.09111        (-2.15156      8.8888)
R1^2/D10^2  : 7.91284        (-7.61095      583.771)
kT2 [keV]   : 20.1624        (-3.59024      25.7466)
R2^2/D10^2  : 6.15988E-02    (-0.058828   0.0456894)
------------------------------------------------------------
#Fit statistic : Chi-Squared =          35.73 using 59 PHA bins.
# Reduced chi-squared =         0.6497 for     55 degrees of freedom
# Null hypothesis probability =   9.795526e-01

Energy  Fluence     90% Error
[keV]   [erg/cm2]   [erg/cm2]
15- 25  1.283e-08   6.020e-09
25- 50  2.718e-08   7.835e-09
50-150  7.274e-08   2.145e-08
15-150  1.128e-07   3.673e-08
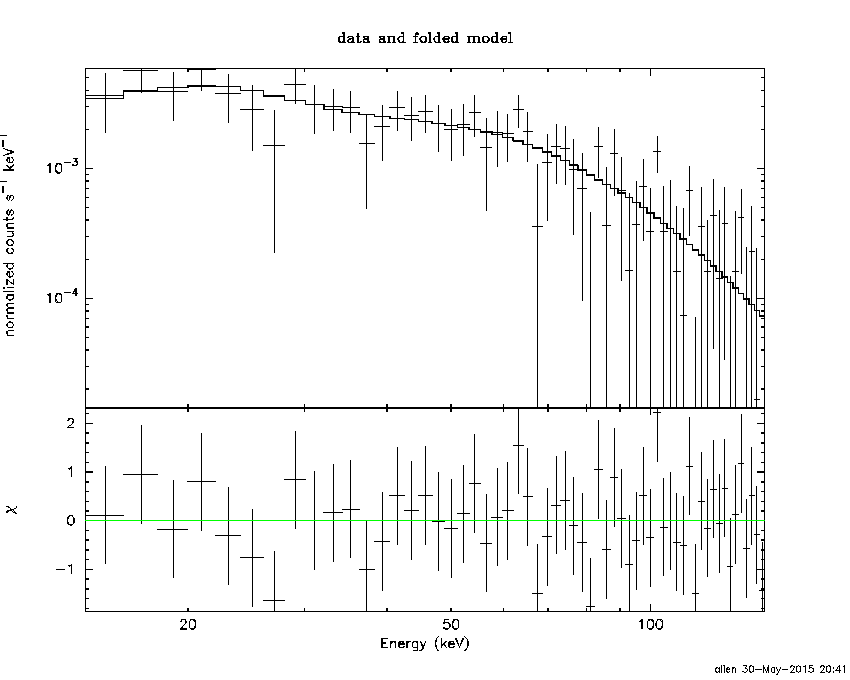
Pre-slew spectrum (Pre-slew PHA with pre-slew DRM)
Power-law model

Spectral model in power-law:
------------------------------------------------------------
Parameters  : value       lower 90%   higher 90%
Photon index: 1.49694     ( -0.121371   0.121907 )
Norm@50keV  : 4.73300E-03    ( -0.000333521   0.000332212 )
------------------------------------------------------------
#Fit statistic : Chi-Squared =          62.09 using 59 PHA bins.
# Reduced chi-squared =          1.089 for     57 degrees of freedom
# Null hypothesis probability =   2.996136e-01

Photon flux (15-150 keV)    in 18.58 sec: 0.590379 ( -0.0412445  0.0412904 ) ph/cm2/s
Energy fluence (15-150 keV)             : 8.34649e-07 ( -6.45523e-08  6.5033e-08 ) ergs/cm2
Cutoff power-law model
Spectral model in the cutoff power-law:
------------------------------------------------------------
Parameters  : value       lower 90%   higher 90%
Photon index: 1.27234     ( -0.491643   0.28905 )
Epeak [keV] : 159.971      ( -159.983 -159.983 )
Norm@50keV  : 6.16874E-03    ( -0.00170533   0.00467156 )
------------------------------------------------------------
#Fit statistic : Chi-Squared =          61.36 using 59 PHA bins.
# Reduced chi-squared =          1.096 for     56 degrees of freedom
# Null hypothesis probability =   2.898588e-01

Photon flux (15-150 keV)    in 18.58 sec: 0.584254 ( -0.043003  0.042937 ) ph/cm2/s
Energy fluence (15-150 keV)             : 8.1935e-07 ( -7.21889e-08  7.1821e-08 ) ergs/cm2
Band function

Spectral model in the Band function:
------------------------------------------------------------
Parameters  : value       lower 90%   higher 90%
alpha       : 4.99887   ( -14.9911   -4.99887 )
beta        : -1.57510    ( -0.142456   0.136855 )
Epeak [keV] : 23.9421      ( -5.3916 3.72245 )
Norm@50keV   : 657.266    ( -44.6856   2605.48 )
------------------------------------------------------------
#Fit statistic : Chi-Squared =          58.51 using 59 PHA bins.
# Reduced chi-squared =          1.064 for     55 degrees of freedom
# Null hypothesis probability =   3.477822e-01

Photon flux (15-150 keV)    in 18.58 sec:  (    ) ph/cm2/s
Energy fluence (15-150 keV)             : 0 ( 0  0 ) ergs/cm2
S(25-50 keV) vs. S(50-100 keV) plot

S(25-50 keV)  = 2.48e-07
S(50-100 keV) = 3.45e-07
T90 vs. Hardness ratio plot
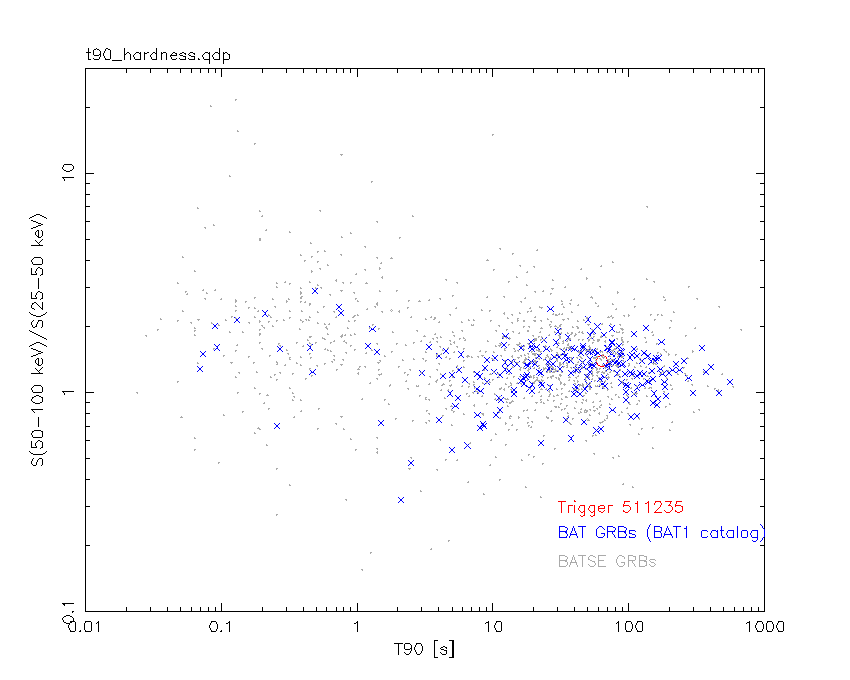
T90                                   = 63.4999999403954 sec.
Hardness ratio (energy fluence ratio) = 1.39113
Color vs. Color plot

Count Ratio  (25-50 keV) / (15-25 keV) = 1.23114
Count Ratio (50-100 keV) / (15-25 keV) = 1.01829
Mask shadow pattern
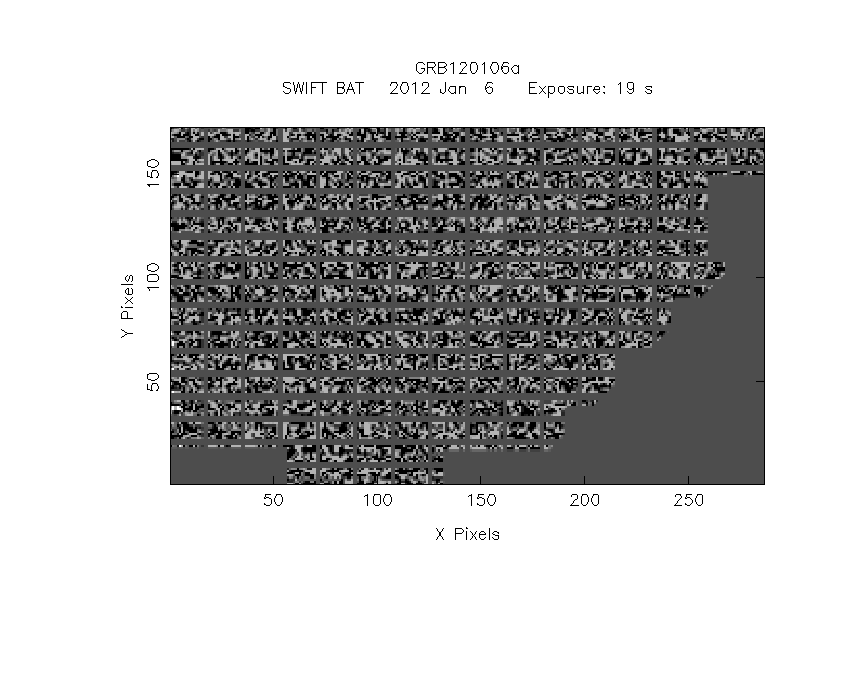
IMX = 5.310376570901550E-01, IMY = -1.535421415736369E-01
TIME vs. PHA plot around the trigger time
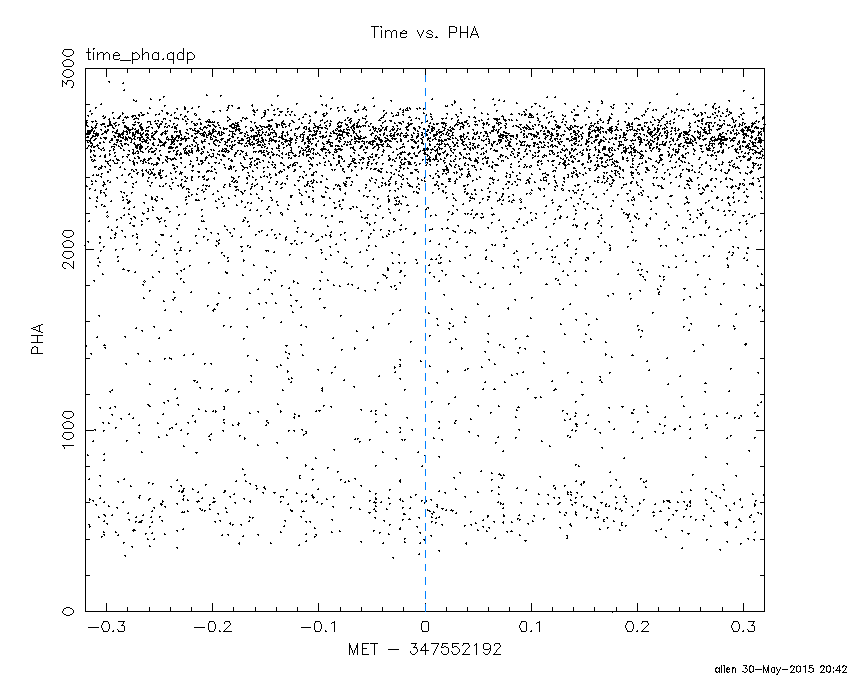
Blue+Cyan dotted lines: Time interval of the scaled map
From 0.000000 to 1.024000
TIME vs. DetID plot around the trigger time
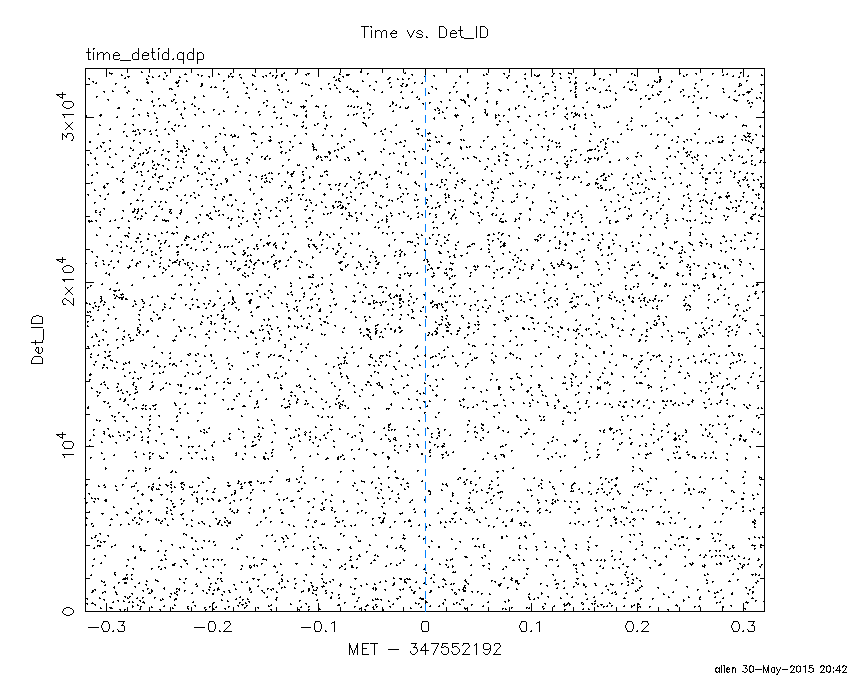
Blue+Cyan dotted lines: Time interval of the scaled map
From 0.000000 to 1.024000
100 us light curve (15-350 keV)
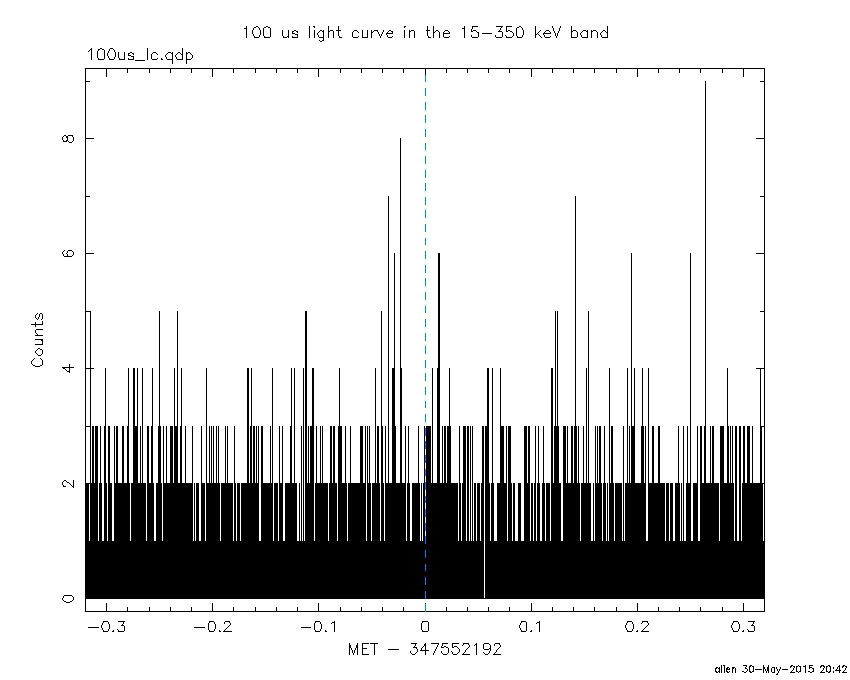
Blue+Cyan dotted lines: Time interval of the scaled map
From 0.000000 to 1.024000
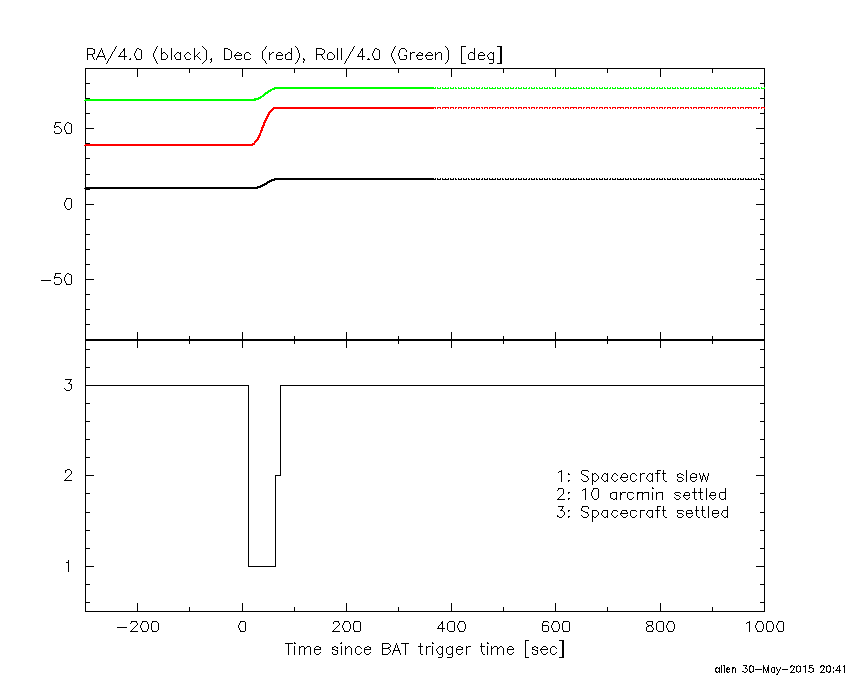
Spacecraft aspect plot
Bright source in the pre-burst/pre-slew/post-slew images
Pre-burst image of 15-350 keV band
Time interval of the image:
-748.599400 -731.865300
-239.000000 -34.849300
-34.000000 -6.284000

# RAcent  DECcent POSerr Theta    Phi  PeakCts   SNR AngSep     Name
#  [deg]    [deg]    ['] [deg]  [deg]                   [']
 83.6541  22.0091    1.1  39.5   97.1   9.0544  10.6    1.2	Crab
 10.0686  32.8341    2.2  26.2  -99.5   1.3737   5.3 ------	UNKNOWN
 11.1388  27.5550    3.6  27.8 -110.8   0.8704   3.2 ------	UNKNOWN
  2.1397  34.5024    2.6  31.8  -91.4   1.4079   4.4 ------	UNKNOWN
  7.1489   0.5215    3.6  49.7 -137.9   2.6740   3.2  430.1	UNKNOWN
328.9875  57.8448    2.6  49.1  -48.1   4.7145   4.4 ------	UNKNOWN
Pre-slew background subtracted image of 15-350 keV band
Time interval of the image:
-6.284000 12.300600

# RAcent  DECcent POSerr Theta    Phi  PeakCts   SNR AngSep     Name
#  [deg]    [deg]    ['] [deg]  [deg]                   [']
 83.4574  21.9643    3.5  39.4   97.3   0.6370   3.3   10.2	Crab
104.4571  77.6952    2.2  46.4    9.3   0.5453   5.2 ------	UNKNOWN
 66.1305  64.0489    0.5  28.9   16.1   1.3643  21.7 ------	UNKNOWN
Post-slew image of 15-350 keV band
Time interval of the image:
63.900600 963.099000
1257.000000 1409.160000

# RAcent  DECcent POSerr Theta    Phi  PeakCts   SNR AngSep     Name
#  [deg]    [deg]    ['] [deg]  [deg]                   [']
194.9918  76.3282    3.1  36.0  -18.9   2.6304   3.7 ------	UNKNOWN
 19.7459  30.6801    3.9  44.1 -153.6   3.1854   3.0 ------	UNKNOWN
336.3593  57.2295    4.7  40.8  -93.1   8.9075   2.5 ------	UNKNOWN
Plot creation:
Sat May 30 20:42:53 EDT 2015