Special notes of this burst
Image
Pre-slew 15.0-350.0 keV image (Event data)

#   RAcent    DECcent   POSerr    Theta     Phi              Peak Cts       SNR   Name
  120.0290    -9.0766   0.0020     5.1274   -12.4952        10.9258662     96.999 TRIG_00512035

Foreground time interval of the image:
-13.016  12.085 (delta_t =  25.101 [sec])
Background time interval of the image:
-239.016 -13.016 (delta_t = 226.000 [sec])
Lightcurves
Notes:
- 1) The mask-weighted light curves are using the flight position.
- 2) Multiple plots of different time binning/intervals are shown to cover all scenarios of short/long GRBs, rate/image triggers, and real/false positives.
- 3) For all the mask-weighted lightcurves, the y-axis units are counts/sec/det where a det is 0.4 x 0.4 = 0.16 sq cm.
- 4) The verticle lines correspond to following: green dotted lines are T50 interval, black dotted lines are T90 interval, blue solid line(s) is a spacecraft slew start time, and orange solid line(s) is a spacecraft slew end time.
- 5) Time of each bin is in the middle of the bin.
1 s binning
From T0-310 s to T0+310 s

From T100_start - 20 s to T100_end + 30 s

Full time interval

64 ms binning
Full time interval

From T100_start to T100_end

From T0-5 sec to T0+5 sec

16 ms binning
From T100_start-5 s to T100_start+5 s

Blue+Cyan dotted lines: Time interval of the scaled map
From 0.000000 to 1.024000
8 ms binning
From T100_start-3 s to T100_start+3 s

Blue+Cyan dotted lines: Time interval of the scaled map
From 0.000000 to 1.024000
2 ms binning
From T100_start-1 s to T100_start+1 s

Blue+Cyan dotted lines: Time interval of the scaled map
From 0.000000 to 1.024000
SN=5 or 10 sec. binning (whichever binning is satisfied first)
SN=5 or 10 sec. binning (T < 200 sec)

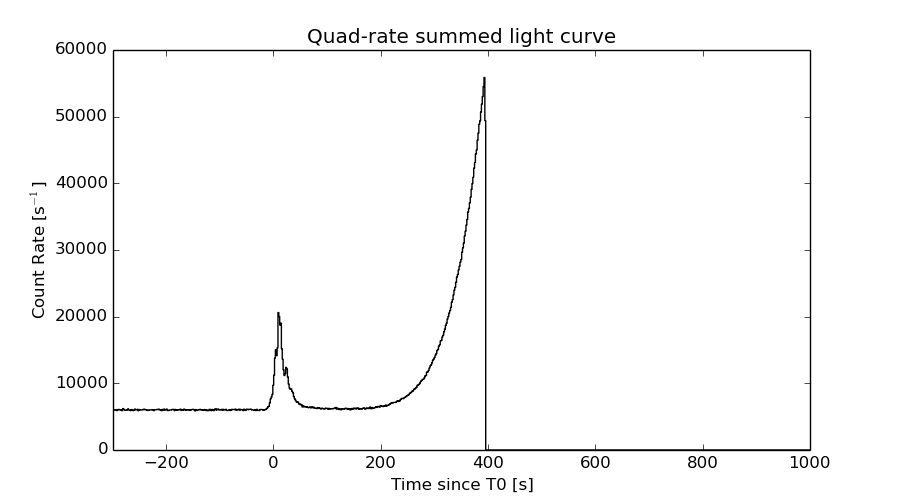
Quad-rate summed light curves (from T0-300s to T0+1000s)
Spectral Evolution

Spectra
Notes:
- 1) The fitting includes the systematic errors.
- 2) When the burst includes telescope slew time periods, the fitting uses an average response file made from multiple 5-s response files through out the slew time plus single time preiod for the non-slew times, and weighted by the total counts in the corresponding time period using addrmf. An average response file is needed becuase a spectral fit using the pre-slew DRM will introduce some errors in both a spectral shape and a normalization if the PHA file contains a lot of the slew/post-slew time interval.
- 3) For fits to more complicated models (e.g. a power-law over a cutoff power-law), the BAT team has decided to require a chi-square improvement of more than 6 for each extra dof.
Time averaged spectrum fit using the average DRM
Power-law model

Time interval is from  -13.016 sec. to  213.984 sec.

Spectral model in power-law:
------------------------------------------------------------
Parameters  : value       lower 90%   higher 90%
Photon index: 1.37738     ( -0.031307   0.0312367 )
Norm@50keV  : 7.73524E-03    ( -0.000125383   0.000125236 )
------------------------------------------------------------
#Fit statistic : Chi-Squared =          43.02 using 59 PHA bins.
# Reduced chi-squared =         0.7548 for     57 degrees of freedom
# Null hypothesis probability =   9.147804e-01

Photon flux (15-150 keV)    in 227 sec: 0.937285 ( -0.0176333  0.0176966 ) ph/cm2/s
Energy fluence (15-150 keV)             : 1.7047e-05 ( -2.75335e-07  2.75419e-07 ) ergs/cm2
Cutoff power-law model

Time interval is from  -13.016 sec. to  213.984 sec.
Spectral model in the cutoff power-law:
------------------------------------------------------------
Parameters  : value       lower 90%   higher 90%
Photon index: 1.28105     ( -0.128933   0.0735754 )
Epeak [keV] : 443.256      ( -217.826 -443.4 )
Norm@50keV  : 8.49240E-03    ( -0.000574781   0.00110032 )
------------------------------------------------------------
#Fit statistic : Chi-Squared =          41.33 using 59 PHA bins.
# Reduced chi-squared =         0.7381 for     56 degrees of freedom
# Null hypothesis probability =   9.285692e-01

Photon flux (15-150 keV)    in 227 sec: 0.929219 ( -0.02022  0.010206 ) ph/cm2/s
Energy fluence (15-150 keV)             : 1.69604e-05 ( -3.02478e-07  2.98959e-07 ) ergs/cm2
Band function

Time interval is from  -13.016 sec. to  213.984 sec.

Spectral model in the Band function:
------------------------------------------------------------
Parameters  : value       lower 90%   higher 90%
alpha       : -0.688316   ( -0.473972   5.06323 )
beta        : -1.41440    ( -0.0830607   0.0447135 )
Epeak [keV] : 69.6817      ( -37.392 162.453 )
Norm@50keV   : 1.95988E-02    ( -0.00994898   0.912242 )
------------------------------------------------------------
#Fit statistic : Chi-Squared =          38.06 using 59 PHA bins.
# Reduced chi-squared =         0.6919 for     55 degrees of freedom
# Null hypothesis probability =   9.602968e-01

Photon flux (15-150 keV)    in 227 sec:  (    ) ph/cm2/s
Energy fluence (15-150 keV)             : 0 ( 0  0 ) ergs/cm2
Single BB

Spectral model blackbody:
------------------------------------------------------------
Parameters  : value    Lower 90%  Upper 90%
kT [keV]    : 19.3892  (  )
R^2/D10^2   : 4.34931E-02  (   )
(R is the radius in km and D10 is the distance to the source in units of 10 kpc)
------------------------------------------------------------
#Fit statistic : Chi-Squared =         761.51 using 59 PHA bins.
# Reduced chi-squared =         13.360 for     57 degrees of freedom
# Null hypothesis probability =  7.629867e-124

Energy  Fluence     90% Error
[keV]   [erg/cm2]   [erg/cm2]
15- 25  7.241e-07   2.622e-08
25- 50  3.532e-06   9.534e-08
50-150  9.796e-06   2.463e-07
15-150  1.405e-05   2.508e-07
Thermal bremsstrahlung (OTTB)

Spectral model: thermal bremsstrahlung
------------------------------------------------------------
Parameters  : value         Lower 90%    Upper 90%
kT [keV]    : 199.363       (      )
Norm        : 3.98841       (     )
------------------------------------------------------------
#Fit statistic : Chi-Squared =         189.66 using 59 PHA bins.
# Reduced chi-squared =         3.3274 for     57 degrees of freedom
# Null hypothesis probability =   3.710581e-16

Energy  Fluence     90% Error
[keV]   [erg/cm2]   [erg/cm2]
15- 25  2.254e-06   4.143e-08
25- 50  4.337e-06   8.399e-08
50-150  9.511e-06   1.748e-07
15-150  1.610e-05   2.792e-07
Double BB

Spectral model: bbodyrad<1> + bbodyrad<2>
------------------------------------------------------------
Parameters  : value         Lower 90%    Upper 90%
kT1 [keV]   : 8.56977        (-0.586505      0.622381)
R1^2/D10^2  : 0.441081        (-0.0882542      0.116687)
kT2 [keV]   : 33.0827        (-2.35142      2.96065)
R2^2/D10^2  : 5.87987E-03    (-0.00146447   0.00170117)
------------------------------------------------------------
#Fit statistic : Chi-Squared =          58.25 using 59 PHA bins.
# Reduced chi-squared =          1.059 for     55 degrees of freedom
# Null hypothesis probability =   3.566426e-01

Energy  Fluence     90% Error
[keV]   [erg/cm2]   [erg/cm2]
15- 25  1.608e-06   1.068e-07
25- 50  4.114e-06   1.407e-07
50-150  1.107e-05   3.814e-07
15-150  1.679e-05   5.266e-07
Peak spectrum fit
Power-law model

Time interval is from    8.984 sec. to    9.984 sec.

Spectral model in power-law:
------------------------------------------------------------
Parameters  : value       lower 90%   higher 90%
Photon index: 1.12581     ( -0.0530679   0.052945 )
Norm@50keV  : 8.47845E-02    ( -0.00249356   0.00249327 )
------------------------------------------------------------
#Fit statistic : Chi-Squared =          64.81 using 59 PHA bins.
# Reduced chi-squared =          1.137 for     57 degrees of freedom
# Null hypothesis probability =   2.229693e-01

Photon flux (15-150 keV)    in 1 sec: 9.86046 ( -0.298556  0.298812 ) ph/cm2/s
Energy fluence (15-150 keV)             : 8.79278e-07 ( -2.88203e-08  2.88874e-08 ) ergs/cm2
Cutoff power-law model

Time interval is from    8.984 sec. to    9.984 sec.
Spectral model in the cutoff power-law:
------------------------------------------------------------
Parameters  : value       lower 90%   higher 90%
Photon index: 0.779959     ( -0.231005   0.219525 )
Epeak [keV] : 197.559      ( -57.0361 229.022 )
Norm@50keV  : 0.121741    ( -0.0244362   0.0323311 )
------------------------------------------------------------
#Fit statistic : Chi-Squared =          57.42 using 59 PHA bins.
# Reduced chi-squared =          1.025 for     56 degrees of freedom
# Null hypothesis probability =   4.224750e-01

Photon flux (15-150 keV)    in 1 sec: 9.69040 ( -0.31586  0.3161 ) ph/cm2/s
Energy fluence (15-150 keV)             : 8.61678e-07 ( -3.1489e-08  3.1321e-08 ) ergs/cm2
Band function

Time interval is from    8.984 sec. to    9.984 sec.

Spectral model in the Band function:
------------------------------------------------------------
Parameters  : value       lower 90%   higher 90%
alpha       : -0.307641   ( -0.513964   0.855958 )
beta        : -1.29424    ( -0.203022   0.111066 )
Epeak [keV] : 92.0748      ( -32.3866 103.028 )
Norm@50keV   : 0.228349    ( -0.124385   0.583799 )
------------------------------------------------------------
#Fit statistic : Chi-Squared =          53.55 using 59 PHA bins.
# Reduced chi-squared =         0.9736 for     55 degrees of freedom
# Null hypothesis probability =   5.303119e-01

Photon flux (15-150 keV)    in 1 sec:  (    ) ph/cm2/s
Energy fluence (15-150 keV)             : 0 ( 0  0 ) ergs/cm2
Single BB

Spectral model blackbody:
------------------------------------------------------------
Parameters  : value    Lower 90%  Upper 90%
kT [keV]    : 19.6506  (  )
R^2/D10^2   : 0.489304  (   )
(R is the radius in km and D10 is the distance to the source in units of 10 kpc)
------------------------------------------------------------
#Fit statistic : Chi-Squared =         217.46 using 59 PHA bins.
# Reduced chi-squared =         3.8150 for     57 degrees of freedom
# Null hypothesis probability =   1.398596e-20

Energy  Fluence     90% Error
[keV]   [erg/cm2]   [erg/cm2]
15- 25  3.668e-08   2.140e-09
25- 50  1.805e-07   7.800e-09
50-150  5.155e-07   2.550e-08
15-150  7.327e-07   2.855e-08
Thermal bremsstrahlung (OTTB)

Spectral model: thermal bremsstrahlung
------------------------------------------------------------
Parameters  : value         Lower 90%    Upper 90%
kT [keV]    : 199.363       (      )
Norm        : 40.6136       (     )
------------------------------------------------------------
#Fit statistic : Chi-Squared =         234.85 using 59 PHA bins.
# Reduced chi-squared =         4.1202 for     57 degrees of freedom
# Null hypothesis probability =   1.891280e-23

Energy  Fluence     90% Error
[keV]   [erg/cm2]   [erg/cm2]
15- 25  1.011e-07   3.105e-09
25- 50  1.945e-07   6.150e-09
50-150  4.267e-07   1.265e-08
15-150  7.223e-07   2.150e-08
Double BB

Spectral model: bbodyrad<1> + bbodyrad<2>
------------------------------------------------------------
Parameters  : value         Lower 90%    Upper 90%
kT1 [keV]   : 10.2841        (-1.43225      1.5059)
R1^2/D10^2  : 2.37719        (-0.683697      1.1468)
kT2 [keV]   : 39.1330        (-6.93328      13.4934)
R2^2/D10^2  : 4.24783E-02    (-0.0244445   0.0379672)
------------------------------------------------------------
#Fit statistic : Chi-Squared =          59.18 using 59 PHA bins.
# Reduced chi-squared =          1.076 for     55 degrees of freedom
# Null hypothesis probability =   3.256997e-01

Energy  Fluence     90% Error
[keV]   [erg/cm2]   [erg/cm2]
15- 25  6.019e-08   6.900e-09
25- 50  1.914e-07   1.615e-08
50-150  6.130e-07   1.169e-07
15-150  8.645e-07   1.359e-07
Pre-slew spectrum (Pre-slew PHA with pre-slew DRM)
Power-law model

Spectral model in power-law:
------------------------------------------------------------
Parameters  : value       lower 90%   higher 90%
Photon index: 1.23458     ( -0.0304935   0.0304025 )
Norm@50keV  : 2.83532E-02    ( -0.000465589   0.000465042 )
------------------------------------------------------------
#Fit statistic : Chi-Squared =          34.65 using 59 PHA bins.
# Reduced chi-squared =         0.6080 for     57 degrees of freedom
# Null hypothesis probability =   9.915464e-01

Photon flux (15-150 keV)    in 25.1 sec: 3.34519 ( -0.0610337  0.061194 ) ph/cm2/s
Energy fluence (15-150 keV)             : 7.15159e-06 ( -1.16167e-07  1.16205e-07 ) ergs/cm2
Cutoff power-law model

Spectral model in the cutoff power-law:
------------------------------------------------------------
Parameters  : value       lower 90%   higher 90%
Photon index: 1.09887     ( -0.125784   0.109774 )
Epeak [keV] : 404.652      ( -163.844 2423.86 )
Norm@50keV  : 3.22525E-02    ( -0.00346853   0.00397975 )
------------------------------------------------------------
#Fit statistic : Chi-Squared =          31.11 using 59 PHA bins.
# Reduced chi-squared =         0.5555 for     56 degrees of freedom
# Null hypothesis probability =   9.971798e-01

Photon flux (15-150 keV)    in 25.1 sec: 3.31043 ( -0.06773  0.06804 ) ph/cm2/s
Energy fluence (15-150 keV)             : 7.11136e-06 ( -1.23266e-07  1.22739e-07 ) ergs/cm2
Band function

Spectral model in the Band function:
------------------------------------------------------------
Parameters  : value       lower 90%   higher 90%
alpha       : -0.284663   ( -0.519311   4.4193 )
beta        : -1.27456    ( -0.0661862   0.049321 )
Epeak [keV] : 63.6387      ( -33.2088 149.944 )
Norm@50keV   : 0.105392    ( -0.0639169   24.6028 )
------------------------------------------------------------
#Fit statistic : Chi-Squared =          27.48 using 59 PHA bins.
# Reduced chi-squared =         0.4997 for     55 degrees of freedom
# Null hypothesis probability =   9.993010e-01

Photon flux (15-150 keV)    in 25.1 sec:  (    ) ph/cm2/s
Energy fluence (15-150 keV)             : 0 ( 0  0 ) ergs/cm2
S(25-50 keV) vs. S(50-100 keV) plot

S(25-50 keV)  = 3.96e-06
S(50-100 keV) = 6.10e-06
T90 vs. Hardness ratio plot

T90                                   = 68 sec.
Hardness ratio (energy fluence ratio) = 1.5404
Color vs. Color plot

Count Ratio  (25-50 keV) / (15-25 keV) = 1.47171
Count Ratio (50-100 keV) / (15-25 keV) = 1.20466
Mask shadow pattern

IMX = 8.760464921093211E-02, IMY = 1.941371800310528E-02
TIME vs. PHA plot around the trigger time

Blue+Cyan dotted lines: Time interval of the scaled map
From 0.000000 to 1.024000
TIME vs. DetID plot around the trigger time

Blue+Cyan dotted lines: Time interval of the scaled map
From 0.000000 to 1.024000
100 us light curve (15-350 keV)
Blue+Cyan dotted lines: Time interval of the scaled map
From 0.000000 to 1.024000
Spacecraft aspect plot

Bright source in the pre-burst/pre-slew/post-slew images
Pre-burst image of 15-350 keV band
Time interval of the image:
-239.016000 -13.016000

# RAcent  DECcent POSerr Theta    Phi  PeakCts   SNR AngSep     Name
#  [deg]    [deg]    ['] [deg]  [deg]                   [']
135.5713 -40.5358    2.4  34.7  -95.1   2.2472   4.9    2.3	Vela X-1
150.8658  13.5764    2.5  33.1  150.6   1.4891   4.6 ------	UNKNOWN
142.0945  -0.5167    2.4  18.4  168.8   0.9095   4.8 ------	UNKNOWN
154.7583 -24.2952    3.0  33.3 -136.5   1.0200   3.9 ------	UNKNOWN
102.9514 -47.9569    3.0  44.8  -59.9   3.4904   3.9 ------	UNKNOWN
Pre-slew background subtracted image of 15-350 keV band
Time interval of the image:
-13.016000 12.084600

# RAcent  DECcent POSerr Theta    Phi  PeakCts   SNR AngSep     Name
#  [deg]    [deg]    ['] [deg]  [deg]                   [']
135.4883 -40.7177    7.4  34.8  -94.9   0.3832   1.6    9.9	Vela X-1
123.3378  18.8244    2.5  26.1   96.1   0.8097   4.7 ------	UNKNOWN
 72.5431  -1.0451    2.6  52.5   13.5   2.0252   4.4 ------	UNKNOWN
120.0290  -9.0766    0.1   5.1  -12.5  10.9261  97.0 ------	UNKNOWN
175.3043 -26.1393    2.5  51.5 -142.8   2.1579   4.7 ------	UNKNOWN
Post-slew image of 15-350 keV band
Time interval of the image:
41.084600 423.034000

# RAcent  DECcent POSerr Theta    Phi  PeakCts   SNR AngSep     Name
#  [deg]    [deg]    ['] [deg]  [deg]                   [']
 83.6251  21.9966    1.1  47.3   40.7   8.7419  10.8    1.2	Crab
135.4273 -40.5445    4.1  34.3 -111.8   1.1031   2.8    4.7	Vela X-1
173.6423  -1.3558    2.0  53.9  174.2   5.0393   5.8 ------	UNKNOWN
113.3042  -2.3032    2.8   9.5   44.1   0.8491   4.1 ------	UNKNOWN
120.0344  -9.0928    0.8   0.0 -124.5   2.8476  13.7 ------	UNKNOWN
 74.7068 -14.8407    2.5  44.6  -12.8   1.5636   4.6 ------	UNKNOWN
 66.5239 -17.7709    3.5  52.6  -16.3   1.6905   3.3 ------	UNKNOWN
Plot creation:
Sat May 30 20:37:27 EDT 2015