Special notes of this burst
Image
Pre-slew 15.0-350.0 keV image (Event data)
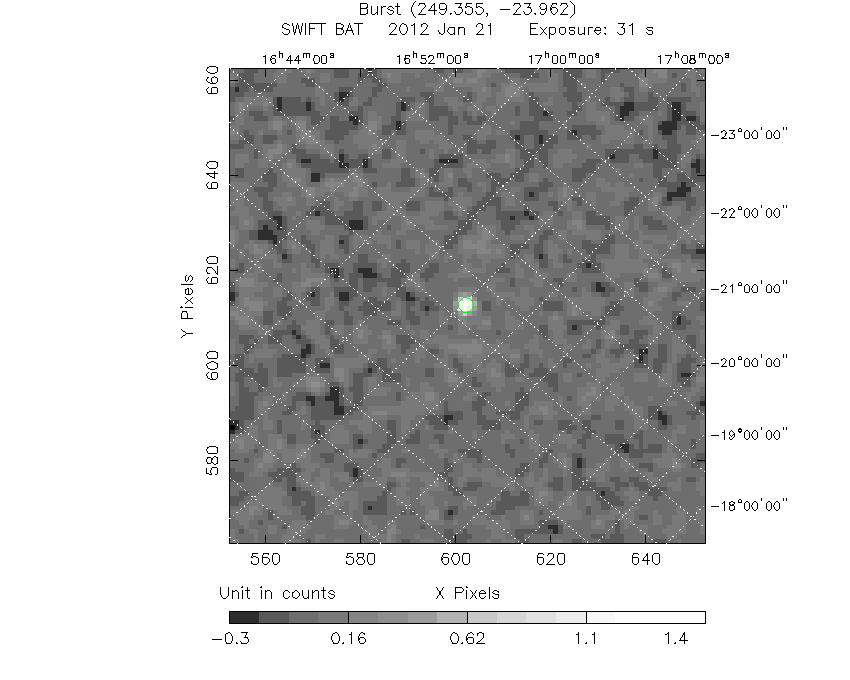
#   RAcent    DECcent   POSerr    Theta     Phi              Peak Cts       SNR   Name
  249.3631   -23.9605   0.0101    32.9980   -26.1171         1.5694920     19.048 TRIG_00512164

Foreground time interval of the image:
-11.004  19.776 (delta_t =  30.780 [sec])
Background time interval of the image:
-239.072 -11.004 (delta_t = 228.068 [sec])
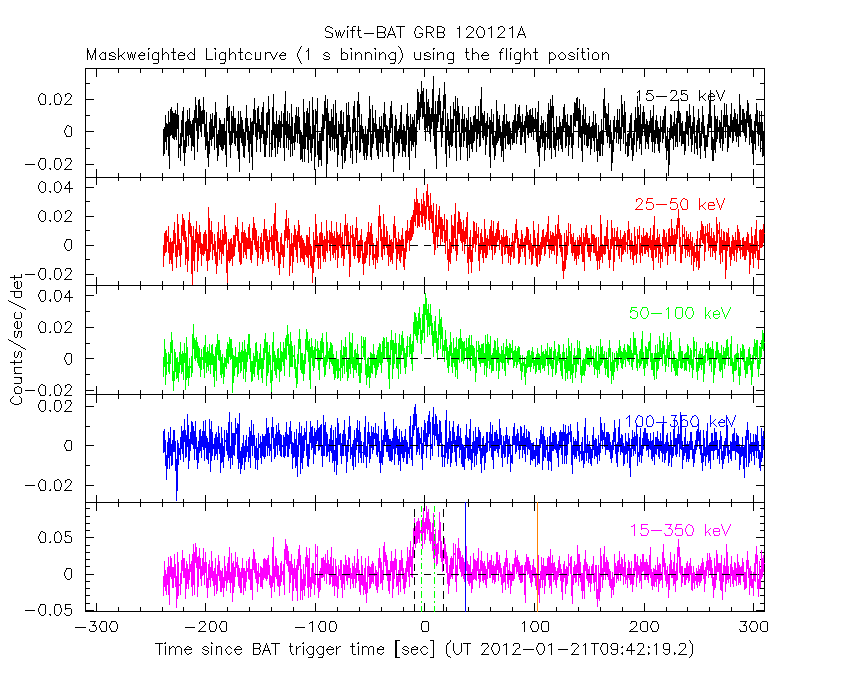
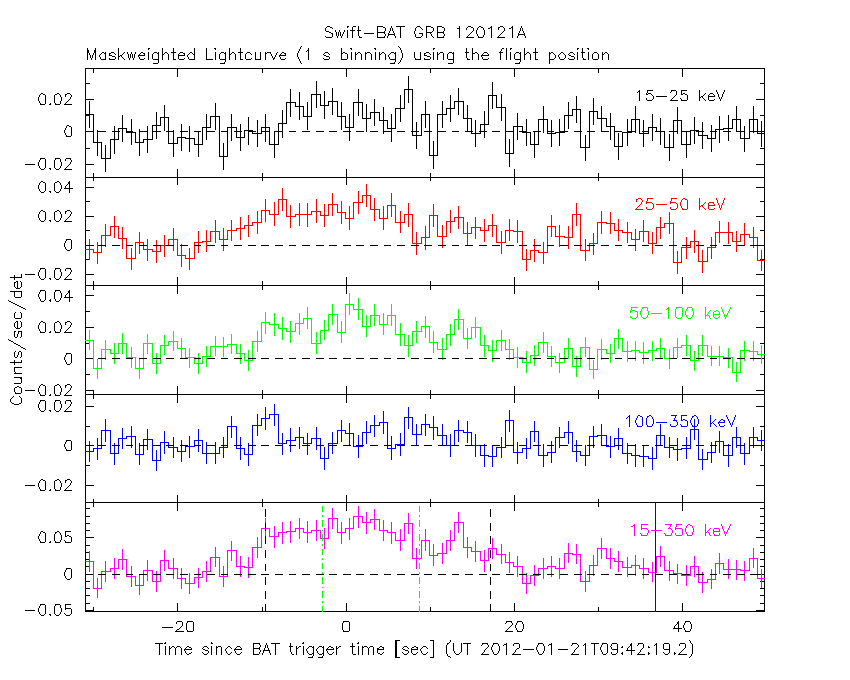
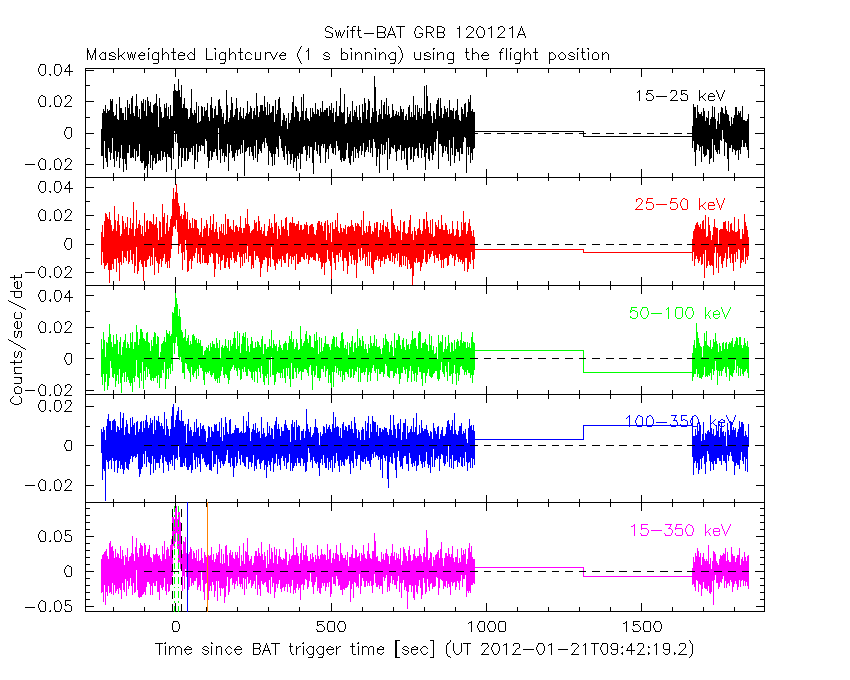
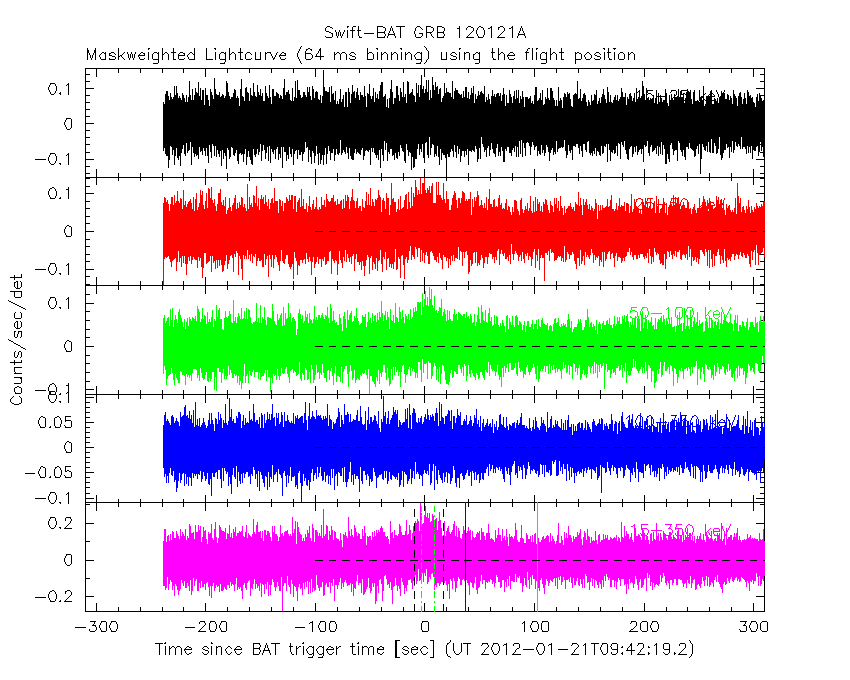
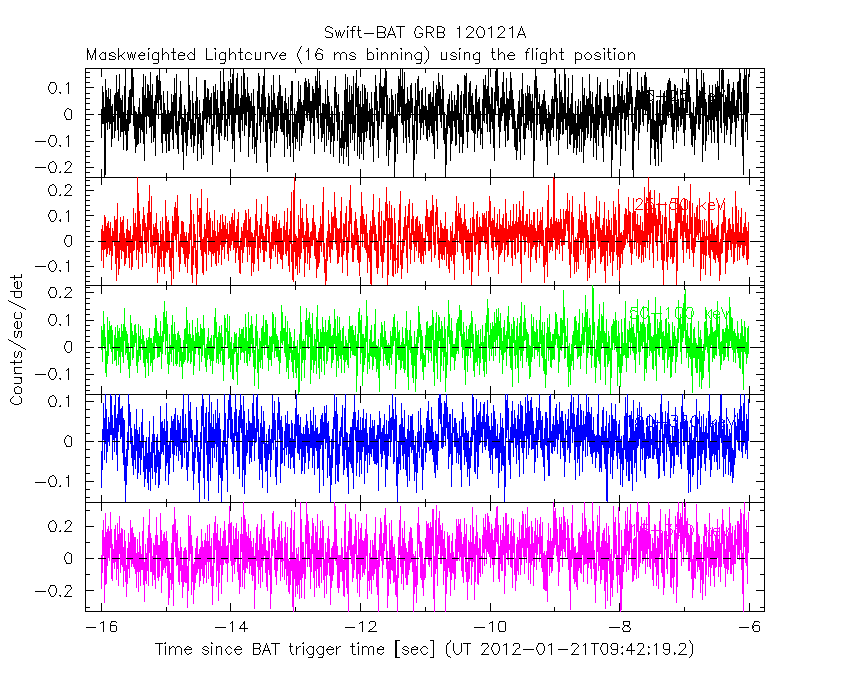
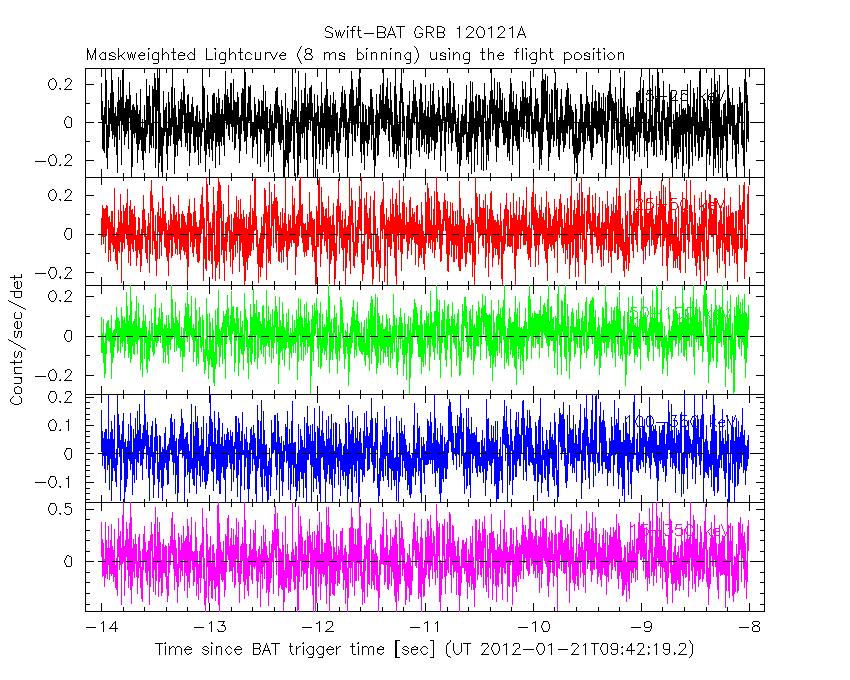
Lightcurves
Notes:
- 1) The mask-weighted light curves are using the flight position.
- 2) Multiple plots of different time binning/intervals are shown to cover all scenarios of short/long GRBs, rate/image triggers, and real/false positives.
- 3) For all the mask-weighted lightcurves, the y-axis units are counts/sec/det where a det is 0.4 x 0.4 = 0.16 sq cm.
- 4) The verticle lines correspond to following: green dotted lines are T50 interval, black dotted lines are T90 interval, blue solid line(s) is a spacecraft slew start time, and orange solid line(s) is a spacecraft slew end time.
- 5) Time of each bin is in the middle of the bin.
1 s binning
From T0-310 s to T0+310 s
From T100_start - 20 s to T100_end + 30 s
Full time interval
64 ms binning
Full time interval
From T100_start to T100_end

From T0-5 sec to T0+5 sec

16 ms binning
From T100_start-5 s to T100_start+5 s
Blue+Cyan dotted lines: Time interval of the scaled map
From 0.000000 to 4.096000
8 ms binning
From T100_start-3 s to T100_start+3 s
Blue+Cyan dotted lines: Time interval of the scaled map
From 0.000000 to 4.096000
2 ms binning
From T100_start-1 s to T100_start+1 s

Blue+Cyan dotted lines: Time interval of the scaled map
From 0.000000 to 4.096000
SN=5 or 10 sec. binning (whichever binning is satisfied first)
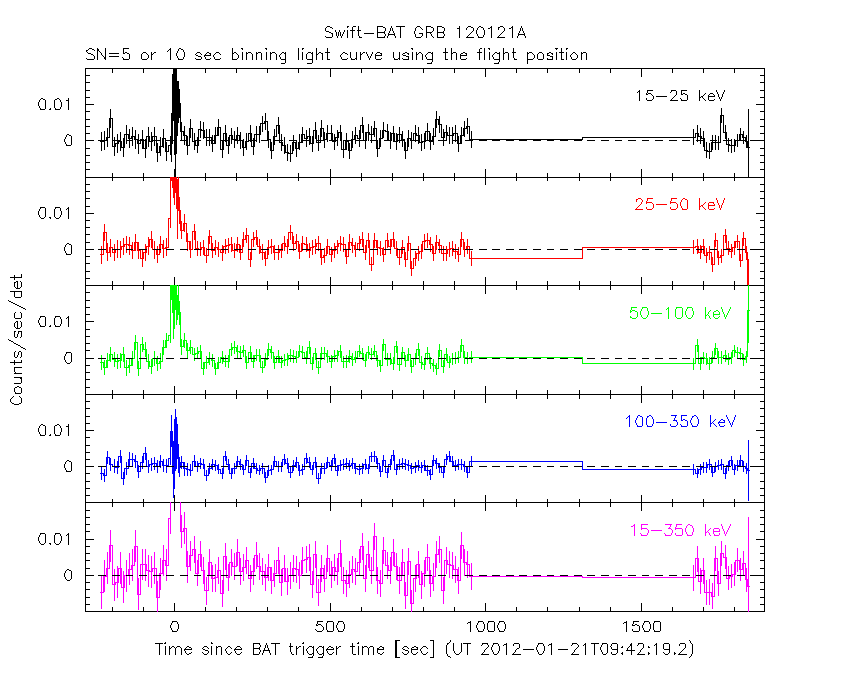
SN=5 or 10 sec. binning (T < 200 sec)

Quad-rate summed light curves (from T0-300s to T0+1000s)
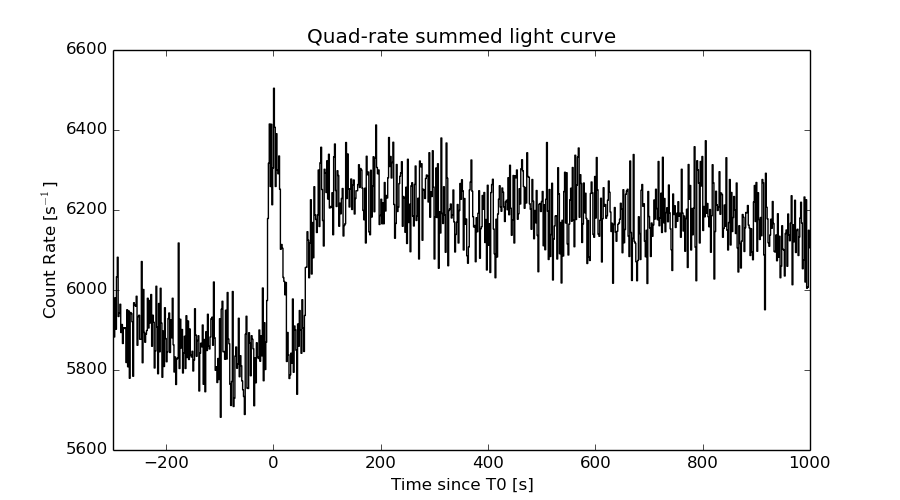
The mask-weighted light curves based on cleaned DPHs

Spectral Evolution

Spectra
Notes:
- 1) The fitting includes the systematic errors.
- 2) When the burst includes telescope slew time periods, the fitting uses an average response file made from multiple 5-s response files through out the slew time plus single time preiod for the non-slew times, and weighted by the total counts in the corresponding time period using addrmf. An average response file is needed becuase a spectral fit using the pre-slew DRM will introduce some errors in both a spectral shape and a normalization if the PHA file contains a lot of the slew/post-slew time interval.
- 3) For fits to more complicated models (e.g. a power-law over a cutoff power-law), the BAT team has decided to require a chi-square improvement of more than 6 for each extra dof.
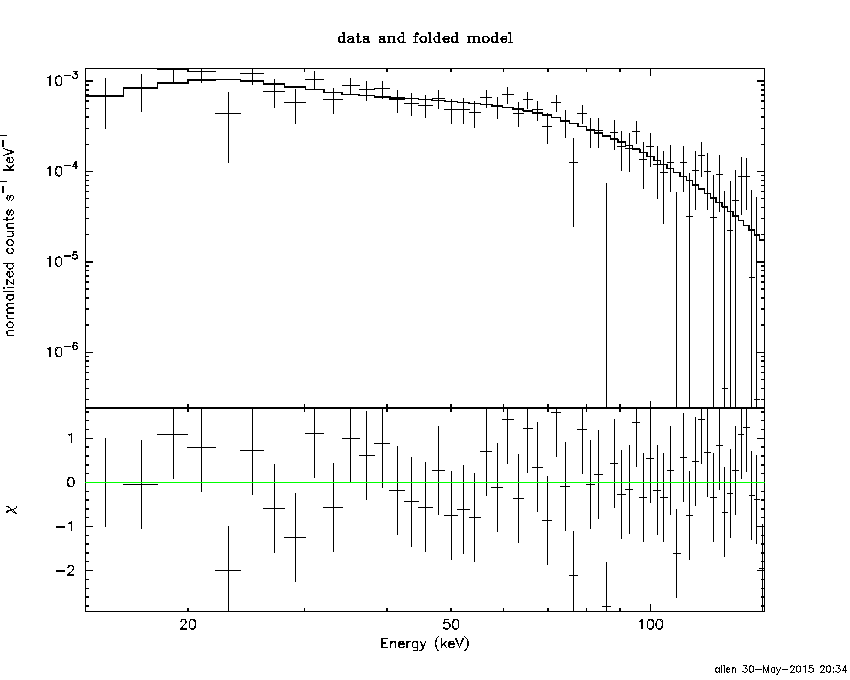
Time averaged spectrum fit using the average DRM
Power-law model

Time interval is from  -11.004 sec. to   19.776 sec.

Spectral model in power-law:
------------------------------------------------------------
Parameters  : value       lower 90%   higher 90%
Photon index: 1.22283     ( -0.133735   0.131331 )
Norm@50keV  : 3.60044E-03    ( -0.000276069   0.000275668 )
------------------------------------------------------------
#Fit statistic : Chi-Squared =          59.15 using 59 PHA bins.
# Reduced chi-squared =          1.038 for     57 degrees of freedom
# Null hypothesis probability =   3.970539e-01

Photon flux (15-150 keV)    in 30.78 sec: 0.424020 ( -0.0345845  0.0347579 ) ph/cm2/s
Energy fluence (15-150 keV)             : 1.11723e-06 ( -8.93072e-08  8.95944e-08 ) ergs/cm2
Cutoff power-law model
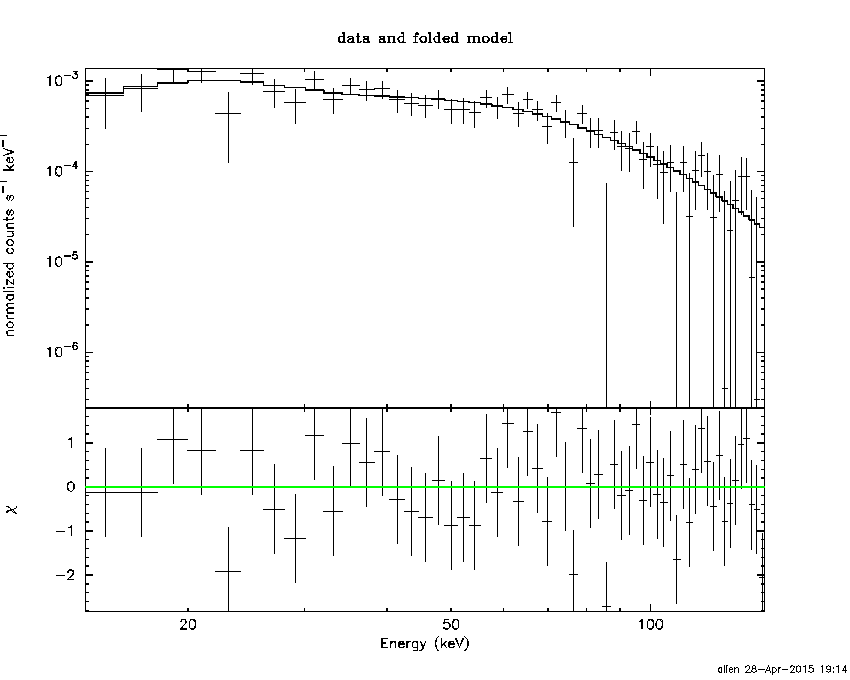
Time interval is from  -11.004 sec. to   19.776 sec.
Spectral model in the cutoff power-law:
------------------------------------------------------------
Parameters  : value       lower 90%   higher 90%
Photon index: 0.365091     ( -0.681221   0.583959 )
Epeak [keV] : 108.100      ( -24.8635 103.261 )
Norm@50keV  : 8.66376E-03    ( -0.00382019   0.00815744 )
------------------------------------------------------------
#Fit statistic : Chi-Squared =          52.47 using 59 PHA bins.
# Reduced chi-squared =         0.9370 for     56 degrees of freedom
# Null hypothesis probability =   6.092783e-01

Photon flux (15-150 keV)    in 30.78 sec: 0.404614 ( -0.036904  0.037024 ) ph/cm2/s
Energy fluence (15-150 keV)             : 1.06877e-06 ( -9.70247e-08  9.66184e-08 ) ergs/cm2
Band function

Time interval is from  -11.004 sec. to   19.776 sec.

Spectral model in the Band function:
------------------------------------------------------------
Parameters  : value       lower 90%   higher 90%
alpha       : -0.365024   ( -0.430871   0.867202 )
beta        : -10.0000    ( 10   5.32907e-15 )
Epeak [keV] : 108.081      ( -17.4898 103.239 )
Norm@50keV   : 8.66451E-03    ( -0.0038202   0.00816348 )
------------------------------------------------------------
#Fit statistic : Chi-Squared =          52.47 using 59 PHA bins.
# Reduced chi-squared =         0.9540 for     55 degrees of freedom
# Null hypothesis probability =   5.718742e-01

Photon flux (15-150 keV)    in 30.78 sec: 0.408864 (    ) ph/cm2/s
Energy fluence (15-150 keV)             : 0 ( 0  0 ) ergs/cm2
Single BB
Spectral model blackbody:
------------------------------------------------------------
Parameters  : value    Lower 90%  Upper 90%
kT [keV]    : 19.5074  (-1.72989  1.9655)
R^2/D10^2   : 2.12153E-02  (-0.00587767   0.00787851)
(R is the radius in km and D10 is the distance to the source in units of 10 kpc)
------------------------------------------------------------
#Fit statistic : Chi-Squared =          66.99 using 59 PHA bins.
# Reduced chi-squared =          1.175 for     57 degrees of freedom
# Null hypothesis probability =   1.717099e-01

Energy  Fluence     90% Error
[keV]   [erg/cm2]   [erg/cm2]
15- 25  4.837e-08   7.372e-09
25- 50  2.369e-07   2.932e-08
50-150  6.658e-07   8.665e-08
15-150  9.511e-07   8.803e-08
Thermal bremsstrahlung (OTTB)
Spectral model: thermal bremsstrahlung
------------------------------------------------------------
Parameters  : value         Lower 90%    Upper 90%
kT [keV]    : 200.000       (      )
Norm        : 1.80901       (-0.139593     0.139556)
------------------------------------------------------------
#Fit statistic : Chi-Squared =          74.20 using 59 PHA bins.
# Reduced chi-squared =          1.302 for     57 degrees of freedom
# Null hypothesis probability =   6.257706e-02

Energy  Fluence     90% Error
[keV]   [erg/cm2]   [erg/cm2]
15- 25  1.386e-07   1.376e-08
25- 50  2.667e-07   5.128e-08
50-150  5.849e-07   1.988e-07
15-150  9.901e-07   2.715e-07
Double BB
Spectral model: bbodyrad<1> + bbodyrad<2>
------------------------------------------------------------
Parameters  : value         Lower 90%    Upper 90%
kT1 [keV]   : 7.52947        (-3.1609      5.03111)
R1^2/D10^2  : 0.203847        (-0.150188      1.24077)
kT2 [keV]   : 25.1352        (-4.32812      13.9419)
R2^2/D10^2  : 7.87737E-03    (-0.0064271   0.00820187)
------------------------------------------------------------
#Fit statistic : Chi-Squared =          52.60 using 59 PHA bins.
# Reduced chi-squared =         0.9564 for     55 degrees of freedom
# Null hypothesis probability =   5.668550e-01

Energy  Fluence     90% Error
[keV]   [erg/cm2]   [erg/cm2]
15- 25  8.779e-08   4.349e-08
25- 50  2.472e-07   1.026e-07
50-150  7.272e-07   3.154e-07
15-150  1.062e-06   3.606e-07
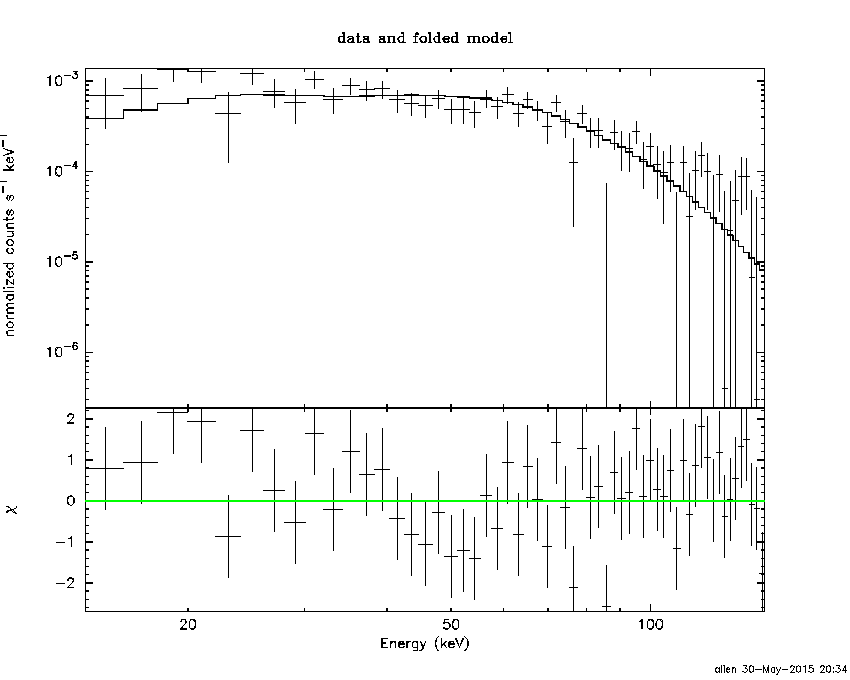
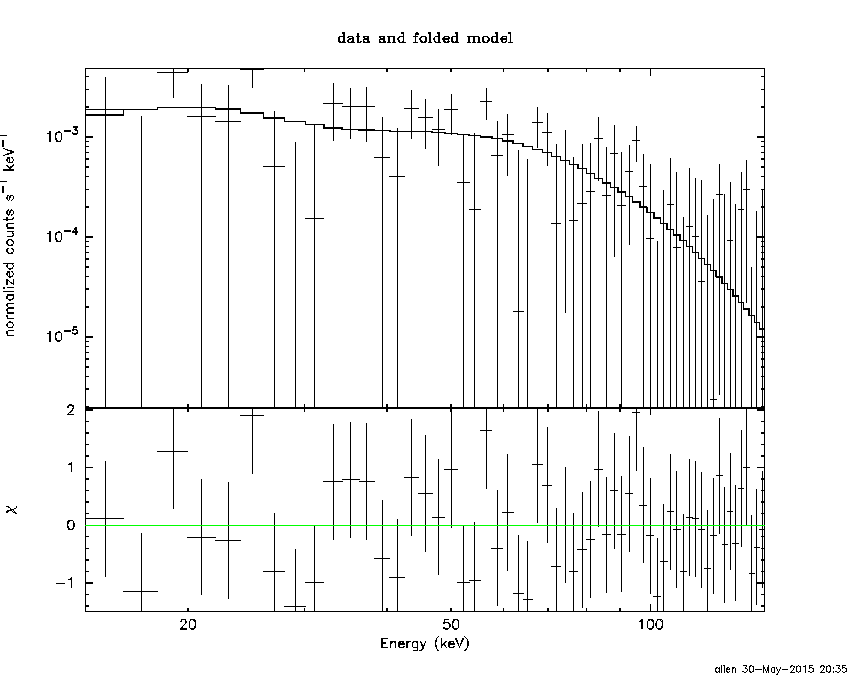
Peak spectrum fit
Power-law model

Time interval is from    2.860 sec. to    3.860 sec.

Spectral model in power-law:
------------------------------------------------------------
Parameters  : value       lower 90%   higher 90%
Photon index: 1.39693     ( -0.414464   0.408759 )
Norm@50keV  : 6.01987E-03    ( -0.00147531   0.00147376 )
------------------------------------------------------------
#Fit statistic : Chi-Squared =          40.10 using 59 PHA bins.
# Reduced chi-squared =         0.7035 for     57 degrees of freedom
# Null hypothesis probability =   9.563336e-01

Photon flux (15-150 keV)    in 1 sec: 0.732573 ( -0.188033  0.190126 ) ph/cm2/s
Energy fluence (15-150 keV)             : 5.82063e-08 ( -1.50628e-08  1.52551e-08 ) ergs/cm2
Cutoff power-law model

Time interval is from    2.860 sec. to    3.860 sec.
Spectral model in the cutoff power-law:
------------------------------------------------------------
Parameters  : value       lower 90%   higher 90%
Photon index: 2.86190E-02     ( -2.97618   1.06336 )
Epeak [keV] : 78.0907      ( -21.5248 -78.0907 )
Norm@50keV  : 2.59964E-02    ( -0.0259964   0.473638 )
------------------------------------------------------------
#Fit statistic : Chi-Squared =          38.44 using 59 PHA bins.
# Reduced chi-squared =         0.6864 for     56 degrees of freedom
# Null hypothesis probability =   9.647816e-01

Photon flux (15-150 keV)    in 1 sec: 0.685236 ( -0.192096  0.200958 ) ph/cm2/s
Energy fluence (15-150 keV)             : 5.43697e-08 ( -1.57787e-08  1.62317e-08 ) ergs/cm2
Band function

Time interval is from    2.860 sec. to    3.860 sec.

Spectral model in the Band function:
------------------------------------------------------------
Parameters  : value       lower 90%   higher 90%
alpha       : -2.80561E-02   ( -1.37593   3.0486 )
beta        : -10.0000    ( 10   3.55271e-15 )
Epeak [keV] : 78.0593      ( -24.571 120.267 )
Norm@50keV   : 2.60183E-02    ( -0.0260183   0.469227 )
------------------------------------------------------------
#Fit statistic : Chi-Squared =          38.44 using 59 PHA bins.
# Reduced chi-squared =         0.6988 for     55 degrees of freedom
# Null hypothesis probability =   9.561683e-01

Photon flux (15-150 keV)    in 1 sec: 0.703878 (    ) ph/cm2/s
Energy fluence (15-150 keV)             : 0 ( 0  0 ) ergs/cm2
Single BB

Spectral model blackbody:
------------------------------------------------------------
Parameters  : value    Lower 90%  Upper 90%
kT [keV]    : 17.2633  (-4.10199  5.76009)
R^2/D10^2   : 5.42755E-02  (-0.0344857   0.0861501)
(R is the radius in km and D10 is the distance to the source in units of 10 kpc)
------------------------------------------------------------
#Fit statistic : Chi-Squared =          39.35 using 59 PHA bins.
# Reduced chi-squared =         0.6903 for     57 degrees of freedom
# Null hypothesis probability =   9.640346e-01

Energy  Fluence     90% Error
[keV]   [erg/cm2]   [erg/cm2]
15- 25  3.280e-09   1.741e-09
25- 50  1.469e-08   7.446e-09
50-150  3.141e-08   1.708e-08
15-150  4.938e-08   2.186e-08
Thermal bremsstrahlung (OTTB)

Spectral model: thermal bremsstrahlung
------------------------------------------------------------
Parameters  : value         Lower 90%    Upper 90%
kT [keV]    : 199.363       (-107.119      -199.363)
Norm        : 3.07936       (-0.751949     0.752026)
------------------------------------------------------------
#Fit statistic : Chi-Squared =          39.90 using 59 PHA bins.
# Reduced chi-squared =         0.7000 for     57 degrees of freedom
# Null hypothesis probability =   9.584820e-01

Energy  Fluence     90% Error
[keV]   [erg/cm2]   [erg/cm2]
15- 25  7.668e-09   4.570e-09
25- 50  1.475e-08   8.985e-09
50-150  3.235e-08   1.892e-08
15-150  5.477e-08   3.135e-08
Double BB
Spectral model: bbodyrad<1> + bbodyrad<2>
------------------------------------------------------------
Parameters  : value         Lower 90%    Upper 90%
kT1 [keV]   : 4.35703        (-4.35766      188.297)
R1^2/D10^2  : 2.44189        (-2.44033      -2.44033)
kT2 [keV]   : 19.2359        (-5.20969      -19.2362)
R2^2/D10^2  : 3.51243E-02    (-0.0351221   0.0760347)
------------------------------------------------------------
#Fit statistic : Chi-Squared =          38.18 using 59 PHA bins.
# Reduced chi-squared =         0.6942 for     55 degrees of freedom
# Null hypothesis probability =   9.589899e-01

Energy  Fluence     90% Error
[keV]   [erg/cm2]   [erg/cm2]
15- 25  5.854e-09   3.561e-09
25- 50  1.385e-08   7.910e-09
50-150  3.366e-08   2.117e-08
15-150  5.337e-08   2.953e-08
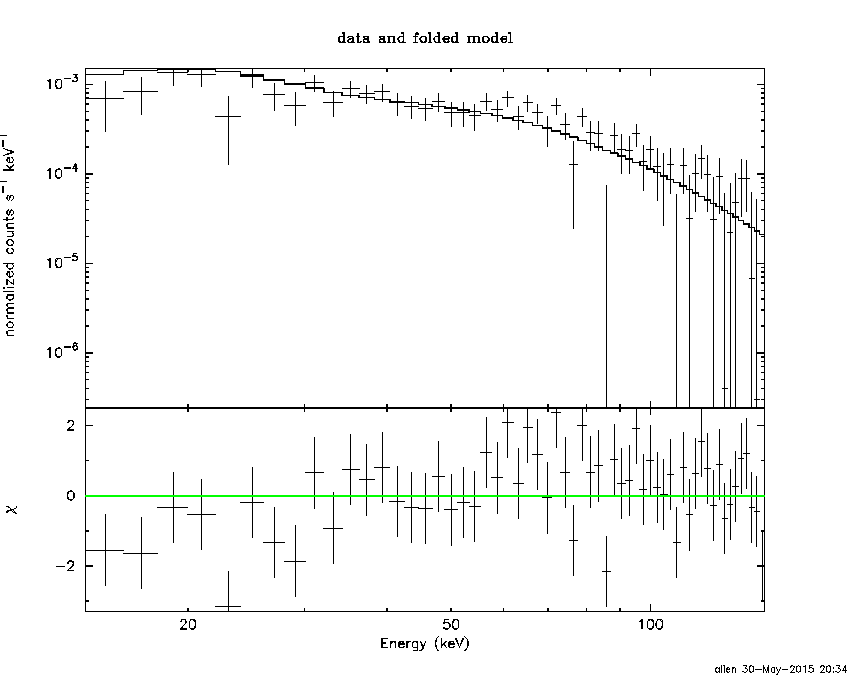
Pre-slew spectrum (Pre-slew PHA with pre-slew DRM)
Power-law model
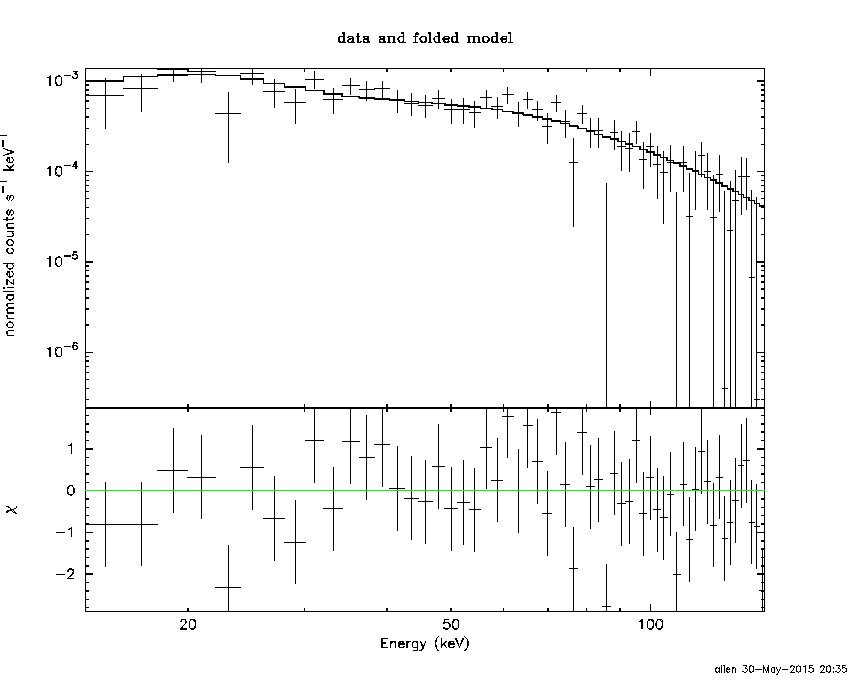
Spectral model in power-law:
------------------------------------------------------------
Parameters  : value       lower 90%   higher 90%
Photon index: 1.22283     ( -0.133735   0.131331 )
Norm@50keV  : 3.60044E-03    ( -0.000276069   0.000275668 )
------------------------------------------------------------
#Fit statistic : Chi-Squared =          59.15 using 59 PHA bins.
# Reduced chi-squared =          1.038 for     57 degrees of freedom
# Null hypothesis probability =   3.970539e-01

Photon flux (15-150 keV)    in 30.78 sec: 0.424020 ( -0.0345845  0.0347579 ) ph/cm2/s
Energy fluence (15-150 keV)             : 1.11723e-06 ( -8.93072e-08  8.95944e-08 ) ergs/cm2
Cutoff power-law model

Spectral model in the cutoff power-law:
------------------------------------------------------------
Parameters  : value       lower 90%   higher 90%
Photon index: 0.365091     ( -0.681221   0.583959 )
Epeak [keV] : 108.100      ( -24.8635 103.261 )
Norm@50keV  : 8.66376E-03    ( -0.00382019   0.00815744 )
------------------------------------------------------------
#Fit statistic : Chi-Squared =          52.47 using 59 PHA bins.
# Reduced chi-squared =         0.9370 for     56 degrees of freedom
# Null hypothesis probability =   6.092783e-01

Photon flux (15-150 keV)    in 30.78 sec: 0.404614 ( -0.036904  0.037024 ) ph/cm2/s
Energy fluence (15-150 keV)             : 1.06877e-06 ( -9.70247e-08  9.66184e-08 ) ergs/cm2
Band function

Spectral model in the Band function:
------------------------------------------------------------
Parameters  : value       lower 90%   higher 90%
alpha       : -0.365024   ( -0.430871   0.867202 )
beta        : -10.0000    ( 10   1.77636e-15 )
Epeak [keV] : 108.081      ( -17.4898 103.239 )
Norm@50keV   : 8.66451E-03    ( -0.0038202   0.00816348 )
------------------------------------------------------------
#Fit statistic : Chi-Squared =          52.47 using 59 PHA bins.
# Reduced chi-squared =         0.9540 for     55 degrees of freedom
# Null hypothesis probability =   5.718742e-01

Photon flux (15-150 keV)    in 30.78 sec: 0.408864 (    ) ph/cm2/s
Energy fluence (15-150 keV)             : 0 ( 0  0 ) ergs/cm2
S(25-50 keV) vs. S(50-100 keV) plot

S(25-50 keV)  = 2.38e-07
S(50-100 keV) = 4.08e-07
T90 vs. Hardness ratio plot
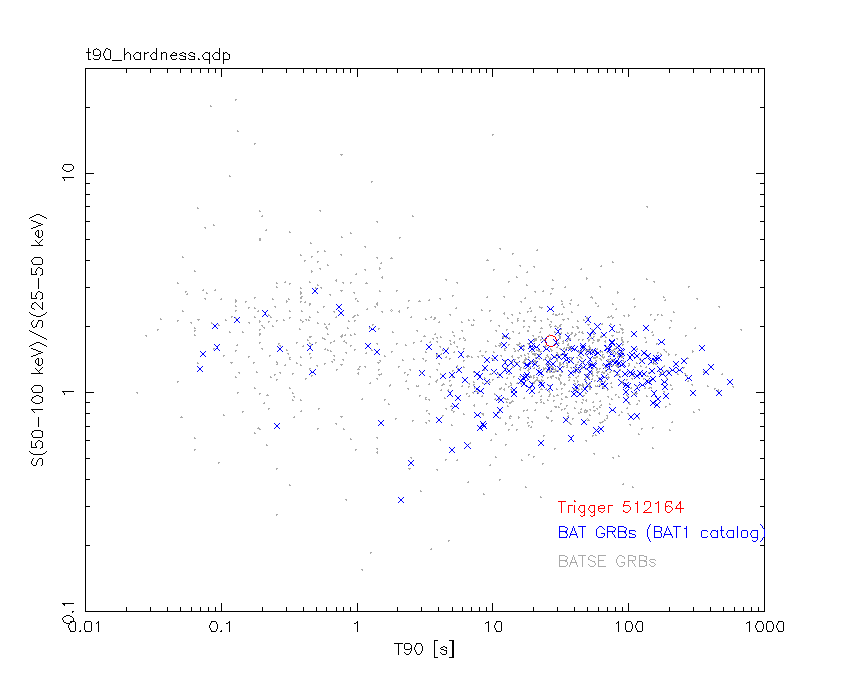
T90                                   = 26.7999999523163 sec.
Hardness ratio (energy fluence ratio) = 1.71429
Color vs. Color plot

Count Ratio  (25-50 keV) / (15-25 keV) = 1.99467
Count Ratio (50-100 keV) / (15-25 keV) = 1.99104
Mask shadow pattern

IMX = 5.830556130485854E-01, IMY = 2.858521460019826E-01
TIME vs. PHA plot around the trigger time

Blue+Cyan dotted lines: Time interval of the scaled map
From 0.000000 to 4.096000
TIME vs. DetID plot around the trigger time
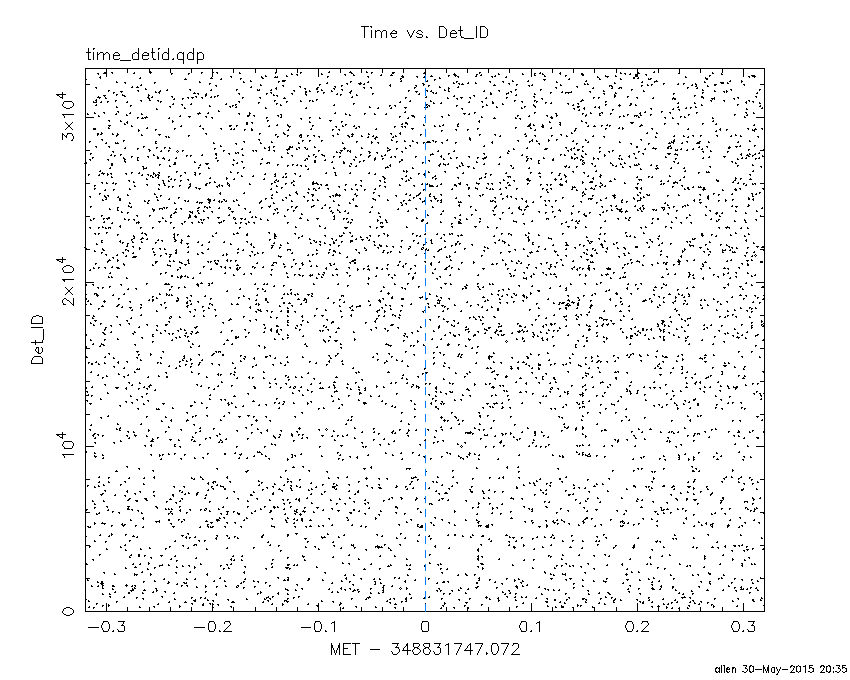
Blue+Cyan dotted lines: Time interval of the scaled map
From 0.000000 to 4.096000
100 us light curve (15-350 keV)
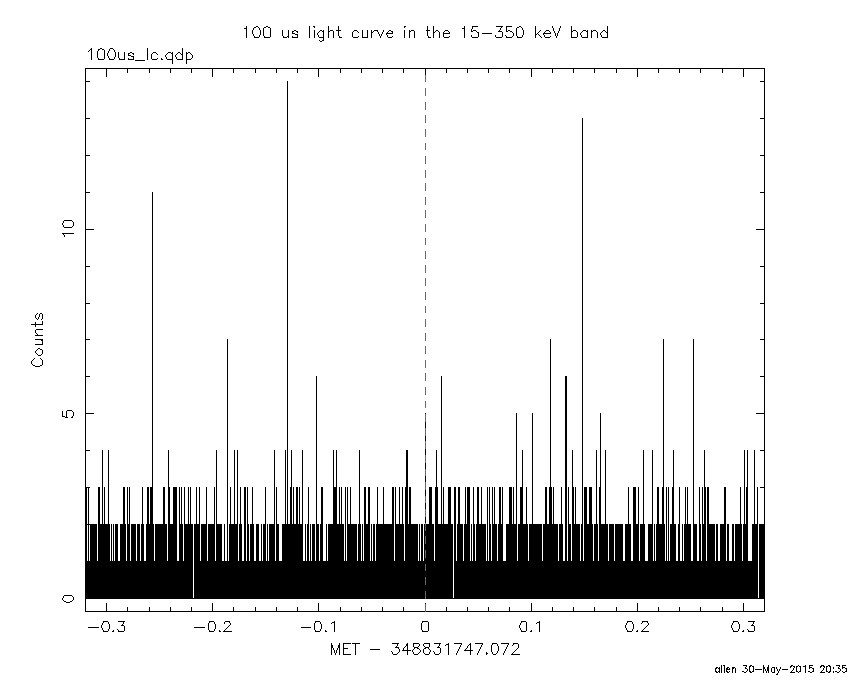
Blue+Cyan dotted lines: Time interval of the scaled map
From 0.000000 to 4.096000
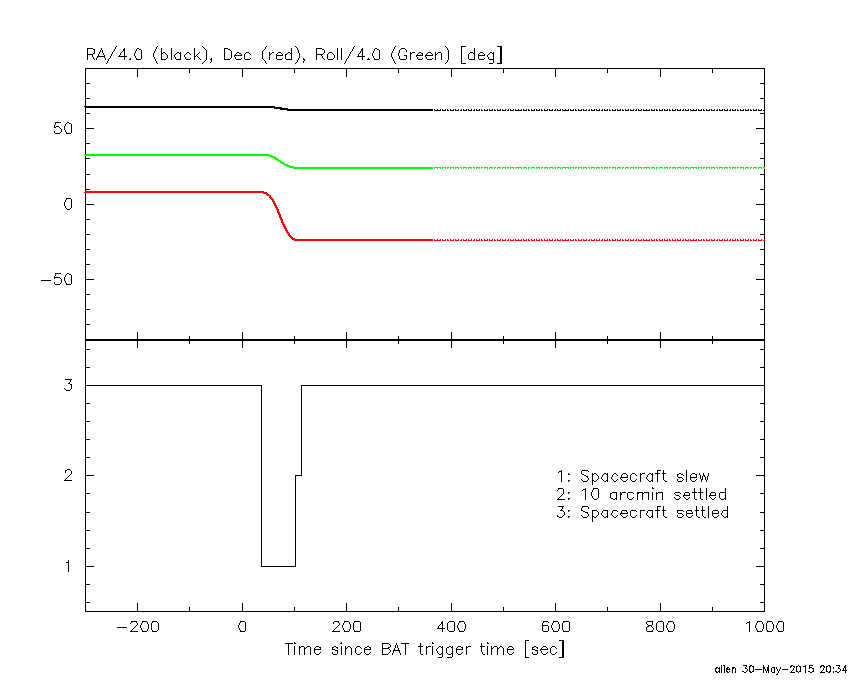
Spacecraft aspect plot
Bright source in the pre-burst/pre-slew/post-slew images
Pre-burst image of 15-350 keV band
Time interval of the image:
-239.072000 -11.004000

# RAcent  DECcent POSerr Theta    Phi  PeakCts   SNR AngSep     Name
#  [deg]    [deg]    ['] [deg]  [deg]                   [']
244.9867 -15.6381    0.4  27.0  -11.9   7.4470  32.2    0.4	Sco X-1
254.4603  35.3411    2.5  27.8  131.5   1.2841   4.6    0.2	Her X-1
255.9904 -37.8301    2.4  45.7  -38.8   2.3248   4.9    0.9	4U 1700-377
256.5503 -36.3908    4.7  44.2  -39.3   1.0615   2.5    5.9	GX 349+2
262.9382 -24.7023   22.5  32.8  -49.0   0.1521   0.5    4.7	GX 1+4
268.4645  -1.4287    3.1  13.6  -89.1   0.8879   3.7    6.0	SW J1753.5-0127
270.2099 -25.0913    2.6  34.9  -60.3   1.5636   4.4    4.1	GX 5-1
270.2510 -25.7017    5.1  35.4  -60.0   0.8255   2.3    3.7	GRS 1758-258
274.0141 -14.0103    2.5  26.7  -76.8   1.3552   4.6    1.6	GX 17+2
275.9459 -30.3935    5.7  41.7  -64.4   1.5321   2.0    1.9	H1820-303
288.7876  10.9523    0.8  30.1 -139.8   3.9421  15.3    0.8	GRS 1915+105
299.5981  35.1200    5.8  46.5 -173.6   0.7975   2.0    4.9	Cyg X-1
308.1301  40.8629   24.8  55.0 -176.7   0.3939   0.5    5.5	Cyg X-3
263.1256 -33.9091    4.1  42.0  -47.3   1.2509   2.8    8.1	GX 354-0
317.6917  29.8915    3.8  59.5 -161.7   4.9696   3.1 ------	UNKNOWN
275.2747 -33.4952    2.8  44.3  -61.7   4.1590   4.1 ------	UNKNOWN
Pre-slew background subtracted image of 15-350 keV band
Time interval of the image:
-11.004000 19.776000

# RAcent  DECcent POSerr Theta    Phi  PeakCts   SNR AngSep     Name
#  [deg]    [deg]    ['] [deg]  [deg]                   [']
244.9427 -15.7267    6.6  27.1  -11.9   0.1298   1.8    5.6	Sco X-1
254.5613  35.2833   25.1  27.7  131.7   0.0428   0.5    6.2	Her X-1
256.0057 -37.7763    3.4  45.7  -38.8   0.5122   3.4    4.2	4U 1700-377
256.4325 -36.4248  113.0  44.3  -39.2   0.0147   0.1    0.2	GX 349+2
263.2006 -24.7025   31.2  32.9  -49.5   0.0349   0.4   10.8	GX 1+4
268.5772  -1.4448    0.0  13.7  -89.4  -0.1156  -1.6   12.6	SW J1753.5-0127
270.3578 -24.9671    5.7  34.8  -60.6  -0.2281  -2.0    7.8	GX 5-1
270.3786 -25.6332   28.8  35.4  -60.2  -0.0478  -0.4    7.8	GRS 1758-258
274.0324 -14.2308    0.0  26.9  -76.6   0.1307   1.5   11.8	GX 17+2
275.7249 -30.4040    5.9  41.7  -64.1   0.4690   1.9   10.6	H1820-303
288.7019  10.8371    9.8  30.0 -139.6   0.1009   1.2    8.6	GRS 1915+105
299.5647  35.3140    4.8  46.6 -173.8  -0.3204  -2.4    6.9	Cyg X-1
308.1788  40.8825    4.5  55.0 -176.7  -0.6535  -2.5    5.2	Cyg X-3
263.0143 -33.8528    5.2  41.9  -47.2  -0.3313  -2.2    1.7	GX 354-0
221.3393  26.2064    2.4  39.7   80.7   1.3009   4.8 ------	UNKNOWN
252.1237  26.6952    2.8  19.8  121.6   0.3024   4.1 ------	UNKNOWN
249.3630 -23.9605    0.6  33.0  -26.1   1.5695  19.0 ------	UNKNOWN
264.0835 -15.5535    2.2  24.0  -54.9   0.4133   5.3 ------	UNKNOWN
317.1054  27.3263    1.9  58.6 -158.8   2.2042   6.0 ------	UNKNOWN
Post-slew image of 15-350 keV band
Time interval of the image:
103.028600 962.961300
1663.928000 1844.138000

# RAcent  DECcent POSerr Theta    Phi  PeakCts   SNR AngSep     Name
#  [deg]    [deg]    ['] [deg]  [deg]                   [']
244.9807 -15.6451    0.3   9.3  146.6  30.7929  45.6    0.3	Sco X-1
255.9700 -37.8446    0.4  15.0  -26.9  18.4065  26.6    0.8	4U 1700-377
256.4377 -36.4333    2.0  13.9  -30.7   4.0109   5.8    0.6	GX 349+2
262.9132 -24.7433    3.9  12.4  -90.0   2.0721   2.9    5.2	GX 1+4
264.5451 -44.3153    0.0  23.8  -34.0  -0.5665  -0.8   11.7	4U 1735-44
268.3178  -1.4396    3.3  29.1 -144.4   2.5646   3.5    3.1	SW J1753.5-0127
270.2349 -25.0929    2.1  19.0  -88.6   4.0297   5.5    2.8	GX 5-1
270.1361 -25.6738  102.3  18.9  -86.8   0.0890   0.1    9.9	GRS 1758-258
273.9810 -14.1512    3.1  25.2 -114.8   3.3794   3.7    7.0	GX 17+2
275.7623 -30.4810    5.7  24.3  -75.0   1.7729   2.0   10.8	H1820-303
285.0113 -25.0527   11.7  32.4  -86.9  -1.2523  -1.0    8.0	HT1900.1-2455
262.8316 -33.9801    8.8  15.4  -52.9   0.9428   1.3   11.7	GX 354-0
257.7068  17.8912    2.7  42.7 -174.5   4.9432   4.3 ------	UNKNOWN
256.8236 -14.8804    3.7  11.5 -147.3   1.9769   3.1 ------	UNKNOWN
269.7219  30.3061    3.7  57.7 -165.5  11.5314   3.2 ------	UNKNOWN
Plot creation:
Sat May 30 20:35:55 EDT 2015