Special notes of this burst
Image
Pre-slew 15.0-350.0 keV image (Event data)

#   RAcent    DECcent   POSerr    Theta     Phi              Peak Cts       SNR   Name
   43.0866   -18.0375   0.0128    41.9362   -51.7517         0.8557065     15.106 TRIG_00514709

Foreground time interval of the image:
 -0.624   5.376 (delta_t =   6.000 [sec])
Background time interval of the image:
-239.624  -0.624 (delta_t = 239.000 [sec])
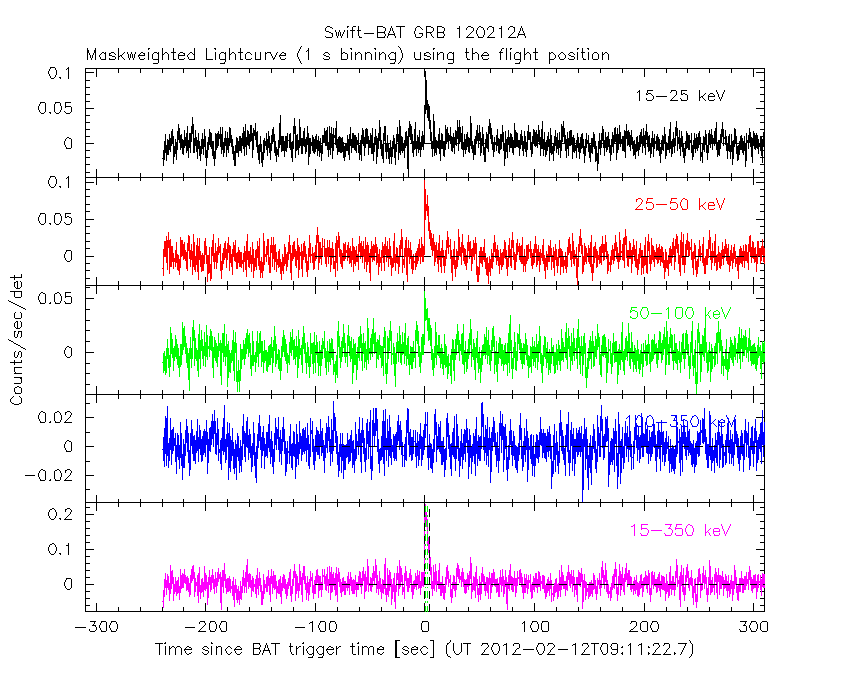
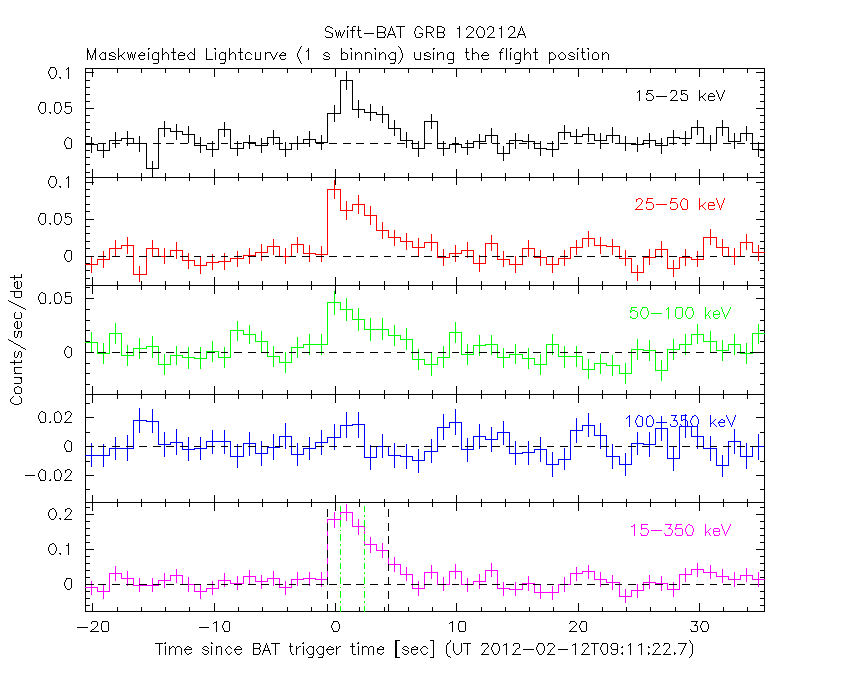
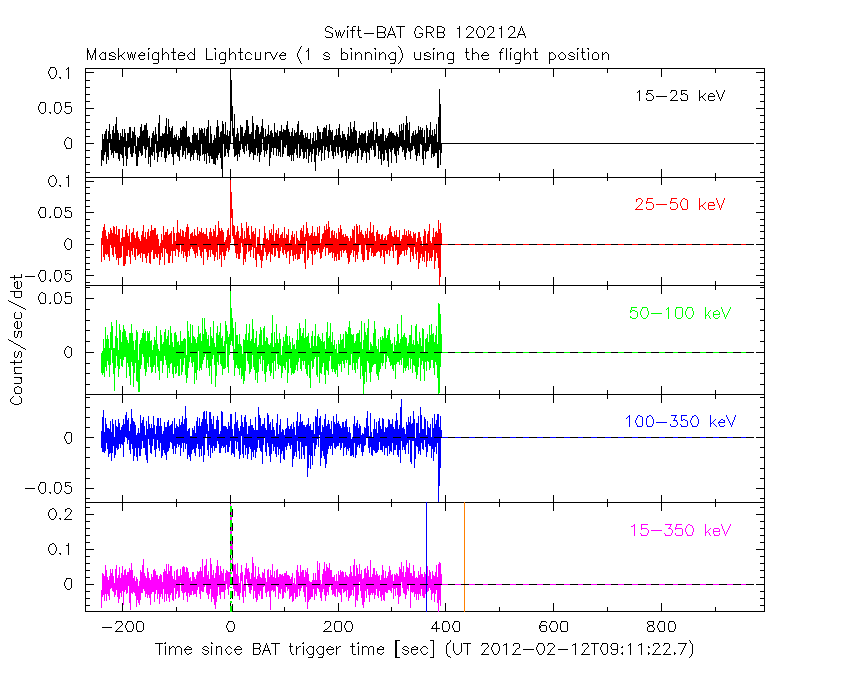
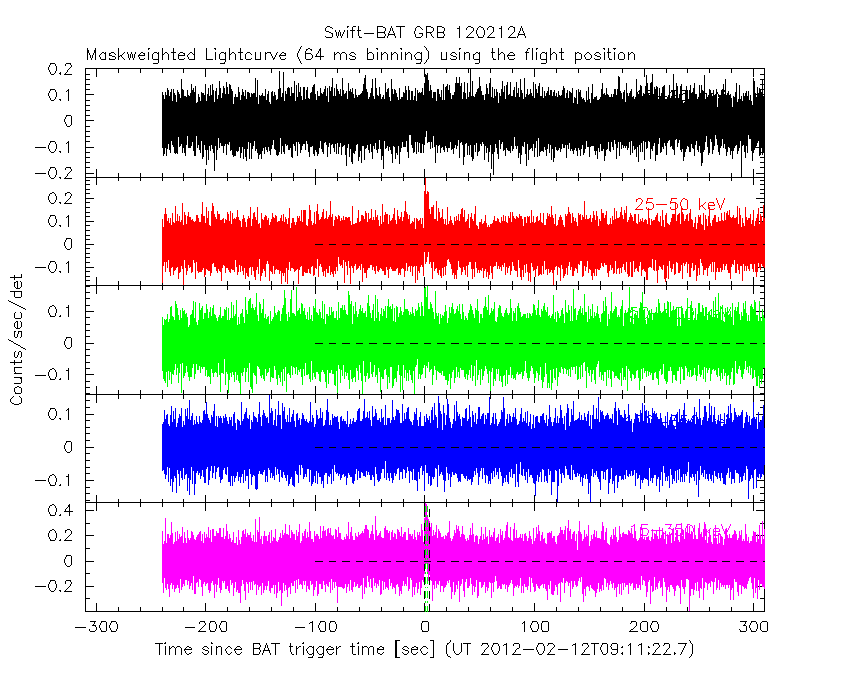
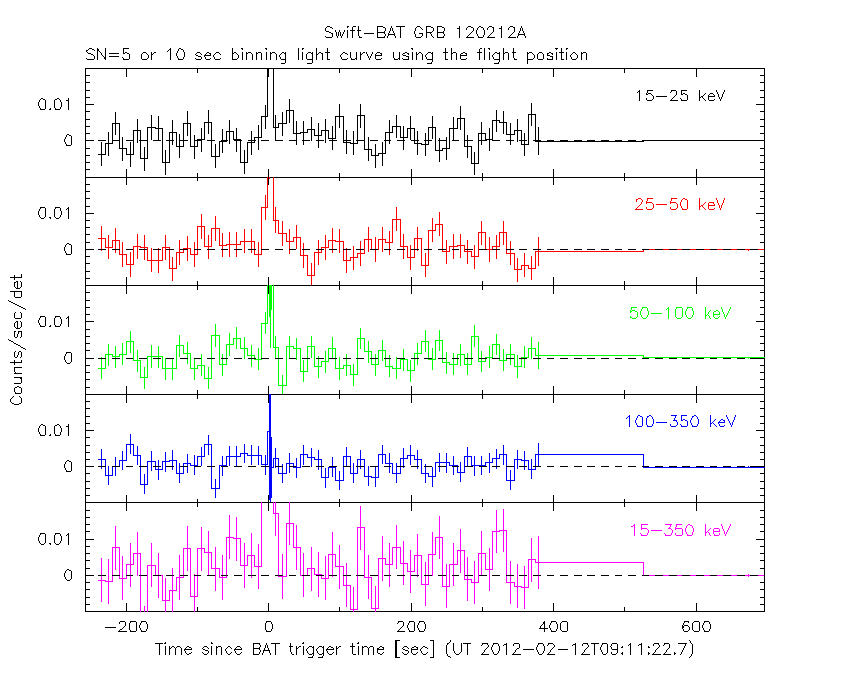
Lightcurves
Notes:
- 1) The mask-weighted light curves are using the flight position.
- 2) Multiple plots of different time binning/intervals are shown to cover all scenarios of short/long GRBs, rate/image triggers, and real/false positives.
- 3) For all the mask-weighted lightcurves, the y-axis units are counts/sec/det where a det is 0.4 x 0.4 = 0.16 sq cm.
- 4) The verticle lines correspond to following: green dotted lines are T50 interval, black dotted lines are T90 interval, blue solid line(s) is a spacecraft slew start time, and orange solid line(s) is a spacecraft slew end time.
- 5) Time of each bin is in the middle of the bin.
1 s binning
From T0-310 s to T0+310 s
From T100_start - 20 s to T100_end + 30 s
Full time interval
64 ms binning
Full time interval
From T100_start to T100_end
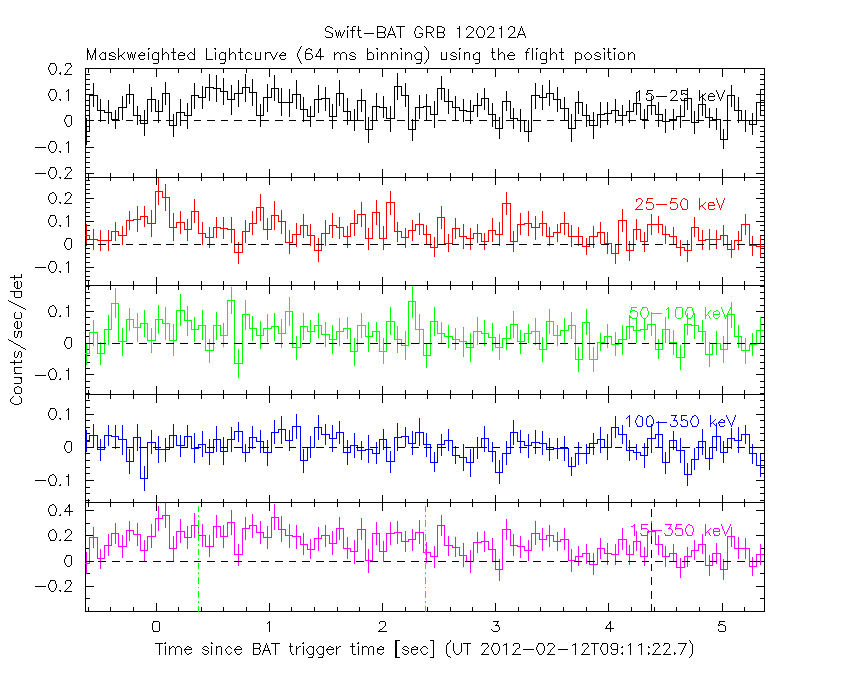
From T0-5 sec to T0+5 sec

16 ms binning
From T100_start-5 s to T100_start+5 s
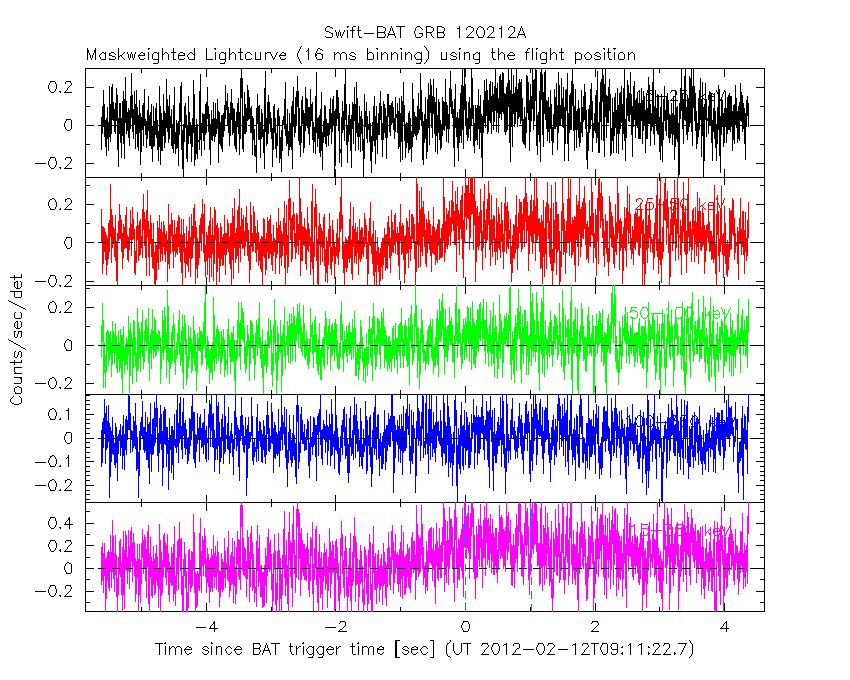
Blue+Cyan dotted lines: Time interval of the scaled map
From 0.000000 to 1.024000
8 ms binning
From T100_start-3 s to T100_start+3 s
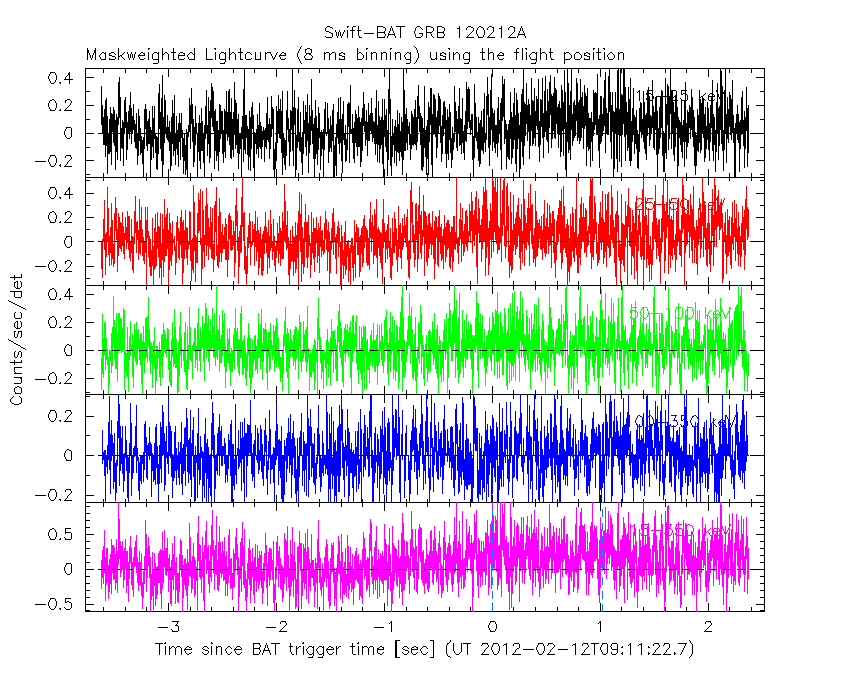
Blue+Cyan dotted lines: Time interval of the scaled map
From 0.000000 to 1.024000
2 ms binning
From T100_start-1 s to T100_start+1 s
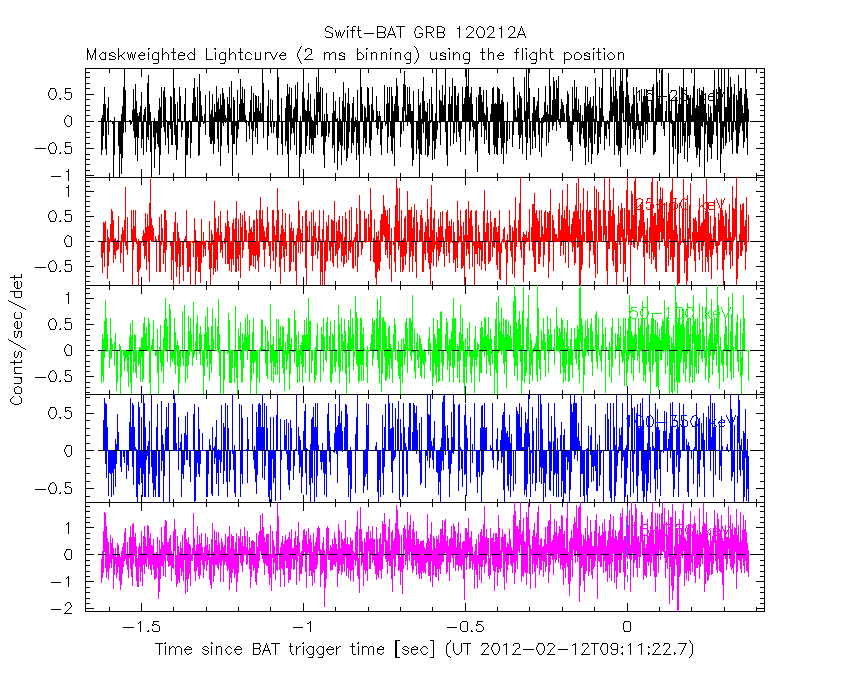
Blue+Cyan dotted lines: Time interval of the scaled map
From 0.000000 to 1.024000
SN=5 or 10 sec. binning (whichever binning is satisfied first)
SN=5 or 10 sec. binning (T < 200 sec)

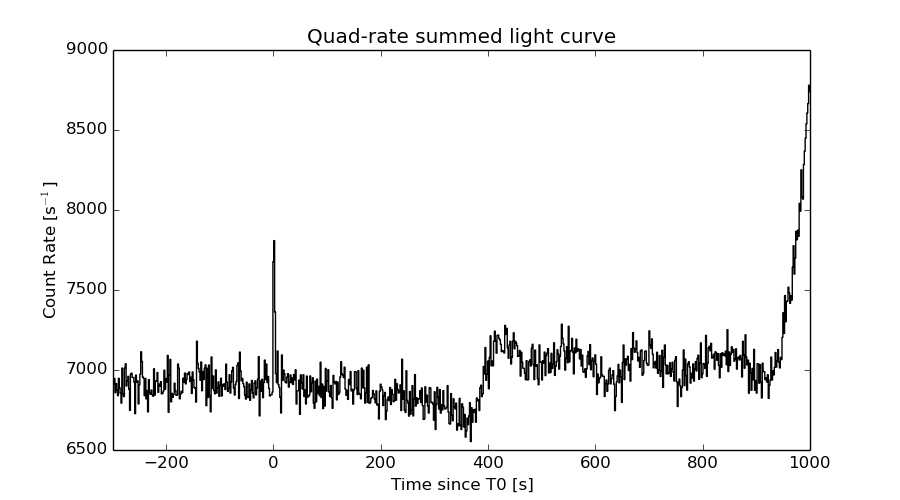
Quad-rate summed light curves (from T0-300s to T0+1000s)
The mask-weighted light curves based on cleaned DPHs

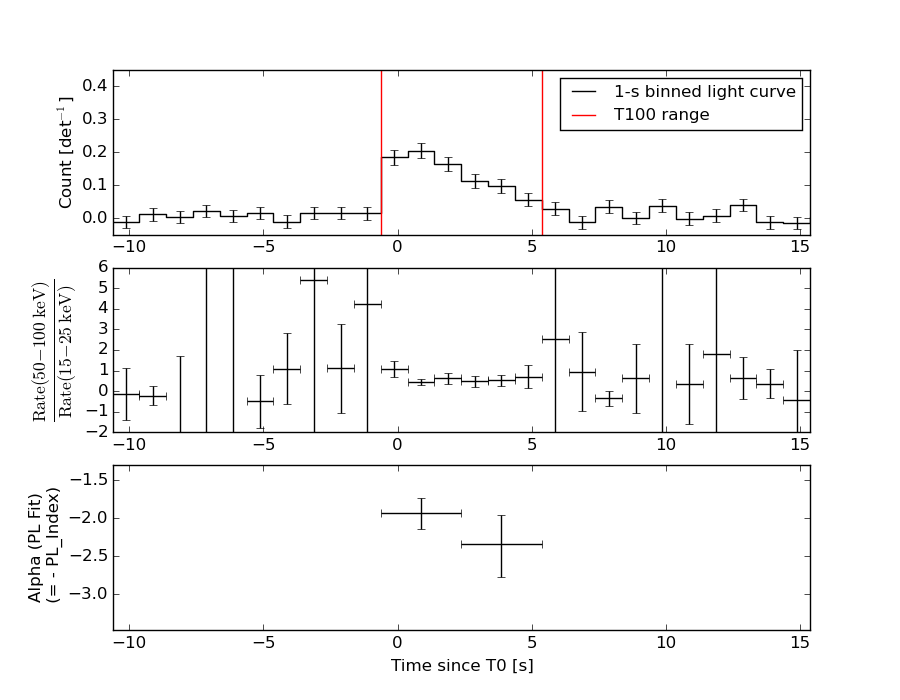
Spectral Evolution
Spectra
Notes:
- 1) The fitting includes the systematic errors.
- 2) When the burst includes telescope slew time periods, the fitting uses an average response file made from multiple 5-s response files through out the slew time plus single time preiod for the non-slew times, and weighted by the total counts in the corresponding time period using addrmf. An average response file is needed becuase a spectral fit using the pre-slew DRM will introduce some errors in both a spectral shape and a normalization if the PHA file contains a lot of the slew/post-slew time interval.
- 3) For fits to more complicated models (e.g. a power-law over a cutoff power-law), the BAT team has decided to require a chi-square improvement of more than 6 for each extra dof.
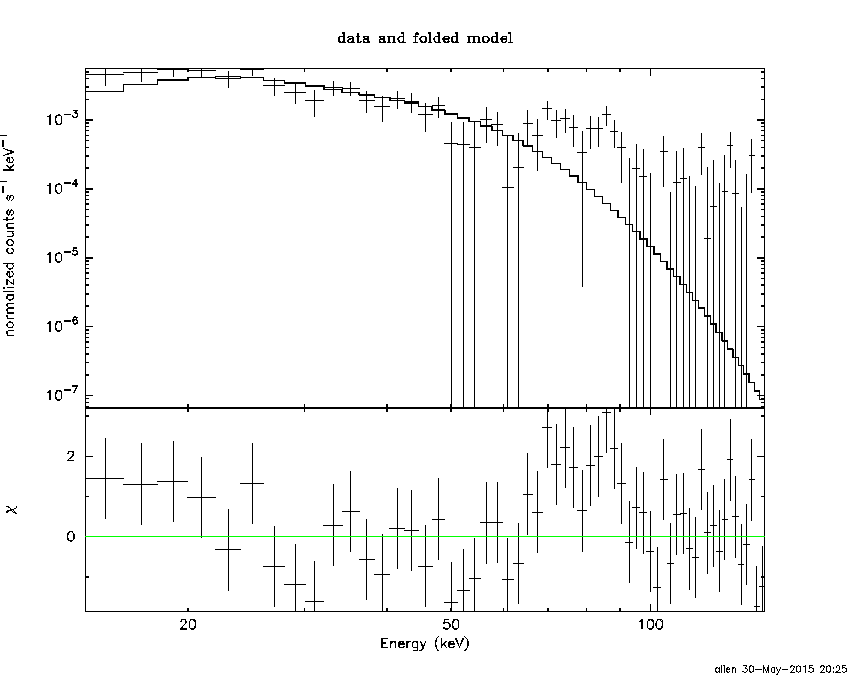
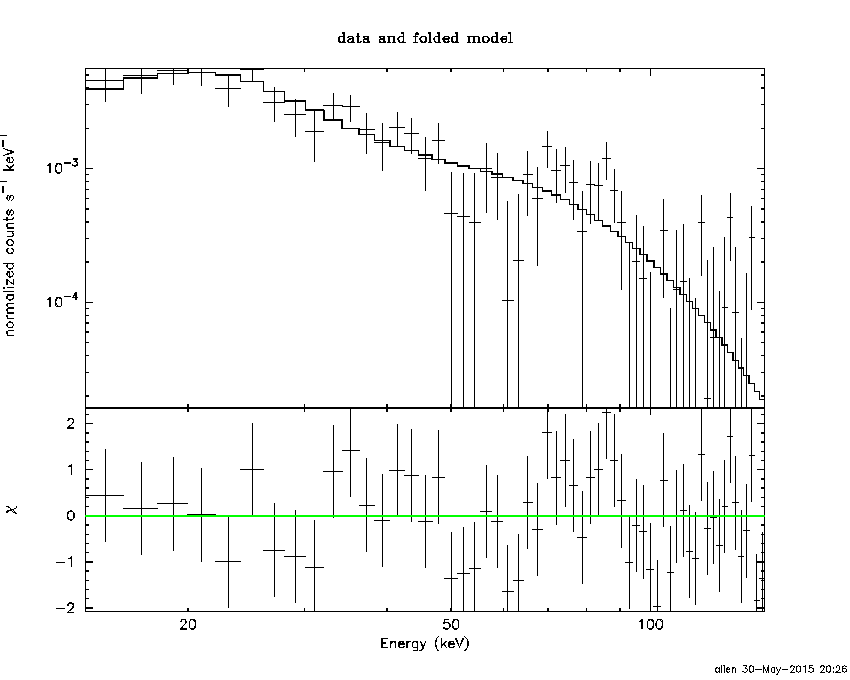
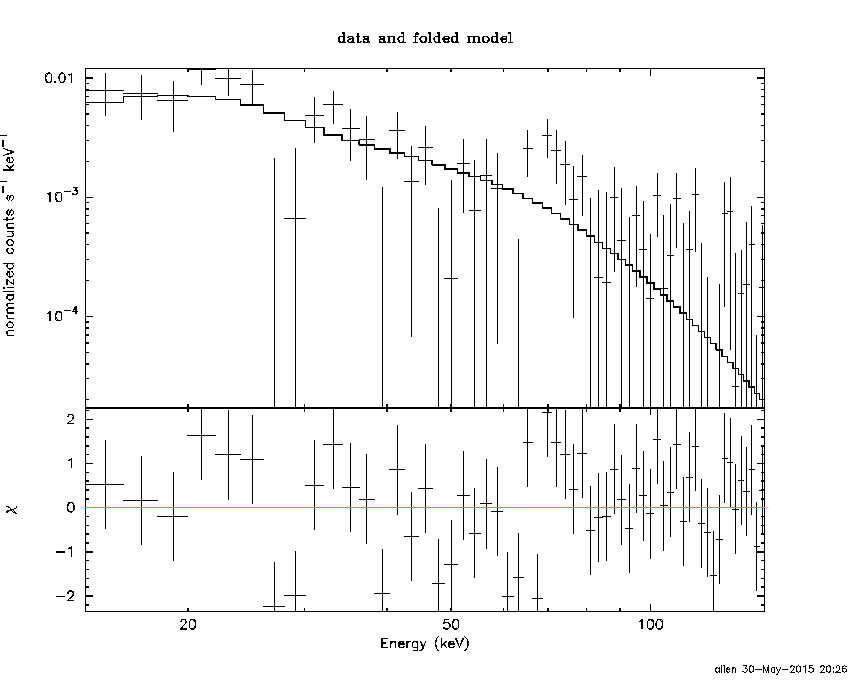
Time averaged spectrum fit using the average DRM
Power-law model

Time interval is from   -0.624 sec. to    5.376 sec.

Spectral model in power-law:
------------------------------------------------------------
Parameters  : value       lower 90%   higher 90%
Photon index: 2.05843     ( -0.185551   0.196191 )
Norm@50keV  : 8.55670E-03    ( -0.00109215   0.00106551 )
------------------------------------------------------------
#Fit statistic : Chi-Squared =          59.81 using 59 PHA bins.
# Reduced chi-squared =          1.049 for     57 degrees of freedom
# Null hypothesis probability =   3.741906e-01

Photon flux (15-150 keV)    in 6 sec: 1.31923 ( -0.133265  0.13335 ) ph/cm2/s
Energy fluence (15-150 keV)             : 4.75269e-07 ( -5.53945e-08  5.62215e-08 ) ergs/cm2
Cutoff power-law model

Time interval is from   -0.624 sec. to    5.376 sec.
Spectral model in the cutoff power-law:
------------------------------------------------------------
Parameters  : value       lower 90%   higher 90%
Photon index: 1.74434     ( -0.747698   0.451377 )
Epeak [keV] : 35.4667      ( -30.4868 -35.4667 )
Norm@50keV  : 1.28633E-02    (     )
------------------------------------------------------------
#Fit statistic : Chi-Squared =          59.13 using 59 PHA bins.
# Reduced chi-squared =          1.056 for     56 degrees of freedom
# Null hypothesis probability =   3.618799e-01

Photon flux (15-150 keV)    in 6 sec: 1.30380 ( -0.13678  0.13681 ) ph/cm2/s
Energy fluence (15-150 keV)             : 4.63288e-07 ( -6.04566e-08  6.13524e-08 ) ergs/cm2
Band function

Time interval is from   -0.624 sec. to    5.376 sec.

Spectral model in the Band function:
------------------------------------------------------------
Parameters  : value       lower 90%   higher 90%
alpha       : -1.74364   ( -3.0879   0.806345 )
beta        : -10.0000    ( 10   1.06581e-14 )
Epeak [keV] : 35.4748      ( -19.5785 -35.4748 )
Norm@50keV   : 1.28723E-02    (     )
------------------------------------------------------------
#Fit statistic : Chi-Squared =          59.13 using 59 PHA bins.
# Reduced chi-squared =          1.075 for     55 degrees of freedom
# Null hypothesis probability =   3.271397e-01

Photon flux (15-150 keV)    in 6 sec:  (    ) ph/cm2/s
Energy fluence (15-150 keV)             : 0 ( 0  0 ) ergs/cm2
Single BB
Spectral model blackbody:
------------------------------------------------------------
Parameters  : value    Lower 90%  Upper 90%
kT [keV]    : 9.44424  (-1.21527  1.45666)
R^2/D10^2   : 0.740023  (-0.314809   0.529257)
(R is the radius in km and D10 is the distance to the source in units of 10 kpc)
------------------------------------------------------------
#Fit statistic : Chi-Squared =          86.61 using 59 PHA bins.
# Reduced chi-squared =          1.519 for     57 degrees of freedom
# Null hypothesis probability =   6.934797e-03

Energy  Fluence     90% Error
[keV]   [erg/cm2]   [erg/cm2]
15- 25  7.889e-08   1.508e-08
25- 50  1.805e-07   2.325e-08
50-150  7.964e-08   2.223e-08
15-150  3.390e-07   4.488e-08
Thermal bremsstrahlung (OTTB)

Spectral model: thermal bremsstrahlung
------------------------------------------------------------
Parameters  : value         Lower 90%    Upper 90%
kT [keV]    : 64.3577       (-17.0597      26.6651)
Norm        : 6.66111       (-1.06849     1.26046)
------------------------------------------------------------
#Fit statistic : Chi-Squared =          60.10 using 59 PHA bins.
# Reduced chi-squared =          1.054 for     57 degrees of freedom
# Null hypothesis probability =   3.642325e-01

Energy  Fluence     90% Error
[keV]   [erg/cm2]   [erg/cm2]
15- 25  1.015e-07   1.377e-08
25- 50  1.577e-07   1.548e-08
50-150  1.900e-07   4.767e-08
15-150  4.492e-07   5.859e-08
Double BB
Spectral model: bbodyrad<1> + bbodyrad<2>
------------------------------------------------------------
Parameters  : value         Lower 90%    Upper 90%
kT1 [keV]   : 5.80144        (-1.24723      0.660108)
R1^2/D10^2  : 3.74435        (-2.0132      3.27832)
kT2 [keV]   : 21.3627        (-5.07164      8.56287)
R2^2/D10^2  : 2.25845E-02    (-0.0163392   0.0301682)
------------------------------------------------------------
#Fit statistic : Chi-Squared =          57.26 using 59 PHA bins.
# Reduced chi-squared =          1.041 for     55 degrees of freedom
# Null hypothesis probability =   3.911671e-01

Energy  Fluence     90% Error
[keV]   [erg/cm2]   [erg/cm2]
15- 25  1.072e-07   3.911e-08
25- 50  1.487e-07   6.104e-08
50-150  2.122e-07   1.156e-07
15-150  4.681e-07   1.784e-07
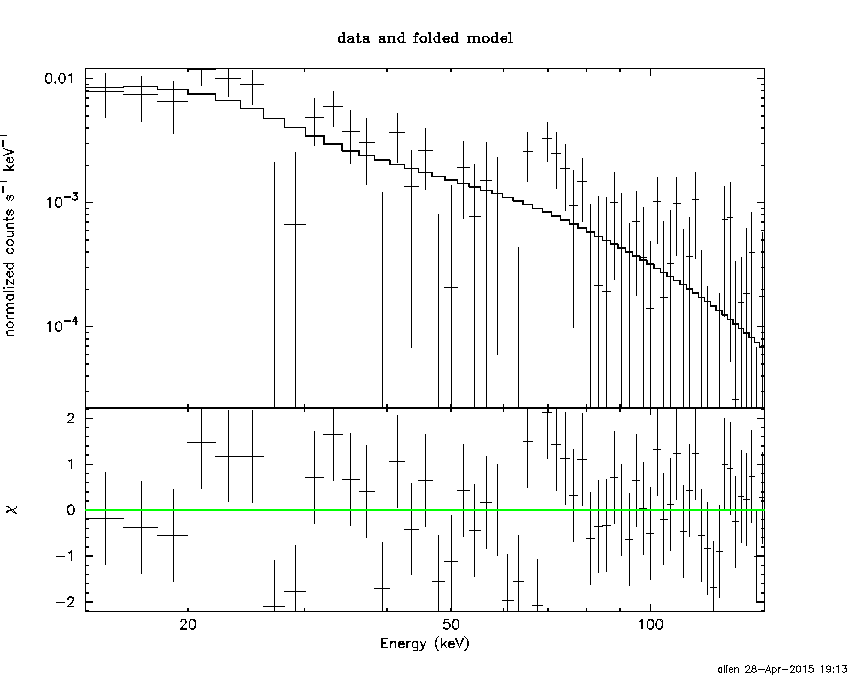
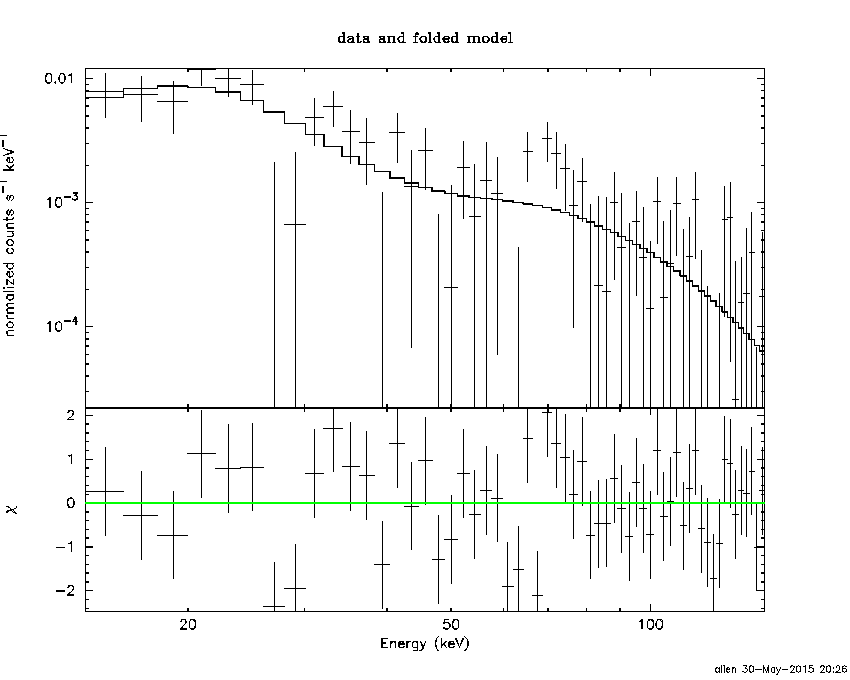
Peak spectrum fit
Power-law model

Time interval is from    0.376 sec. to    1.376 sec.

Spectral model in power-law:
------------------------------------------------------------
Parameters  : value       lower 90%   higher 90%
Photon index: 2.16148     ( -0.34769   0.395192 )
Norm@50keV  : 1.16438E-02    ( -0.0029481   0.00275475 )
------------------------------------------------------------
#Fit statistic : Chi-Squared =          63.90 using 59 PHA bins.
# Reduced chi-squared =          1.121 for     57 degrees of freedom
# Null hypothesis probability =   2.471560e-01

Photon flux (15-150 keV)    in 1 sec: 1.88947 ( -0.337246  0.337335 ) ph/cm2/s
Energy fluence (15-150 keV)             : 1.08919e-07 ( -2.31746e-08  2.36892e-08 ) ergs/cm2
Cutoff power-law model
Time interval is from    0.376 sec. to    1.376 sec.
Spectral model in the cutoff power-law:
------------------------------------------------------------
Parameters  : value       lower 90%   higher 90%
Photon index: 2.50831     ( -0.610702   0.0213788 )
Epeak [keV] : 189.397      (   )
Norm@50keV  : 7.66067E-03    (     )
------------------------------------------------------------
#Fit statistic : Chi-Squared =          63.18 using 59 PHA bins.
# Reduced chi-squared =          1.128 for     56 degrees of freedom
# Null hypothesis probability =   2.377614e-01

Photon flux (15-150 keV)    in 1 sec: 1.88952 ( -0.33572  0.33658 ) ph/cm2/s
Energy fluence (15-150 keV)             : 1.08315e-07 ( -2.26354e-08  2.3416e-08 ) ergs/cm2
Band function
Time interval is from    0.376 sec. to    1.376 sec.

Spectral model in the Band function:
------------------------------------------------------------
Parameters  : value       lower 90%   higher 90%
alpha       : -1.56563   ( 1.54732   1.54732 )
beta        : -2.17726    ( 2.17726   0.361918 )
Epeak [keV] : 15.8985      ( -16.0677 -16.0677 )
Norm@50keV   : 3.50485E-02    ( -0.0374569   5.7724e+06 )
------------------------------------------------------------
#Fit statistic : Chi-Squared =          63.87 using 59 PHA bins.
# Reduced chi-squared =          1.161 for     55 degrees of freedom
# Null hypothesis probability =   1.929207e-01

Photon flux (15-150 keV)    in 1 sec:  (    ) ph/cm2/s
Energy fluence (15-150 keV)             : 0 ( 0  0 ) ergs/cm2
Single BB
Spectral model blackbody:
------------------------------------------------------------
Parameters  : value    Lower 90%  Upper 90%
kT [keV]    : 7.04254  (-1.52494  2.13686)
R^2/D10^2   : 3.29632  (-2.1731   5.92917)
(R is the radius in km and D10 is the distance to the source in units of 10 kpc)
------------------------------------------------------------
#Fit statistic : Chi-Squared =          77.76 using 59 PHA bins.
# Reduced chi-squared =          1.364 for     57 degrees of freedom
# Null hypothesis probability =   3.523153e-02

Energy  Fluence     90% Error
[keV]   [erg/cm2]   [erg/cm2]
15- 25  2.643e-08   1.106e-08
25- 50  3.662e-08   1.353e-08
50-150  6.203e-09   3.665e-09
15-150  6.925e-08   2.386e-08
Thermal bremsstrahlung (OTTB)
Spectral model: thermal bremsstrahlung
------------------------------------------------------------
Parameters  : value         Lower 90%    Upper 90%
kT [keV]    : 57.1817       (-26.5863      64.0747)
Norm        : 9.90674       (-2.95438     5.05425)
------------------------------------------------------------
#Fit statistic : Chi-Squared =          67.33 using 59 PHA bins.
# Reduced chi-squared =          1.181 for     57 degrees of freedom
# Null hypothesis probability =   1.644620e-01

Energy  Fluence     90% Error
[keV]   [erg/cm2]   [erg/cm2]
15- 25  2.469e-08   6.250e-09
25- 50  3.702e-08   8.790e-09
50-150  4.045e-08   1.943e-08
15-150  1.022e-07   2.560e-08
Double BB
Spectral model: bbodyrad<1> + bbodyrad<2>
------------------------------------------------------------
Parameters  : value         Lower 90%    Upper 90%
kT1 [keV]   : 5.21122        (-1.33003      1.58486)
R1^2/D10^2  : 10.0460        (-6.8001      18.6791)
kT2 [keV]   : 29.0133        (-10.9265      40.17)
R2^2/D10^2  : 1.13492E-02    (-0.0103493   0.0337669)
------------------------------------------------------------
#Fit statistic : Chi-Squared =          61.37 using 59 PHA bins.
# Reduced chi-squared =          1.116 for     55 degrees of freedom
# Null hypothesis probability =   2.582885e-01

Energy  Fluence     90% Error
[keV]   [erg/cm2]   [erg/cm2]
15- 25  3.027e-08   1.678e-08
25- 50  3.004e-08   1.458e-08
50-150  5.688e-08   3.462e-08
15-150  1.172e-07   5.473e-08
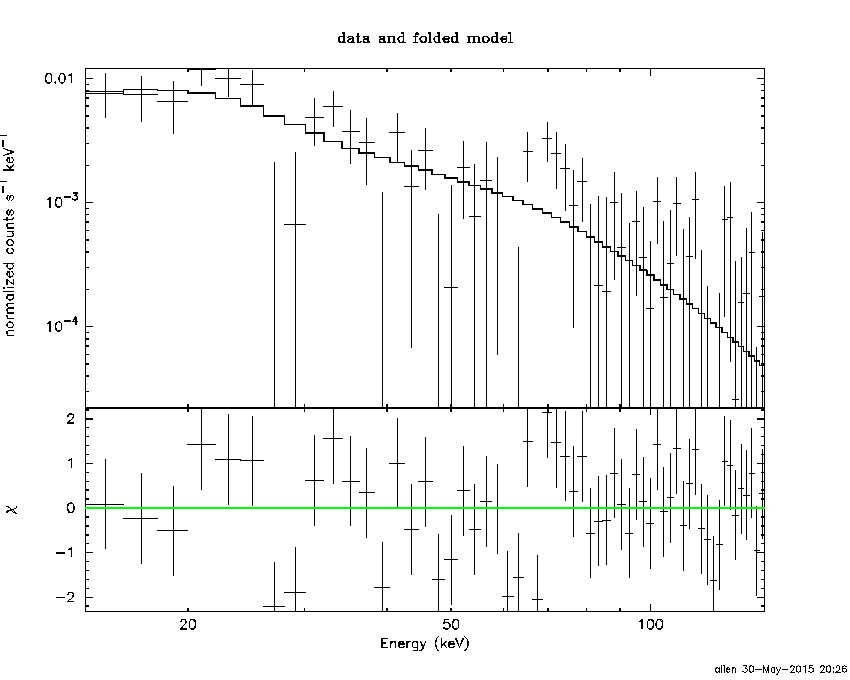
Pre-slew spectrum (Pre-slew PHA with pre-slew DRM)
Power-law model

Spectral model in power-law:
------------------------------------------------------------
Parameters  : value       lower 90%   higher 90%
Photon index: 2.05843     ( -0.185551   0.196191 )
Norm@50keV  : 8.55670E-03    ( -0.00109215   0.00106551 )
------------------------------------------------------------
#Fit statistic : Chi-Squared =          59.81 using 59 PHA bins.
# Reduced chi-squared =          1.049 for     57 degrees of freedom
# Null hypothesis probability =   3.741906e-01

Photon flux (15-150 keV)    in 6 sec: 1.31923 ( -0.133265  0.13335 ) ph/cm2/s
Energy fluence (15-150 keV)             : 4.75269e-07 ( -5.53945e-08  5.62215e-08 ) ergs/cm2
Cutoff power-law model

Spectral model in the cutoff power-law:
------------------------------------------------------------
Parameters  : value       lower 90%   higher 90%
Photon index: 1.74434     ( -0.747698   0.451377 )
Epeak [keV] : 35.4667      ( -29.3791 -35.4667 )
Norm@50keV  : 1.28633E-02    (     )
------------------------------------------------------------
#Fit statistic : Chi-Squared =          59.13 using 59 PHA bins.
# Reduced chi-squared =          1.056 for     56 degrees of freedom
# Null hypothesis probability =   3.618799e-01

Photon flux (15-150 keV)    in 6 sec: 1.30380 ( -0.13678  0.13681 ) ph/cm2/s
Energy fluence (15-150 keV)             : 4.63288e-07 ( -6.04566e-08  6.13524e-08 ) ergs/cm2
Band function

Spectral model in the Band function:
------------------------------------------------------------
Parameters  : value       lower 90%   higher 90%
alpha       : -1.74364   ( -3.0879   0.806345 )
beta        : -10.0000    ( 10   3.55271e-15 )
Epeak [keV] : 35.4748      ( -19.5785 -35.4748 )
Norm@50keV   : 1.28723E-02    (     )
------------------------------------------------------------
#Fit statistic : Chi-Squared =          59.13 using 59 PHA bins.
# Reduced chi-squared =          1.075 for     55 degrees of freedom
# Null hypothesis probability =   3.271397e-01

Photon flux (15-150 keV)    in 6 sec:  (    ) ph/cm2/s
Energy fluence (15-150 keV)             : 0 ( 0  0 ) ergs/cm2
S(25-50 keV) vs. S(50-100 keV) plot
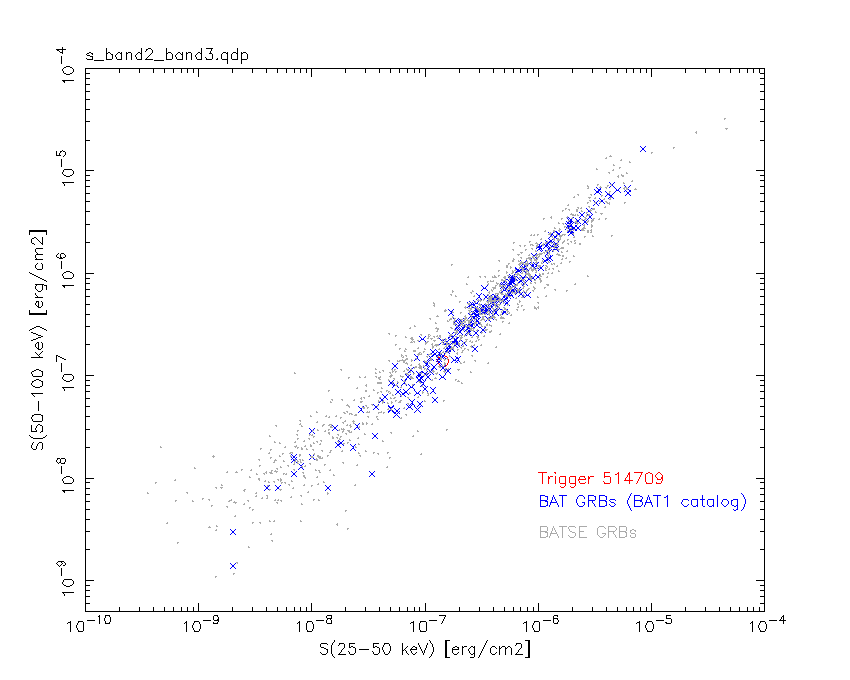
S(25-50 keV)  = 1.45e-07
S(50-100 keV) = 1.40e-07
T90 vs. Hardness ratio plot
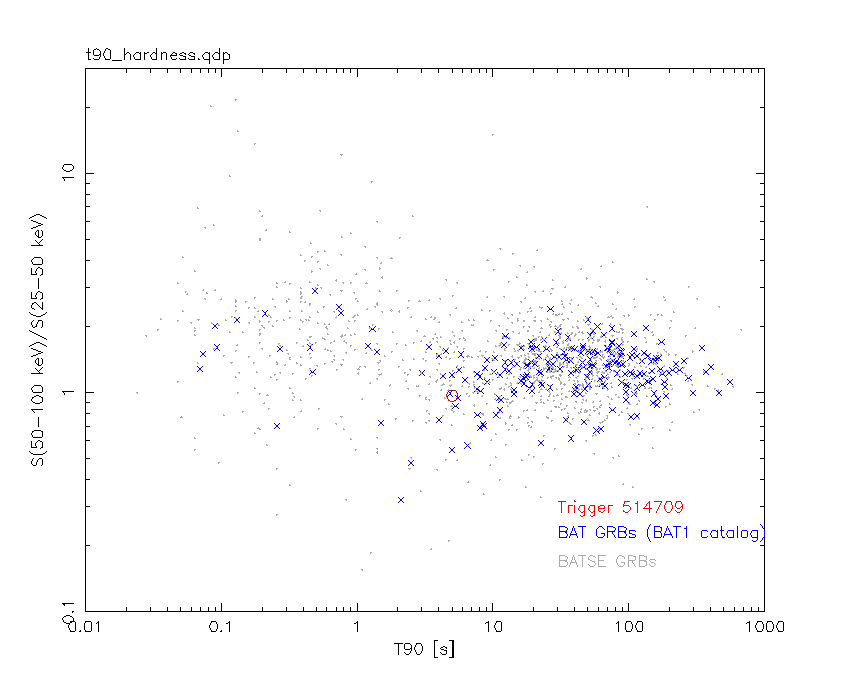
T90                                   = 5 sec.
Hardness ratio (energy fluence ratio) = 0.965517
Color vs. Color plot
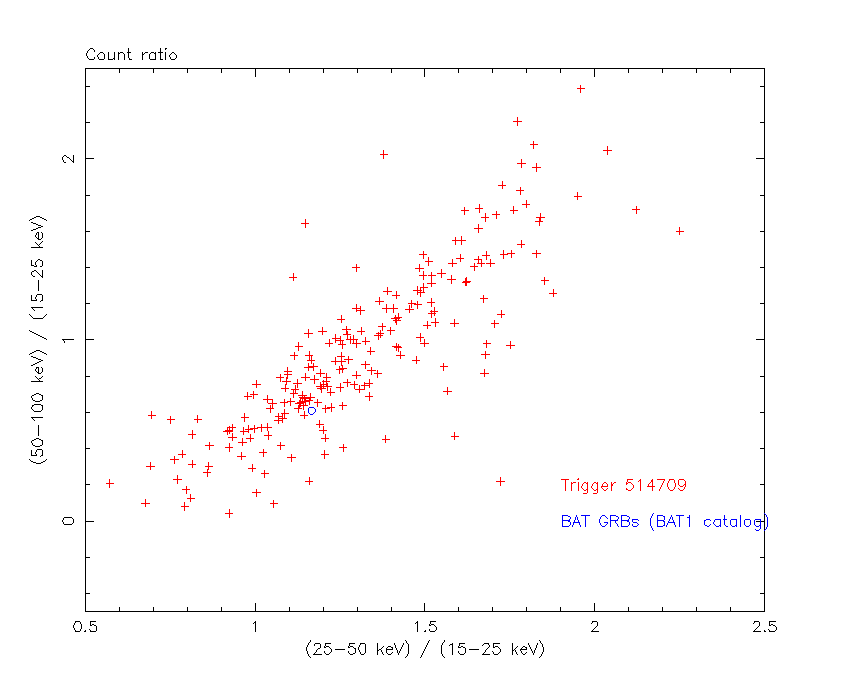
Count Ratio  (25-50 keV) / (15-25 keV) = 1.16662
Count Ratio (50-100 keV) / (15-25 keV) = 0.60885
Mask shadow pattern

IMX = 5.561663115064384E-01, IMY = 7.055375896096804E-01
TIME vs. PHA plot around the trigger time
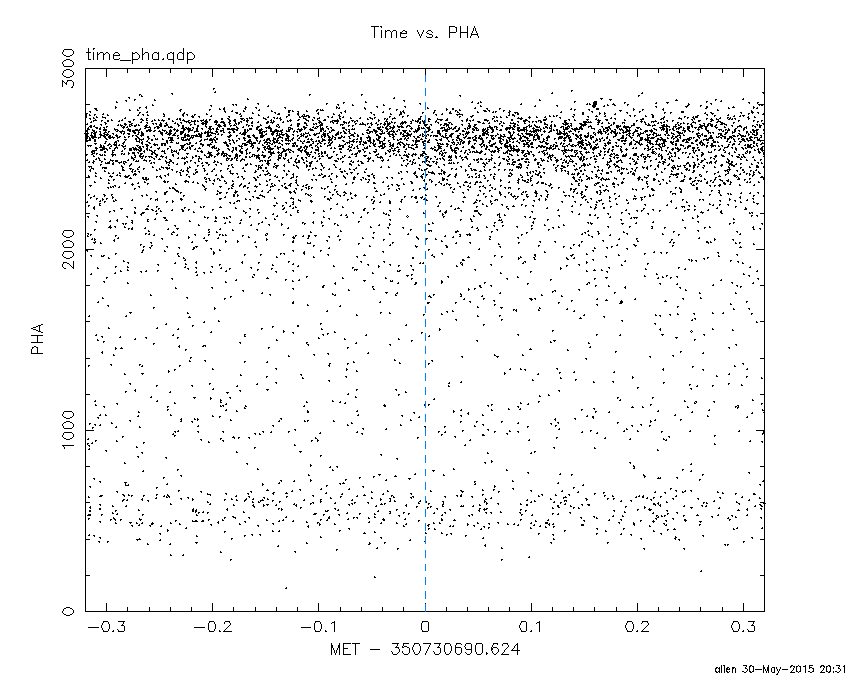
Blue+Cyan dotted lines: Time interval of the scaled map
From 0.000000 to 1.024000
TIME vs. DetID plot around the trigger time
Blue+Cyan dotted lines: Time interval of the scaled map
From 0.000000 to 1.024000
100 us light curve (15-350 keV)
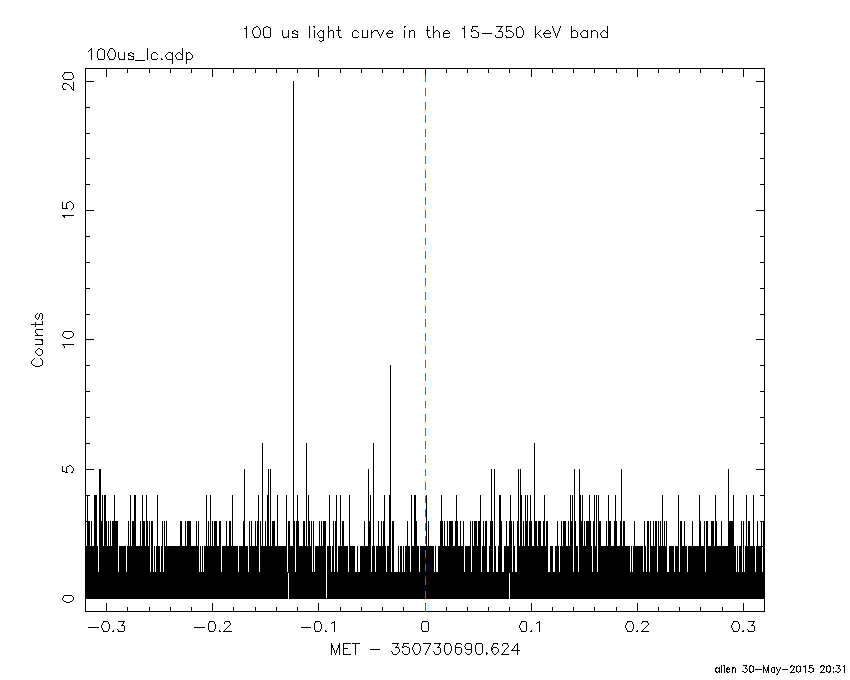
Blue+Cyan dotted lines: Time interval of the scaled map
From 0.000000 to 1.024000
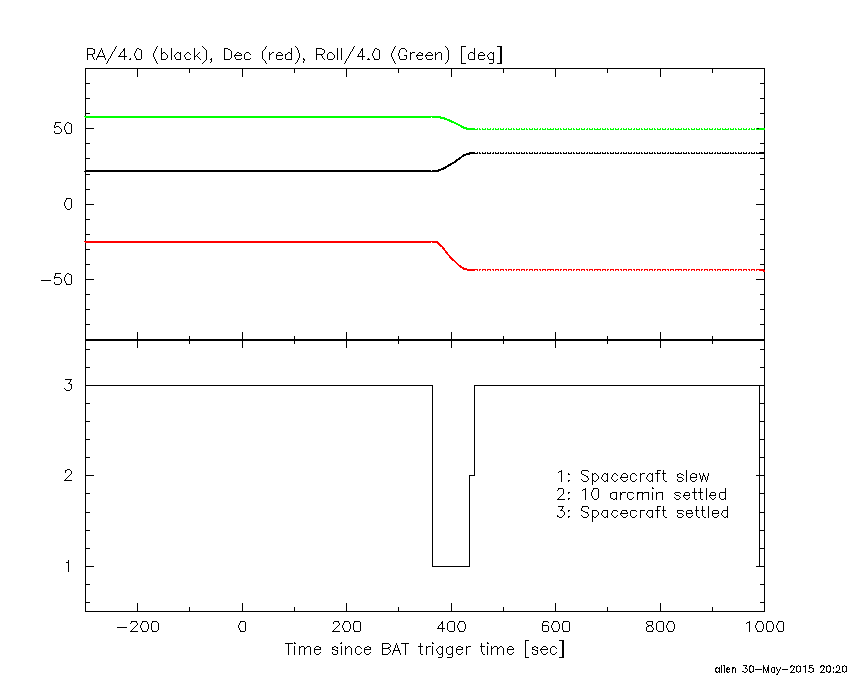
Spacecraft aspect plot
Bright source in the pre-burst/pre-slew/post-slew images
Pre-burst image of 15-350 keV band
Time interval of the image:
-239.624000 -0.624000

# RAcent  DECcent POSerr Theta    Phi  PeakCts   SNR AngSep     Name
#  [deg]    [deg]    ['] [deg]  [deg]                   [']
 83.6238  22.0150    0.7  47.0   32.8   9.2586  15.7    0.5	Crab
135.5920 -40.5060    4.0  42.7  161.8   0.9470   2.8    4.1	Vela X-1
 37.5518 -17.5279    4.3  47.1  -53.3   2.3436   2.7 ------	UNKNOWN
Pre-slew background subtracted image of 15-350 keV band
Time interval of the image:
-0.624000 5.376000

# RAcent  DECcent POSerr Theta    Phi  PeakCts   SNR AngSep     Name
#  [deg]    [deg]    ['] [deg]  [deg]                   [']
 83.5996  22.0435    4.9  47.0   32.8  -0.1999  -2.4    2.6	Crab
135.6608 -40.5232    7.9  42.7  161.8  -0.0645  -1.4    6.3	Vela X-1
 91.5109  12.6077    2.4  37.6   44.1   0.2256   4.8 ------	UNKNOWN
109.7717 -57.1091    2.0  36.0 -162.2   0.1595   5.8 ------	UNKNOWN
113.9830 -60.1399    2.6  39.8 -162.1   0.1422   4.4 ------	UNKNOWN
 43.0866 -18.0375    0.8  41.9  -51.8   0.8556  15.1 ------	UNKNOWN
Post-slew image of 15-350 keV band
Time interval of the image:
434.776600 962.447800

# RAcent  DECcent POSerr Theta    Phi  PeakCts   SNR AngSep     Name
#  [deg]    [deg]    ['] [deg]  [deg]                   [']
135.5325 -40.5665    0.6   3.1   85.6   5.2384  18.8    0.7	Vela X-1
170.2550 -60.5825    2.1  27.2 -147.2   1.7037   5.5    3.0	Cen X-3
186.6587 -62.7780    1.0  35.3 -147.1   5.2008  12.0    0.5	GX 301-2
144.5297 -12.4849    2.6  32.2   90.1   2.8865   4.4 ------	UNKNOWN
169.8582 -27.8891    2.6  32.3  144.4   2.0253   4.4 ------	UNKNOWN
193.1097 -46.6013    2.4  40.5 -172.9   1.9876   4.7 ------	UNKNOWN
214.4876 -45.8638    2.4  54.4 -165.9   4.7834   4.8 ------	UNKNOWN
227.4502 -66.7576    3.2  51.8 -138.5   5.8848   3.6 ------	UNKNOWN
213.7648 -80.7339    2.9  45.4 -121.2   5.1383   4.0 ------	UNKNOWN
Plot creation:
Sat May 30 20:31:58 EDT 2015