Special notes of this burst
Image
Pre-slew 15.0-350.0 keV image (Event data with DETECTION mask)

#   RAcent    DECcent   POSerr    Theta     Phi              Peak Cts       SNR   Name
  319.7669   -25.4626   0.0114    48.6202   -54.0292         9.6681733     16.791 TRIG_00515277

Foreground time interval of the image:
-26.696   8.312 (delta_t =  35.008 [sec])
Background time interval of the image:
-239.048 -26.696 (delta_t = 212.352 [sec])
Lightcurves
Notes:
- 1) The mask-weighted lightcurves have units of either count/det or counts/sec/det, where a det is 0.4 x 0.4 = 0.16 sq cm.
- 2) The verticle lines correspond to following: green dotted lines are T50 interval, black dotted lines are T90 interval, blue solid line(s) is a spacecraft slew start time, and orange solid line(s) is a spacecraft slew end time.
- 3) For lightcurves in unit of count rate, time of each bin is in the middle of the bin.
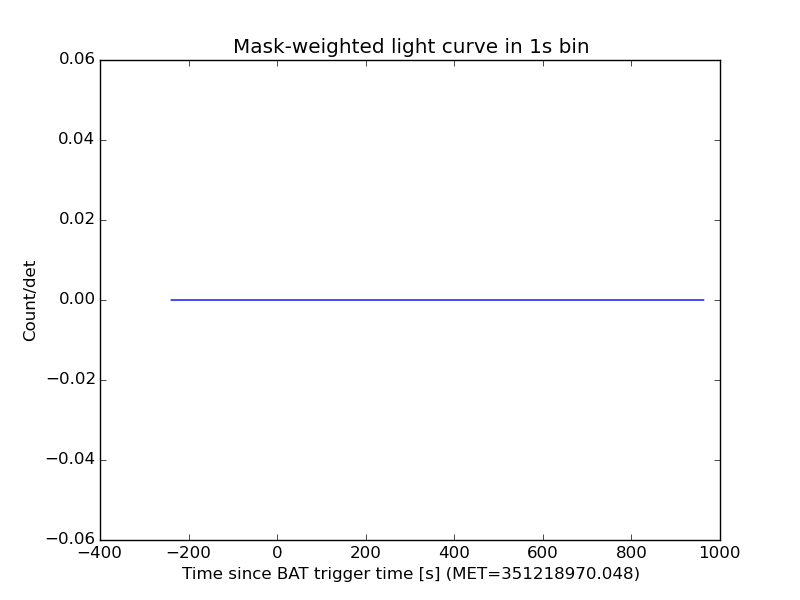
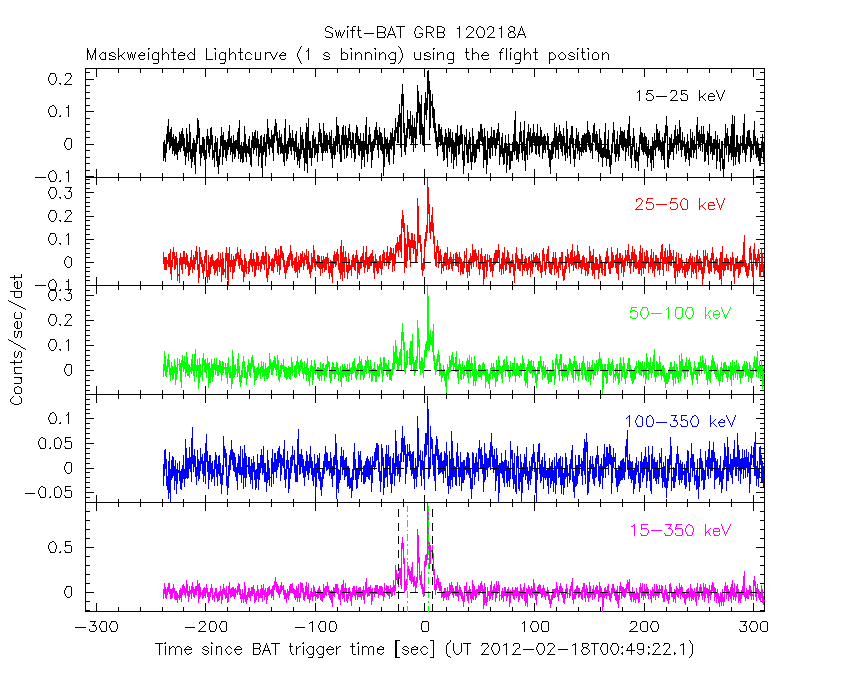
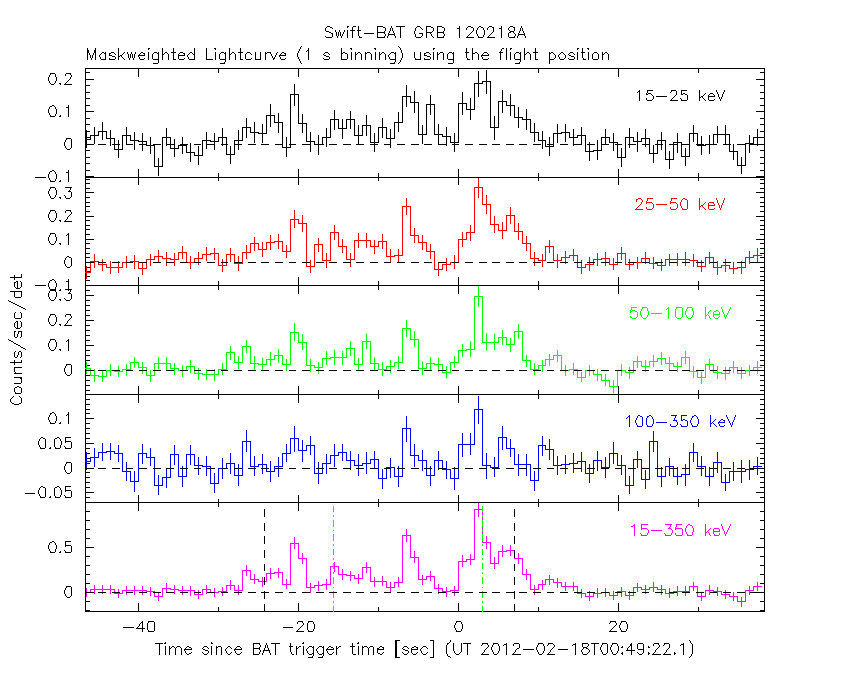
1 s binning
From T0-310 s to T0+310 s
From T100_start - 20 s to T100_end + 30 s
Full time interval

64 ms binning
Full time interval

From T100_start to T100_end

From T0-5 sec to T0+5 sec

16 ms binning
From T100_start-5 s to T100_start+5 s

Blue+Cyan dotted lines: Time interval of the scaled map
From 0.000000 to 8.192000
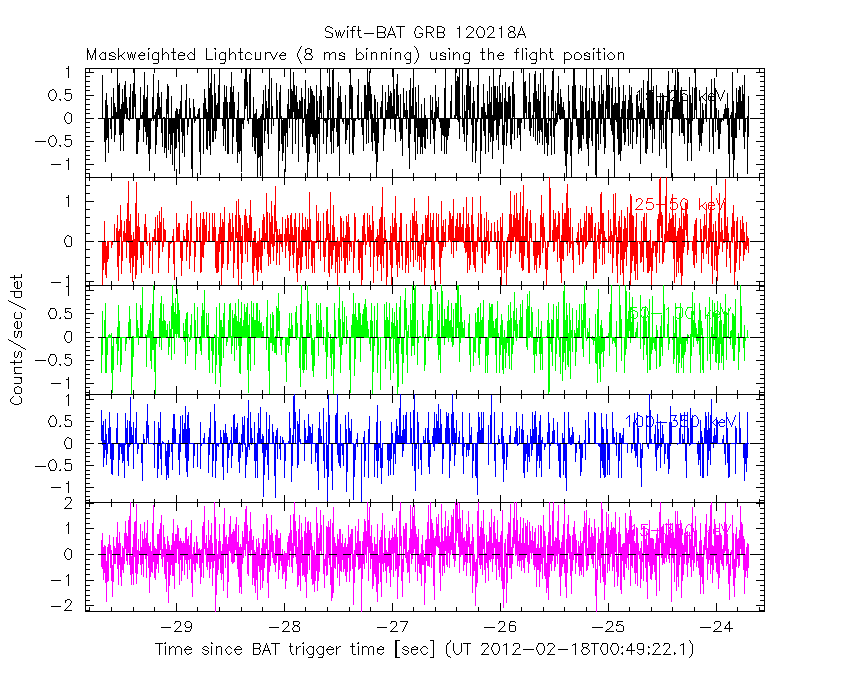
8 ms binning
From T100_start-3 s to T100_start+3 s
Blue+Cyan dotted lines: Time interval of the scaled map
From 0.000000 to 8.192000
2 ms binning
From T100_start-1 s to T100_start+1 s
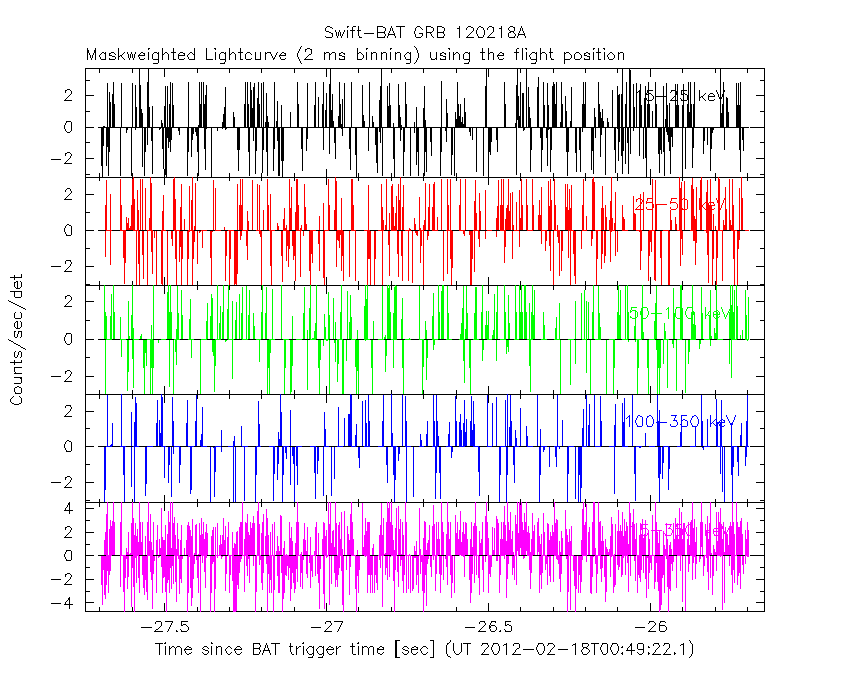
Blue+Cyan dotted lines: Time interval of the scaled map
From 0.000000 to 8.192000
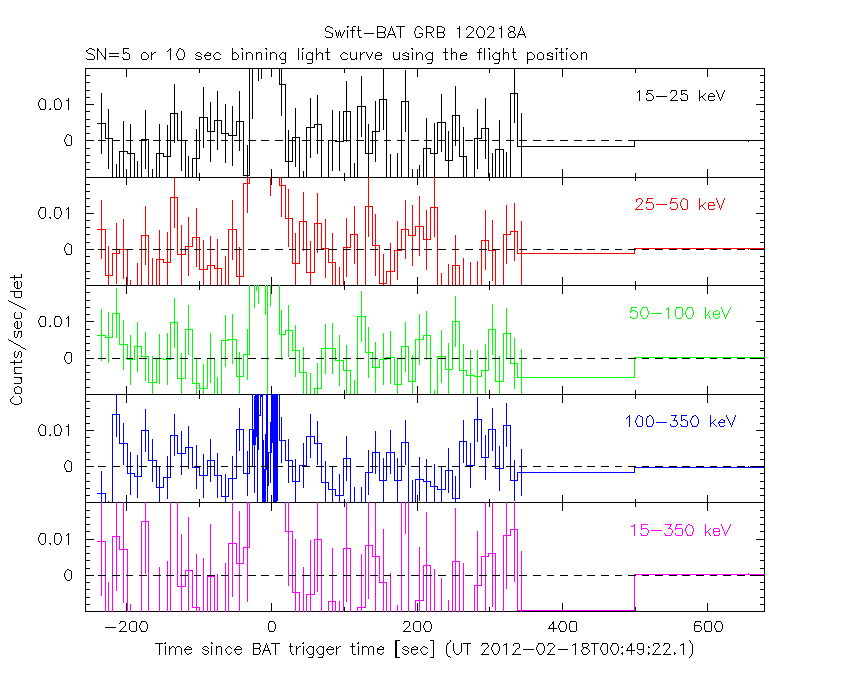
SN=5 or 10 sec. binning (whichever binning is satisfied first)
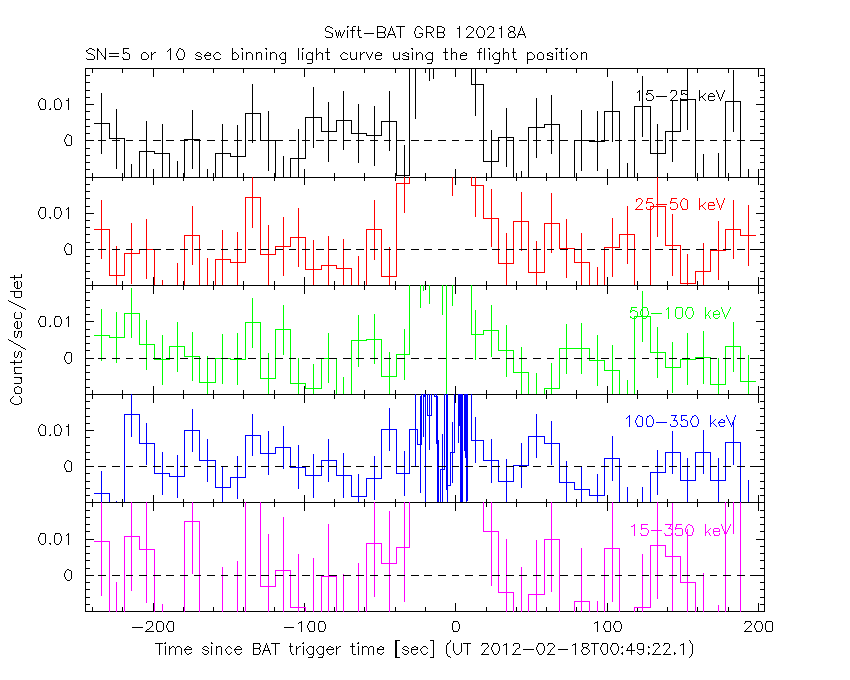
SN=5 or 10 sec. binning (T < 200 sec)
Quad-rate summed light curves (from T0-300s to T0+1000s)

Mask shadow pattern (with DETECTION mask)

IMX = 6.667169370131198E-01, IMY = 9.186420166486740E-01
TIME vs. PHA plot around the beginning of event data (event_start to event_start+0.64s) with DETECTION mask

Blue+Cyan dotted lines: Time interval of the scaled map
From 0.000000 to 8.192000
TIME vs. DetID plot around the beginning of event data (event_start to event_start+0.64s) with DETECTION mask
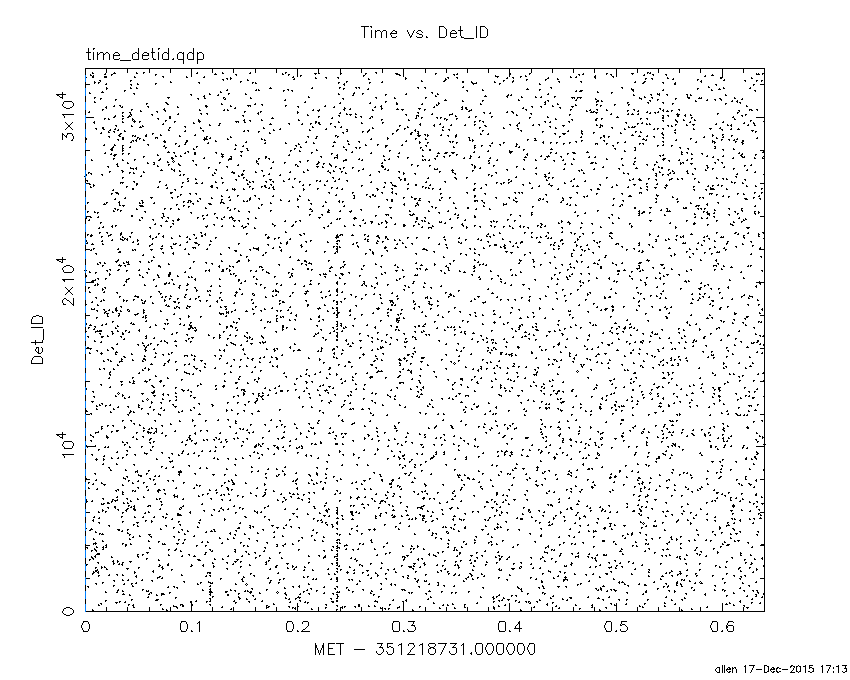
Blue+Cyan dotted lines: Time interval of the scaled map
From 0.000000 to 8.192000
100 us light curve (15-350 keV; (event_start to event_start+0.64s)
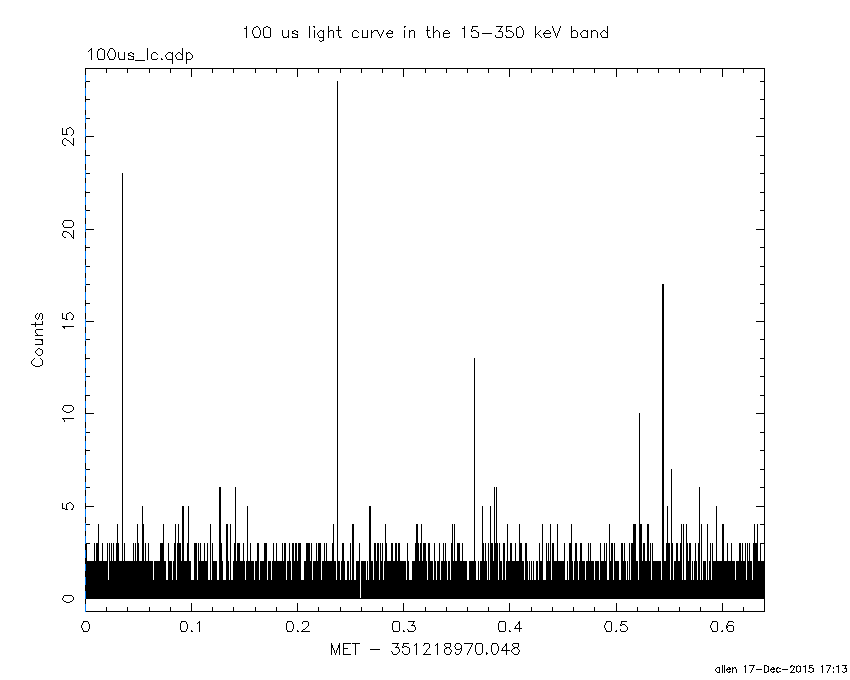
Blue+Cyan dotted lines: Time interval of the scaled map
From 0.000000 to 8.192000
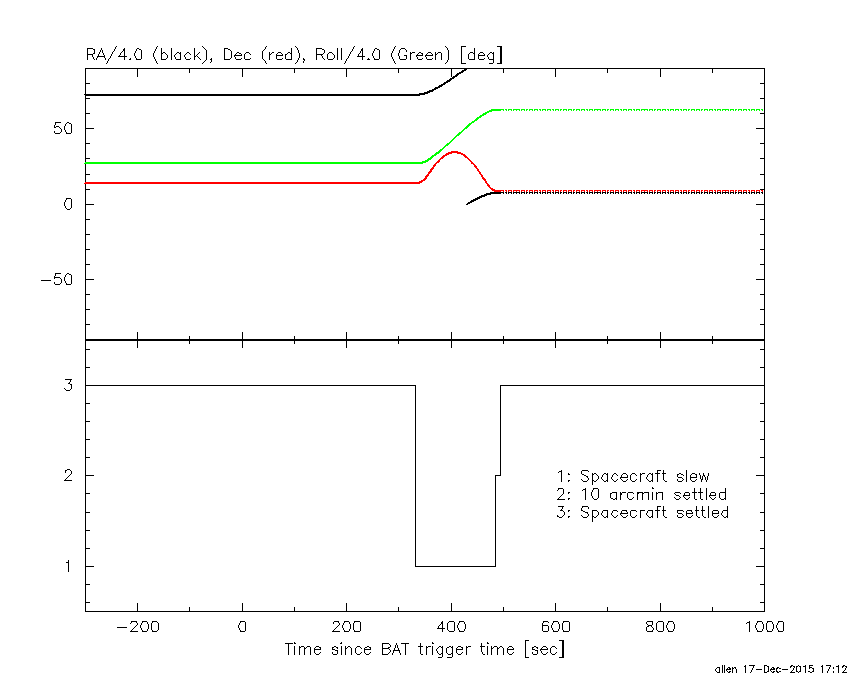
Spacecraft aspect plot
Bright source in the event data image
Event data image of 15-350 keV band
Time interval of the image:
-26.696000 8.312000

# RAcent  DECcent POSerr Theta    Phi  PeakCts   SNR AngSep     Name
#  [deg]    [deg]    ['] [deg]  [deg]                   [']
254.3870  35.2171    3.3  38.8  111.8   0.5350   3.4    8.3	Her X-1
262.9374 -24.8769    7.1  47.2   16.9   0.1999   1.6    8.8	GX 1+4
268.3506  -1.2949   10.7  26.7   39.0  -0.0734  -1.1    9.5	SW J1753.5-0127
270.3708 -25.1984   12.5  43.8    8.8   0.0923   0.9    8.6	GX 5-1
270.2392 -25.5576    0.0  44.1    8.7   0.3468   3.4   11.6	GRS 1758-258
273.8506 -14.0996    7.2  32.5   13.1  -0.1218  -1.6    9.8	GX 17+2
275.8392 -30.2699   11.5  46.4   -0.4  -0.1124  -1.0    7.3	H1820-303
285.1795 -24.8148    3.4  39.1  -10.3  -0.3071  -3.4   10.1	HT1900.1-2455
288.8339  10.7771    7.0   3.5    9.5   0.1011   1.6   10.3	GRS 1915+105
299.5939  35.2716    8.9  22.9 -178.6  -0.0851  -1.3    4.2	Cyg X-1
307.9873  40.9216    7.6  31.0 -171.8  -0.1091  -1.5    5.9	Cyg X-3
326.1361  38.5329    0.0  39.9 -152.7   0.1062   1.1   12.8	Cyg X-2
262.8512 -33.9066    6.8  54.6   10.2   0.4228   1.7    8.1	GX 354-0
247.2614 -18.8568    2.8  53.7   35.5   2.5573   4.2 ------	UNKNOWN
331.0758  47.1537    2.3  47.3 -161.0   0.5703   5.0 ------	UNKNOWN
319.7668 -25.4626    0.7  48.6  -54.0   9.6695  16.5 ------	UNKNOWN
Webpage updated on:
Thu Dec 17 17:13:27 EST 2015