Special notes of this burst
Image
Pre-slew 15.0-350.0 keV image (Event data)
#   RAcent    DECcent   POSerr    Theta     Phi              Peak Cts       SNR   Name
   40.9352   -17.7806   0.0216    35.5738  -113.5179         0.4945639      8.884 TRIG_00515976

Foreground time interval of the image:
 -1.416   6.584 (delta_t =   8.000 [sec])
Background time interval of the image:
-515.215 -496.569 (delta_t =  18.646 [sec])
-239.416  -1.416 (delta_t = 238.000 [sec])
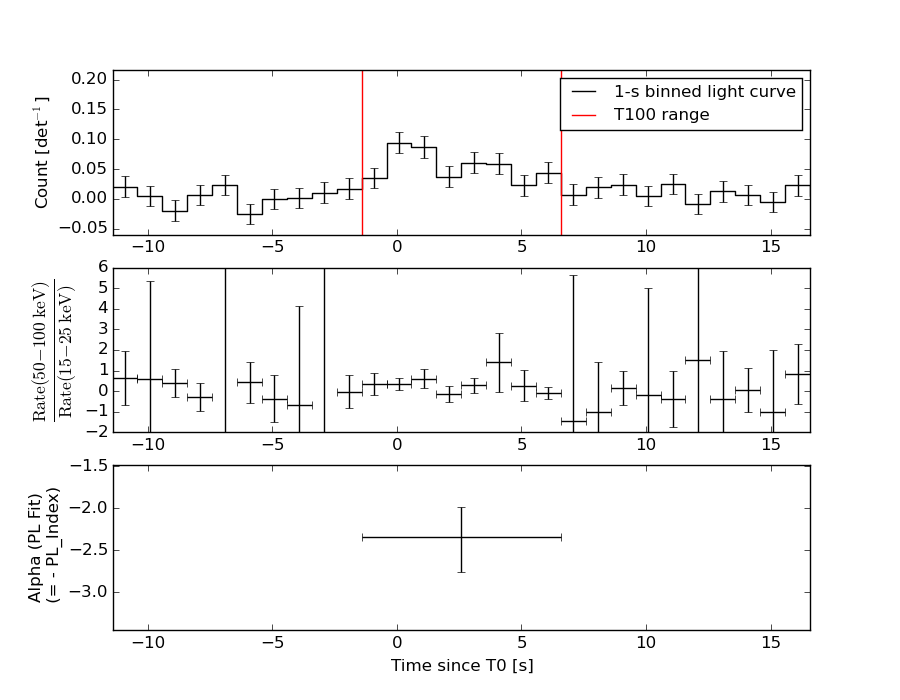
Lightcurves
Notes:
- 1) The mask-weighted light curves are using the flight position.
- 2) Multiple plots of different time binning/intervals are shown to cover all scenarios of short/long GRBs, rate/image triggers, and real/false positives.
- 3) For all the mask-weighted lightcurves, the y-axis units are counts/sec/det where a det is 0.4 x 0.4 = 0.16 sq cm.
- 4) The verticle lines correspond to following: green dotted lines are T50 interval, black dotted lines are T90 interval, blue solid line(s) is a spacecraft slew start time, and orange solid line(s) is a spacecraft slew end time.
- 5) Time of each bin is in the middle of the bin.
1 s binning
From T0-310 s to T0+310 s
From T100_start - 20 s to T100_end + 30 s
Full time interval

64 ms binning
Full time interval
From T100_start to T100_end
From T0-5 sec to T0+5 sec
16 ms binning
From T100_start-5 s to T100_start+5 s
Blue+Cyan dotted lines: Time interval of the scaled map
From 0.000000 to 4.096000
8 ms binning
From T100_start-3 s to T100_start+3 s

Blue+Cyan dotted lines: Time interval of the scaled map
From 0.000000 to 4.096000
2 ms binning
From T100_start-1 s to T100_start+1 s
Blue+Cyan dotted lines: Time interval of the scaled map
From 0.000000 to 4.096000
SN=5 or 10 sec. binning (whichever binning is satisfied first)
SN=5 or 10 sec. binning (T < 200 sec)
Quad-rate summed light curves (from T0-300s to T0+1000s)

The mask-weighted light curves based on cleaned DPHs

Spectral Evolution
Spectra
Notes:
- 1) The fitting includes the systematic errors.
- 2) When the burst includes telescope slew time periods, the fitting uses an average response file made from multiple 5-s response files through out the slew time plus single time preiod for the non-slew times, and weighted by the total counts in the corresponding time period using addrmf. An average response file is needed becuase a spectral fit using the pre-slew DRM will introduce some errors in both a spectral shape and a normalization if the PHA file contains a lot of the slew/post-slew time interval.
- 3) For fits to more complicated models (e.g. a power-law over a cutoff power-law), the BAT team has decided to require a chi-square improvement of more than 6 for each extra dof.
Time averaged spectrum fit using the average DRM
Power-law model
Time interval is from   -1.416 sec. to    6.584 sec.

Spectral model in power-law:
------------------------------------------------------------
Parameters  : value       lower 90%   higher 90%
Photon index: 2.34101     ( -0.355647   0.41549 )
Norm@50keV  : 2.80748E-03    ( -0.000812369   0.000788379 )
------------------------------------------------------------
#Fit statistic : Chi-Squared =          45.14 using 59 PHA bins.
# Reduced chi-squared =         0.7919 for     57 degrees of freedom
# Null hypothesis probability =   8.718559e-01

Photon flux (15-150 keV)    in 8 sec: 0.502076 ( -0.0871567  0.0871862 ) ph/cm2/s
Energy fluence (15-150 keV)             : 2.16335e-07 ( -4.8221e-08  5.09887e-08 ) ergs/cm2
Cutoff power-law model
Time interval is from   -1.416 sec. to    6.584 sec.
Spectral model in the cutoff power-law:
------------------------------------------------------------
Parameters  : value       lower 90%   higher 90%
Photon index: 1.95192     (     )
Epeak [keV] : 4.66570      (   )
Norm@50keV  : 4.88500E-03    (     )
------------------------------------------------------------
#Fit statistic : Chi-Squared =          44.99 using 59 PHA bins.
# Reduced chi-squared =         0.8033 for     56 degrees of freedom
# Null hypothesis probability =   8.539992e-01

Photon flux (15-150 keV)    in 8 sec: 0.497358 ( -0.088729  0.089053 ) ph/cm2/s
Energy fluence (15-150 keV)             : 2.08868e-07 ( -5.1808e-08  5.66768e-08 ) ergs/cm2
Band function
Time interval is from   -1.416 sec. to    6.584 sec.

Spectral model in the Band function:
------------------------------------------------------------
Parameters  : value       lower 90%   higher 90%
alpha       : -1.93133   ( 1.93133   1.93133 )
beta        : -3.18487    ( 3.16139   12.9472 )
Epeak [keV] : 6.47350      ( -6.47256 62.6651 )
Norm@50keV   : 4.98936E-03    ( -0.00182671   0.00483571 )
------------------------------------------------------------
#Fit statistic : Chi-Squared =          44.99 using 59 PHA bins.
# Reduced chi-squared =         0.8180 for     55 degrees of freedom
# Null hypothesis probability =   8.301023e-01

Photon flux (15-150 keV)    in 8 sec:  (    ) ph/cm2/s
Energy fluence (15-150 keV)             : 0 ( 0  0 ) ergs/cm2
Single BB

Spectral model blackbody:
------------------------------------------------------------
Parameters  : value    Lower 90%  Upper 90%
kT [keV]    : 8.25206  (-1.6858  1.92193)
R^2/D10^2   : 0.482140  (-0.270479   0.713848)
(R is the radius in km and D10 is the distance to the source in units of 10 kpc)
------------------------------------------------------------
#Fit statistic : Chi-Squared =          52.48 using 59 PHA bins.
# Reduced chi-squared =         0.9207 for     57 degrees of freedom
# Null hypothesis probability =   6.451475e-01

Energy  Fluence     90% Error
[keV]   [erg/cm2]   [erg/cm2]
15- 25  4.856e-08   1.719e-08
25- 50  8.962e-08   2.843e-08
50-150  2.603e-08   1.452e-08
15-150  1.642e-07   5.408e-08
Thermal bremsstrahlung (OTTB)
Spectral model: thermal bremsstrahlung
------------------------------------------------------------
Parameters  : value         Lower 90%    Upper 90%
kT [keV]    : 39.3447       (-14.6856      28.3496)
Norm        : 3.28370       (-0.955569     1.55334)
------------------------------------------------------------
#Fit statistic : Chi-Squared =          45.47 using 59 PHA bins.
# Reduced chi-squared =         0.7977 for     57 degrees of freedom
# Null hypothesis probability =   8.641518e-01

Energy  Fluence     90% Error
[keV]   [erg/cm2]   [erg/cm2]
15- 25  5.998e-08   1.416e-08
25- 50  7.835e-08   2.278e-08
50-150  5.952e-08   3.462e-08
15-150  1.979e-07   5.916e-08
Double BB
Spectral model: bbodyrad<1> + bbodyrad<2>
------------------------------------------------------------
Parameters  : value         Lower 90%    Upper 90%
kT1 [keV]   : 2.91290        (-1.19453      1.86216)
R1^2/D10^2  : 30.4847        (-28.1382      96.9288)
kT2 [keV]   : 11.3477        (-2.77366      5.1549)
R2^2/D10^2  : 0.111042    (-0.0860991   0.159561)
------------------------------------------------------------
#Fit statistic : Chi-Squared =          43.50 using 59 PHA bins.
# Reduced chi-squared =         0.7908 for     55 degrees of freedom
# Null hypothesis probability =   8.685294e-01

Energy  Fluence     90% Error
[keV]   [erg/cm2]   [erg/cm2]
15- 25  6.191e-08   3.267e-08
25- 50  7.566e-08   4.232e-08
50-150  5.264e-08   3.324e-08
15-150  1.902e-07   1.015e-07
Peak spectrum fit
Power-law model
Time interval is from   -0.416 sec. to    0.584 sec.

Spectral model in power-law:
------------------------------------------------------------
Parameters  : value       lower 90%   higher 90%
Photon index: 2.45904     ( -0.578123   0.847412 )
Norm@50keV  : 4.43184E-03    ( -0.00443184   0.00217024 )
------------------------------------------------------------
#Fit statistic : Chi-Squared =          55.68 using 59 PHA bins.
# Reduced chi-squared =         0.9769 for     57 degrees of freedom
# Null hypothesis probability =   5.245289e-01

Photon flux (15-150 keV)    in 1 sec: 0.849237 ( -0.239892  0.240118 ) ph/cm2/s
Energy fluence (15-150 keV)             : 4.38467e-08 ( -1.60816e-08  1.73665e-08 ) ergs/cm2
Cutoff power-law model

Time interval is from   -0.416 sec. to    0.584 sec.
Spectral model in the cutoff power-law:
------------------------------------------------------------
Parameters  : value       lower 90%   higher 90%
Photon index: 1.85743     (     )
Epeak [keV] : 10.2406      (   )
Norm@50keV  : 9.83140E-03    (     )
------------------------------------------------------------
#Fit statistic : Chi-Squared =          55.62 using 59 PHA bins.
# Reduced chi-squared =         0.9933 for     56 degrees of freedom
# Null hypothesis probability =   4.890410e-01

Photon flux (15-150 keV)    in 1 sec: 0.844217 ( -0.23831  0.241133 ) ph/cm2/s
Energy fluence (15-150 keV)             : 4.31821e-08 ( -1.56852e-08  1.77425e-08 ) ergs/cm2
Band function
Time interval is from   -0.416 sec. to    0.584 sec.

Spectral model in the Band function:
------------------------------------------------------------
Parameters  : value       lower 90%   higher 90%
alpha       : -1.99716   ( -0.00284438   0.308264 )
beta        : -9.37167    ( 9.37167   19.3717 )
Epeak [keV] : 0.260974      ( -0.260974 -0.260974 )
Norm@50keV   : 8.22409E-03    ( -0.00230628   0.00230628 )
------------------------------------------------------------
#Fit statistic : Chi-Squared =          55.60 using 59 PHA bins.
# Reduced chi-squared =          1.011 for     55 degrees of freedom
# Null hypothesis probability =   4.520216e-01

Photon flux (15-150 keV)    in 1 sec: 0.844397 (    ) ph/cm2/s
Energy fluence (15-150 keV)             : 4.36338e-08 ( -4.36268e-08  -1.62485e-08 ) ergs/cm2
Single BB
Spectral model blackbody:
------------------------------------------------------------
Parameters  : value    Lower 90%  Upper 90%
kT [keV]    : 8.91617  (-3.26078  3.94251)
R^2/D10^2   : 0.601005  (-0.593594   3.002)
(R is the radius in km and D10 is the distance to the source in units of 10 kpc)
------------------------------------------------------------
#Fit statistic : Chi-Squared =          59.51 using 59 PHA bins.
# Reduced chi-squared =          1.044 for     57 degrees of freedom
# Null hypothesis probability =   3.844180e-01

Energy  Fluence     90% Error
[keV]   [erg/cm2]   [erg/cm2]
15- 25  9.257e-09   5.665e-09
25- 50  1.939e-08   1.193e-08
50-150  7.187e-09   5.355e-09
15-150  3.583e-08   2.260e-08
Thermal bremsstrahlung (OTTB)
Spectral model: thermal bremsstrahlung
------------------------------------------------------------
Parameters  : value         Lower 90%    Upper 90%
kT [keV]    : 39.9614       (-21.4966      54.8438)
Norm        : 5.52474       (-2.28014     5.37314)
------------------------------------------------------------
#Fit statistic : Chi-Squared =          55.90 using 59 PHA bins.
# Reduced chi-squared =         0.9808 for     57 degrees of freedom
# Null hypothesis probability =   5.162443e-01

Energy  Fluence     90% Error
[keV]   [erg/cm2]   [erg/cm2]
15- 25  1.268e-08   6.033e-09
25- 50  1.668e-08   9.095e-09
50-150  1.289e-08   1.013e-08
15-150  4.225e-08   2.286e-08
Double BB
Spectral model: bbodyrad<1> + bbodyrad<2>
------------------------------------------------------------
Parameters  : value         Lower 90%    Upper 90%
kT1 [keV]   : 2.02499        (-1.59487      2.23616)
R1^2/D10^2  : 698.998        (-1759.43      -1770.63)
kT2 [keV]   : 12.0714        (-4.00236      5.59559)
R2^2/D10^2  : 0.159627    (-0.144942   0.248758)
------------------------------------------------------------
#Fit statistic : Chi-Squared =          52.55 using 59 PHA bins.
# Reduced chi-squared =         0.9554 for     55 degrees of freedom
# Null hypothesis probability =   5.689692e-01

Energy  Fluence     90% Error
[keV]   [erg/cm2]   [erg/cm2]
15- 25  1.208e-08   6.470e-09
25- 50  1.581e-08   1.022e-08
50-150  1.372e-08   1.022e-08
15-150  4.161e-08   2.283e-08
Pre-slew spectrum (Pre-slew PHA with pre-slew DRM)
Power-law model

Spectral model in power-law:
------------------------------------------------------------
Parameters  : value       lower 90%   higher 90%
Photon index: 2.34101     ( -0.355647   0.41549 )
Norm@50keV  : 2.80748E-03    ( -0.000812369   0.000788379 )
------------------------------------------------------------
#Fit statistic : Chi-Squared =          45.14 using 59 PHA bins.
# Reduced chi-squared =         0.7919 for     57 degrees of freedom
# Null hypothesis probability =   8.718559e-01

Photon flux (15-150 keV)    in 8 sec: 0.502076 ( -0.0871567  0.0871862 ) ph/cm2/s
Energy fluence (15-150 keV)             : 2.16335e-07 ( -4.8221e-08  5.09887e-08 ) ergs/cm2
Cutoff power-law model

Spectral model in the cutoff power-law:
------------------------------------------------------------
Parameters  : value       lower 90%   higher 90%
Photon index: 1.95192     (     )
Epeak [keV] : 4.66570      (   )
Norm@50keV  : 4.88500E-03    (     )
------------------------------------------------------------
#Fit statistic : Chi-Squared =          44.99 using 59 PHA bins.
# Reduced chi-squared =         0.8033 for     56 degrees of freedom
# Null hypothesis probability =   8.539992e-01

Photon flux (15-150 keV)    in 8 sec: 0.497358 ( -0.088729  0.089053 ) ph/cm2/s
Energy fluence (15-150 keV)             : 2.08868e-07 ( -5.1808e-08  5.66768e-08 ) ergs/cm2
Band function

Spectral model in the Band function:
------------------------------------------------------------
Parameters  : value       lower 90%   higher 90%
alpha       : -1.93133   ( 1.93133   1.93133 )
beta        : -3.18487    ( 3.16139   12.9472 )
Epeak [keV] : 6.47350      ( -6.47256 62.6651 )
Norm@50keV   : 4.98936E-03    ( -0.00182671   0.00461348 )
------------------------------------------------------------
#Fit statistic : Chi-Squared =          44.99 using 59 PHA bins.
# Reduced chi-squared =         0.8180 for     55 degrees of freedom
# Null hypothesis probability =   8.301023e-01

Photon flux (15-150 keV)    in 8 sec:  (    ) ph/cm2/s
Energy fluence (15-150 keV)             : 0 ( 0  0 ) ergs/cm2
S(25-50 keV) vs. S(50-100 keV) plot
S(25-50 keV)  = 7.03e-08
S(50-100 keV) = 5.55e-08
T90 vs. Hardness ratio plot
T90                                   = 7 sec.
Hardness ratio (energy fluence ratio) = 0.789474
Color vs. Color plot
Count Ratio  (25-50 keV) / (15-25 keV) = 1.07497
Count Ratio (50-100 keV) / (15-25 keV) = 0.305506
Mask shadow pattern
IMX = -2.854052604166931E-01, IMY = 6.558275520128743E-01
TIME vs. PHA plot around the trigger time
Blue+Cyan dotted lines: Time interval of the scaled map
From 0.000000 to 4.096000
TIME vs. DetID plot around the trigger time
Blue+Cyan dotted lines: Time interval of the scaled map
From 0.000000 to 4.096000
100 us light curve (15-350 keV)
Blue+Cyan dotted lines: Time interval of the scaled map
From 0.000000 to 4.096000
Spacecraft aspect plot
Bright source in the pre-burst/pre-slew/post-slew images
Pre-burst image of 15-350 keV band
Time interval of the image:
-515.215400 -496.569100
-239.416000 -1.416000

# RAcent  DECcent POSerr Theta    Phi  PeakCts   SNR AngSep     Name
#  [deg]    [deg]    ['] [deg]  [deg]                   [']
 83.6336  22.0131    0.3  22.3   58.0  10.6004  44.0    0.1	Crab
 75.2035  27.5277    3.2  23.1   33.5   0.7689   3.6 ------	UNKNOWN
 68.3973  25.3142    2.4  19.9   18.0   0.9569   4.8 ------	UNKNOWN
 81.4657 -51.9624    2.6  58.4 -171.8   5.4540   4.5 ------	UNKNOWN
 43.5451 -41.1528    2.9  51.8 -138.6   4.5835   4.0 ------	UNKNOWN
Pre-slew background subtracted image of 15-350 keV band
Time interval of the image:
-1.416000 6.584000

# RAcent  DECcent POSerr Theta    Phi  PeakCts   SNR AngSep     Name
#  [deg]    [deg]    ['] [deg]  [deg]                   [']
 83.4896  22.1314    6.8  22.3   57.6  -0.0564  -1.7   10.6	Crab
109.1579   0.4680    3.1  41.1  113.2   0.4157   3.6 ------	UNKNOWN
103.3959 -31.4524    2.6  49.8  157.7   0.4279   4.4 ------	UNKNOWN
 40.9352 -17.7806    1.3  35.6 -113.5   0.4947   8.9 ------	UNKNOWN
Post-slew image of 15-350 keV band
Time interval of the image:
93.084600 962.645700

# RAcent  DECcent POSerr Theta    Phi  PeakCts   SNR AngSep     Name
#  [deg]    [deg]    ['] [deg]  [deg]                   [']
 43.6596 -46.1520    2.2  28.5  178.2   2.3995   5.3 ------	UNKNOWN
 33.7254 -74.6547    4.3  57.0 -175.6   5.6798   2.7 ------	UNKNOWN
 21.4382 -24.7601    2.8  19.5 -112.3   1.8800   4.1 ------	UNKNOWN
 16.0026  15.0251    2.8  41.0  -36.4   2.9549   4.2 ------	UNKNOWN
352.0843 -41.9545    3.4  48.0 -128.9   6.8738   3.4 ------	UNKNOWN
Plot creation:
Sat May 30 20:14:03 EDT 2015