Click here for the BAT GCN circular template
Image
Pre-slew 15.0-350.0 keV image (Event data)

#   RAcent    DECcent   POSerr    Theta     Phi              Peak Cts       SNR   Name
   20.0408   -35.7984   0.0155    25.8886  -150.2481         0.0733313     12.464 TRIG_00516571

Foreground time interval of the image:
 -0.008   0.268 (delta_t =   0.276 [sec])
Background time interval of the image:
-127.603  -0.008 (delta_t = 127.595 [sec])
Lightcurves
Notes:
- 1) The mask-weighted light curves are using the flight position.
- 2) Multiple plots of different time binning/intervals are shown to cover all scenarios of short/long GRBs, rate/image triggers, and real/false positives.
- 3) For all the mask-weighted lightcurves, the y-axis units are counts/sec/det where a det is 0.4 x 0.4 = 0.16 sq cm.
- 4) The verticle lines correspond to following: green dotted lines are T50 interval, black dotted lines are T90 interval, blue solid line(s) is a spacecraft slew start time, and orange solid line(s) is a spacecraft slew end time.
- 5) Time of each bin is in the middle of the bin.
1 s binning
From T0-310 s to T0+310 s

From T100_start - 20 s to T100_end + 30 s

Full time interval

64 ms binning
Full time interval

From T100_start to T100_end

From T0-5 sec to T0+5 sec
16 ms binning
From T100_start-5 s to T100_start+5 s

Blue+Cyan dotted lines: Time interval of the scaled map
From 0.000000 to 0.256000
8 ms binning
From T100_start-3 s to T100_start+3 s
Blue+Cyan dotted lines: Time interval of the scaled map
From 0.000000 to 0.256000
2 ms binning
From T100_start-1 s to T100_start+1 s

Blue+Cyan dotted lines: Time interval of the scaled map
From 0.000000 to 0.256000
SN=5 or 10 sec. binning (whichever binning is satisfied first)

SN=5 or 10 sec. binning (T < 200 sec)

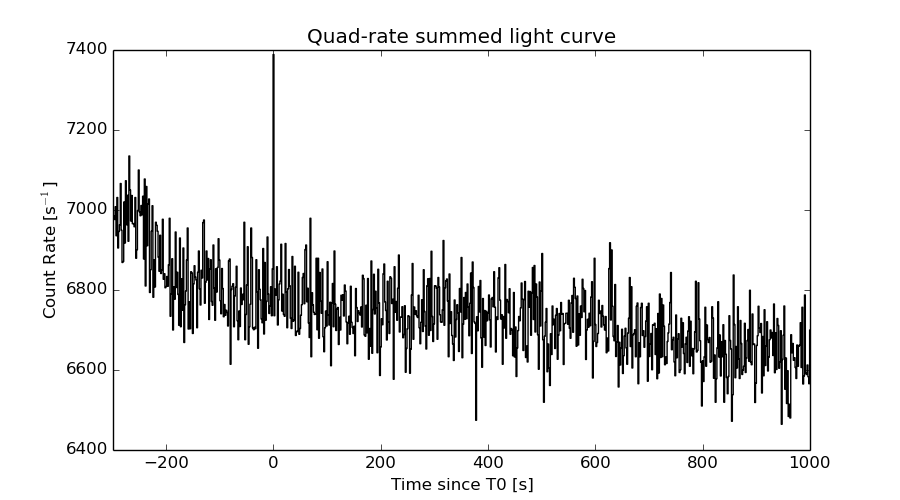
Quad-rate summed light curves (from T0-300s to T0+1000s)
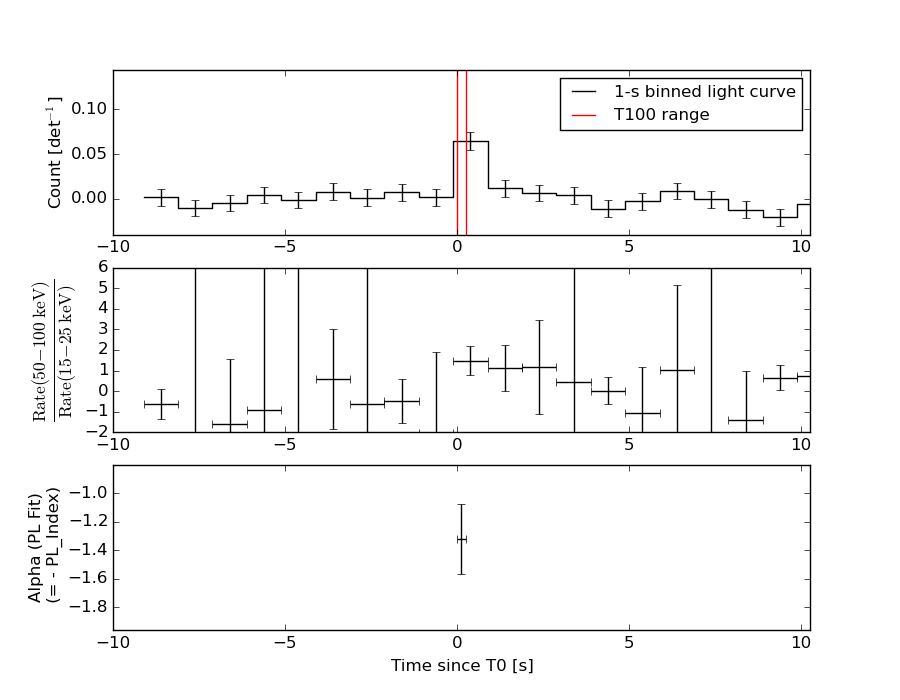
Spectral Evolution
Spectra
Notes:
- 1) The fitting includes the systematic errors.
- 2) When the burst includes telescope slew time periods, the fitting uses an average response file made from multiple 5-s response files through out the slew time plus single time preiod for the non-slew times, and weighted by the total counts in the corresponding time period using addrmf. An average response file is needed becuase a spectral fit using the pre-slew DRM will introduce some errors in both a spectral shape and a normalization if the PHA file contains a lot of the slew/post-slew time interval.
- 3) For fits to more complicated models (e.g. a power-law over a cutoff power-law), the BAT team has decided to require a chi-square improvement of more than 6 for each extra dof.
Time averaged spectrum fit using the average DRM
Power-law model

Time interval is from   -0.008 sec. to    0.268 sec.

Spectral model in power-law:
------------------------------------------------------------
Parameters  : value       lower 90%   higher 90%
Photon index: 1.31937     ( -0.246593   0.24902 )
Norm@50keV  : 1.52657E-02    ( -0.00238304   0.00237392 )
------------------------------------------------------------
#Fit statistic : Chi-Squared =          68.13 using 59 PHA bins.
# Reduced chi-squared =          1.195 for     57 degrees of freedom
# Null hypothesis probability =   1.485366e-01

Photon flux (15-150 keV)    in 0.276 sec: 1.82790 ( -0.282938  0.28317 ) ph/cm2/s
Energy fluence (15-150 keV)             : 4.1442e-08 ( -7.19827e-09  7.30169e-09 ) ergs/cm2
Cutoff power-law model

Time interval is from   -0.008 sec. to    0.268 sec.
Spectral model in the cutoff power-law:
------------------------------------------------------------
Parameters  : value       lower 90%   higher 90%
Photon index: 0.474534     ( -1.09226   0.886121 )
Epeak [keV] : 94.0826      ( -31.9515 -94.1023 )
Norm@50keV  : 3.97923E-02    ( -0.0246046   0.0909074 )
------------------------------------------------------------
#Fit statistic : Chi-Squared =          65.46 using 59 PHA bins.
# Reduced chi-squared =          1.169 for     56 degrees of freedom
# Null hypothesis probability =   1.813890e-01

Photon flux (15-150 keV)    in 0.276 sec: 1.78555 ( -0.28568  0.28628 ) ph/cm2/s
Energy fluence (15-150 keV)             : 3.97153e-08 ( -7.49036e-09  7.60076e-09 ) ergs/cm2
Band function

Time interval is from   -0.008 sec. to    0.268 sec.

Spectral model in the Band function:
------------------------------------------------------------
Parameters  : value       lower 90%   higher 90%
alpha       : -0.479708   ( -0.484961   1.27256 )
beta        : -10.0000    ( 10   1.77636e-15 )
Epeak [keV] : 94.3565      ( -30.4786 250.483 )
Norm@50keV   : 3.95571E-02    ( -0.0245921   0.0910215 )
------------------------------------------------------------
#Fit statistic : Chi-Squared =          65.46 using 59 PHA bins.
# Reduced chi-squared =          1.190 for     55 degrees of freedom
# Null hypothesis probability =   1.579622e-01

Photon flux (15-150 keV)    in 0.276 sec: 1.80128 ( 5.19872  -0.27513 ) ph/cm2/s
Energy fluence (15-150 keV)             : 0 ( 0  0 ) ergs/cm2
Single BB

Spectral model blackbody:
------------------------------------------------------------
Parameters  : value    Lower 90%  Upper 90%
kT [keV]    : 17.4089  (-3.34319  3.99292)
R^2/D10^2   : 0.134540  (-0.0670572   0.139442)
(R is the radius in km and D10 is the distance to the source in units of 10 kpc)
------------------------------------------------------------
#Fit statistic : Chi-Squared =          72.56 using 59 PHA bins.
# Reduced chi-squared =          1.273 for     57 degrees of freedom
# Null hypothesis probability =   8.015927e-02

Energy  Fluence     90% Error
[keV]   [erg/cm2]   [erg/cm2]
15- 25  2.277e-09   7.619e-10
25- 50  1.026e-08   2.651e-09
50-150  2.237e-08   6.890e-09
15-150  3.491e-08   8.095e-09
Thermal bremsstrahlung (OTTB)

Spectral model: thermal bremsstrahlung
------------------------------------------------------------
Parameters  : value         Lower 90%    Upper 90%
kT [keV]    : 200.000       (      )
Norm        : 7.52754       (-1.16003     1.16)
------------------------------------------------------------
#Fit statistic : Chi-Squared =          69.01 using 59 PHA bins.
# Reduced chi-squared =          1.211 for     57 degrees of freedom
# Null hypothesis probability =   1.322543e-01

Energy  Fluence     90% Error
[keV]   [erg/cm2]   [erg/cm2]
15- 25  5.174e-09   2.985e-09
25- 50  9.952e-09   5.572e-09
50-150  2.183e-08   1.246e-08
15-150  3.695e-08   2.129e-08
Double BB

Spectral model: bbodyrad<1> + bbodyrad<2>
------------------------------------------------------------
Parameters  : value         Lower 90%    Upper 90%
kT1 [keV]   : 7.56398        (-2.69336      3.41441)
R1^2/D10^2  : 1.20357        (-0.850582      3.99257)
kT2 [keV]   : 26.4501        (-7.0265      14.9322)
R2^2/D10^2  : 2.61127E-02    (-0.0205252   0.0547456)
------------------------------------------------------------
#Fit statistic : Chi-Squared =          63.34 using 59 PHA bins.
# Reduced chi-squared =          1.152 for     55 degrees of freedom
# Null hypothesis probability =   2.057447e-01

Energy  Fluence     90% Error
[keV]   [erg/cm2]   [erg/cm2]
15- 25  4.135e-09   2.412e-09
25- 50  1.016e-08   5.374e-09
50-150  2.658e-08   1.518e-08
15-150  4.087e-08   2.110e-08
Peak spectrum fit
Power-law model

Time interval is from   -0.368 sec. to    0.632 sec.

Spectral model in power-law:
------------------------------------------------------------
Parameters  : value       lower 90%   higher 90%
Photon index: 1.33123     ( -0.413564   0.413332 )
Norm@50keV  : 4.32827E-03    ( -0.00107309   0.00106774 )
------------------------------------------------------------
#Fit statistic : Chi-Squared =          63.40 using 59 PHA bins.
# Reduced chi-squared =          1.112 for     57 degrees of freedom
# Null hypothesis probability =   2.609558e-01

Photon flux (15-150 keV)    in 1 sec: 0.519447 ( -0.128778  0.12911 ) ph/cm2/s
Energy fluence (15-150 keV)             : 4.24553e-08 ( -1.15747e-08  1.18398e-08 ) ergs/cm2
Cutoff power-law model

Time interval is from   -0.368 sec. to    0.632 sec.
Spectral model in the cutoff power-law:
------------------------------------------------------------
Parameters  : value       lower 90%   higher 90%
Photon index: 0.724574     ( -1.7834   0.964614 )
Epeak [keV] : 108.890      ( -109.208 -109.208 )
Norm@50keV  : 8.63180E-03    ( -0.00520763   0.0542682 )
------------------------------------------------------------
#Fit statistic : Chi-Squared =          62.82 using 59 PHA bins.
# Reduced chi-squared =          1.122 for     56 degrees of freedom
# Null hypothesis probability =   2.473899e-01

Photon flux (15-150 keV)    in 1 sec: 0.509061 ( -0.130639  0.131074 ) ph/cm2/s
Energy fluence (15-150 keV)             : 4.09715e-08 ( -1.21052e-08  1.23659e-08 ) ergs/cm2
Band function

Time interval is from   -0.368 sec. to    0.632 sec.

Spectral model in the Band function:
------------------------------------------------------------
Parameters  : value       lower 90%   higher 90%
alpha       : 0.402936   ( -0.72428   1.86409 )
beta        : -1.60546    ( 9.37167   19.3717 )
Epeak [keV] : 50.7632      ( -63.0409 -118.363 )
Norm@50keV   : 4.87316E-02    ( -0.0485016   71.0655 )
------------------------------------------------------------
#Fit statistic : Chi-Squared =          62.56 using 59 PHA bins.
# Reduced chi-squared =          1.138 for     55 degrees of freedom
# Null hypothesis probability =   2.255719e-01

Photon flux (15-150 keV)    in 1 sec: 0.510237 ( 6.48976  -0.129607 ) ph/cm2/s
Energy fluence (15-150 keV)             : 0 ( 0  0 ) ergs/cm2
Single BB

Spectral model blackbody:
------------------------------------------------------------
Parameters  : value    Lower 90%  Upper 90%
kT [keV]    : 17.3525  (-5.87207  8.08582)
R^2/D10^2   : 3.73458E-02  (-0.0265635   0.113437)
(R is the radius in km and D10 is the distance to the source in units of 10 kpc)
------------------------------------------------------------
#Fit statistic : Chi-Squared =          66.64 using 59 PHA bins.
# Reduced chi-squared =          1.169 for     57 degrees of freedom
# Null hypothesis probability =   1.792887e-01

Energy  Fluence     90% Error
[keV]   [erg/cm2]   [erg/cm2]
15- 25  2.277e-09   1.210e-09
25- 50  1.024e-08   5.566e-09
50-150  2.215e-08   1.279e-08
15-150  3.467e-08   1.747e-08
Thermal bremsstrahlung (OTTB)

Spectral model: thermal bremsstrahlung
------------------------------------------------------------
Parameters  : value         Lower 90%    Upper 90%
kT [keV]    : 199.363       (-104.283      -199.363)
Norm        : 2.14673       (-0.527239     0.527235)
------------------------------------------------------------
#Fit statistic : Chi-Squared =          63.79 using 59 PHA bins.
# Reduced chi-squared =          1.119 for     57 degrees of freedom
# Null hypothesis probability =   2.499586e-01

Energy  Fluence     90% Error
[keV]   [erg/cm2]   [erg/cm2]
15- 25  5.345e-09   3.212e-09
25- 50  1.028e-08   5.970e-09
50-150  2.255e-08   1.351e-08
15-150  3.818e-08   2.285e-08
Double BB

Spectral model: bbodyrad<1> + bbodyrad<2>
------------------------------------------------------------
Parameters  : value         Lower 90%    Upper 90%
kT1 [keV]   : 7.77747        (-3.75623      5.23842)
R1^2/D10^2  : 0.354134        (-0.296268      3.0902)
kT2 [keV]   : 29.6711        (-25.6452      65.3536)
R2^2/D10^2  : 4.90323E-03    (-0.00468457   0.0250086)
------------------------------------------------------------
#Fit statistic : Chi-Squared =          61.58 using 59 PHA bins.
# Reduced chi-squared =          1.120 for     55 degrees of freedom
# Null hypothesis probability =   2.523934e-01

Energy  Fluence     90% Error
[keV]   [erg/cm2]   [erg/cm2]
15- 25  4.470e-09   2.653e-09
25- 50  1.049e-08   5.690e-09
50-150  2.758e-08   1.547e-08
15-150  4.254e-08   2.231e-08
Pre-slew spectrum (Pre-slew PHA with pre-slew DRM)
Power-law model

Spectral model in power-law:
------------------------------------------------------------
Parameters  : value       lower 90%   higher 90%
Photon index: 1.31937     ( -0.246593   0.24902 )
Norm@50keV  : 1.52657E-02    ( -0.00238304   0.00237392 )
------------------------------------------------------------
#Fit statistic : Chi-Squared =          68.13 using 59 PHA bins.
# Reduced chi-squared =          1.195 for     57 degrees of freedom
# Null hypothesis probability =   1.485366e-01

Photon flux (15-150 keV)    in 0.276 sec: 1.82790 ( -0.282938  0.28317 ) ph/cm2/s
Energy fluence (15-150 keV)             : 4.1442e-08 ( -7.19827e-09  7.30169e-09 ) ergs/cm2
Cutoff power-law model

Spectral model in the cutoff power-law:
------------------------------------------------------------
Parameters  : value       lower 90%   higher 90%
Photon index: 0.474534     ( -1.09226   0.886121 )
Epeak [keV] : 94.0826      ( -31.9515 -94.1023 )
Norm@50keV  : 3.97923E-02    ( -0.0246046   0.0909074 )
------------------------------------------------------------
#Fit statistic : Chi-Squared =          65.46 using 59 PHA bins.
# Reduced chi-squared =          1.169 for     56 degrees of freedom
# Null hypothesis probability =   1.813890e-01

Photon flux (15-150 keV)    in 0.276 sec: 1.78555 ( -0.28568  0.28628 ) ph/cm2/s
Energy fluence (15-150 keV)             : 3.97153e-08 ( -7.49036e-09  7.60076e-09 ) ergs/cm2
Band function

Spectral model in the Band function:
------------------------------------------------------------
Parameters  : value       lower 90%   higher 90%
alpha       : -0.479708   ( -0.484961   1.27256 )
beta        : -10.0000    ( 10   1.77636e-15 )
Epeak [keV] : 94.3565      ( -30.4786 250.482 )
Norm@50keV   : 3.95571E-02    ( -0.0245921   0.0910215 )
------------------------------------------------------------
#Fit statistic : Chi-Squared =          65.46 using 59 PHA bins.
# Reduced chi-squared =          1.190 for     55 degrees of freedom
# Null hypothesis probability =   1.579622e-01

Photon flux (15-150 keV)    in 0.276 sec: 1.80128 ( 5.19872  -0.27513 ) ph/cm2/s
Energy fluence (15-150 keV)             : 0 ( 0  0 ) ergs/cm2
S(25-50 keV) vs. S(50-100 keV) plot

S(25-50 keV)  = 9.32e-09
S(50-100 keV) = 1.49e-08
T90 vs. Hardness ratio plot

T90                                   = 0.235999941825867 sec.
Hardness ratio (energy fluence ratio) = 1.59871
Color vs. Color plot

Count Ratio  (25-50 keV) / (15-25 keV) = 1.67343
Count Ratio (50-100 keV) / (15-25 keV) = 1.27876
Mask shadow pattern

IMX = -4.213536167508830E-01, IMY = 2.408422241329696E-01
TIME vs. PHA plot around the trigger time

Blue+Cyan dotted lines: Time interval of the scaled map
From 0.000000 to 0.256000
TIME vs. DetID plot around the trigger time

Blue+Cyan dotted lines: Time interval of the scaled map
From 0.000000 to 0.256000
100 us light curve (15-350 keV)

Blue+Cyan dotted lines: Time interval of the scaled map
From 0.000000 to 0.256000
Spacecraft aspect plot

Bright source in the pre-burst/pre-slew/post-slew images
Pre-burst image of 15-350 keV band
Time interval of the image:
-127.603410 -0.008000

# RAcent  DECcent POSerr Theta    Phi  PeakCts   SNR AngSep     Name
#  [deg]    [deg]    ['] [deg]  [deg]                   [']
 82.8395 -29.4367    2.5  39.9  103.1   2.0733   4.6 ------	UNKNOWN
Pre-slew background subtracted image of 15-350 keV band
Time interval of the image:
-0.008000 0.268000

# RAcent  DECcent POSerr Theta    Phi  PeakCts   SNR AngSep     Name
#  [deg]    [deg]    ['] [deg]  [deg]                   [']
 20.0408 -35.7984    0.9  25.9 -150.2   0.0733  12.5 ------	UNKNOWN
  2.3588 -59.7460    2.3  50.4 -167.7   0.0691   5.0 ------	UNKNOWN
 34.5881  35.6914    2.5  53.8  -18.3   0.0748   4.6 ------	UNKNOWN
Post-slew image of 15-350 keV band
Time interval of the image:
-239.104000 962.947400

# RAcent  DECcent POSerr Theta    Phi  PeakCts   SNR AngSep     Name
#  [deg]    [deg]    ['] [deg]  [deg]                   [']
 69.2734 -62.6067    2.4  49.0  151.3   9.9071   4.9 ------	UNKNOWN
 54.3460  -9.0377    2.6  15.6   46.1   2.2720   4.4 ------	UNKNOWN
 38.9553 -56.1350    2.7  38.4  170.0   3.5608   4.4 ------	UNKNOWN
 58.0458  35.1919    2.9  55.3    5.1   8.8750   4.1 ------	UNKNOWN
 19.3257 -62.2979    2.9  47.1 -178.3   4.3293   4.0 ------	UNKNOWN
 37.7293   5.6590    3.4  23.6  -20.0   1.5624   3.4 ------	UNKNOWN
 41.2178  34.2118    3.0  51.9  -11.6   5.2831   3.9 ------	UNKNOWN
342.0948 -55.3233    4.0  58.0 -156.8  12.6343   2.9 ------	UNKNOWN
349.9963 -31.7930    3.2  47.9 -129.0   8.9488   3.6 ------	UNKNOWN
Plot creation:
Sat May 30 20:12:15 EDT 2015