Special notes of this burst
Image
Pre-slew 15.0-350.0 keV image (Event data)

#   RAcent    DECcent   POSerr    Theta     Phi              Peak Cts       SNR   Name
   47.5490    28.4948   0.0057    11.3491   109.5526         0.2940537     33.860 TRIG_00516997

Foreground time interval of the image:
  0.000   0.128 (delta_t =   0.128 [sec])
Background time interval of the image:
-657.567 -640.191 (delta_t =  17.377 [sec])
-239.068   0.000 (delta_t = 239.068 [sec])
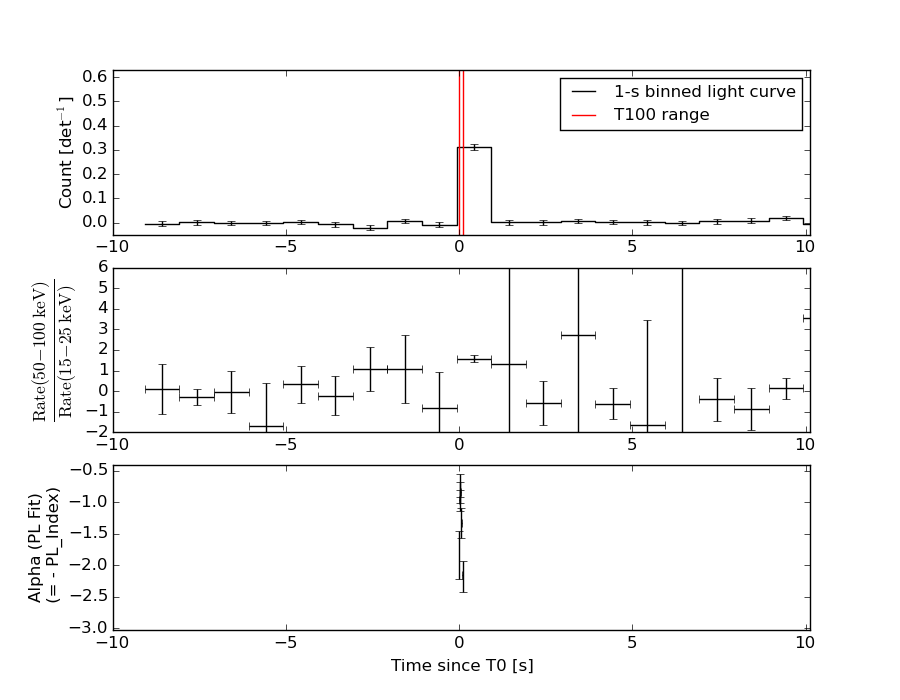
Lightcurves
Notes:
- 1) The mask-weighted light curves are using the flight position.
- 2) Multiple plots of different time binning/intervals are shown to cover all scenarios of short/long GRBs, rate/image triggers, and real/false positives.
- 3) For all the mask-weighted lightcurves, the y-axis units are counts/sec/det where a det is 0.4 x 0.4 = 0.16 sq cm.
- 4) The verticle lines correspond to following: green dotted lines are T50 interval, black dotted lines are T90 interval, blue solid line(s) is a spacecraft slew start time, and orange solid line(s) is a spacecraft slew end time.
- 5) Time of each bin is in the middle of the bin.
1 s binning
From T0-310 s to T0+310 s

From T100_start - 20 s to T100_end + 30 s

Full time interval

64 ms binning
Full time interval
From T100_start to T100_end

From T0-5 sec to T0+5 sec

16 ms binning
From T100_start-5 s to T100_start+5 s

Blue+Cyan dotted lines: Time interval of the scaled map
From 0.000000 to 0.064000
8 ms binning
From T100_start-3 s to T100_start+3 s

Blue+Cyan dotted lines: Time interval of the scaled map
From 0.000000 to 0.064000
2 ms binning
From T100_start-1 s to T100_start+1 s

Blue+Cyan dotted lines: Time interval of the scaled map
From 0.000000 to 0.064000
SN=5 or 10 sec. binning (whichever binning is satisfied first)

SN=5 or 10 sec. binning (T < 200 sec)

Quad-rate summed light curves (from T0-300s to T0+1000s)

The mask-weighted light curves based on cleaned DPHs

Spectral Evolution
Spectra
Notes:
- 1) The fitting includes the systematic errors.
- 2) When the burst includes telescope slew time periods, the fitting uses an average response file made from multiple 5-s response files through out the slew time plus single time preiod for the non-slew times, and weighted by the total counts in the corresponding time period using addrmf. An average response file is needed becuase a spectral fit using the pre-slew DRM will introduce some errors in both a spectral shape and a normalization if the PHA file contains a lot of the slew/post-slew time interval.
- 3) For fits to more complicated models (e.g. a power-law over a cutoff power-law), the BAT team has decided to require a chi-square improvement of more than 6 for each extra dof.
Time averaged spectrum fit using the average DRM
Power-law model

Time interval is from    0.000 sec. to    0.128 sec.

Spectral model in power-law:
------------------------------------------------------------
Parameters  : value       lower 90%   higher 90%
Photon index: 0.992083     ( -0.089597   0.0891914 )
Norm@50keV  : 0.143079    ( -0.00748925   0.00748869 )
------------------------------------------------------------
#Fit statistic : Chi-Squared =          64.32 using 59 PHA bins.
# Reduced chi-squared =          1.128 for     57 degrees of freedom
# Null hypothesis probability =   2.358180e-01

Photon flux (15-150 keV)    in 0.128 sec: 16.4660 ( -0.86223  0.861478 ) ph/cm2/s
Energy fluence (15-150 keV)             : 1.98456e-07 ( -1.21697e-08  1.2523e-08 ) ergs/cm2
Cutoff power-law model

Time interval is from    0.000 sec. to    0.128 sec.
Spectral model in the cutoff power-law:
------------------------------------------------------------
Parameters  : value       lower 90%   higher 90%
Photon index: 0.675105     ( -0.372192   0.339679 )
Epeak [keV] : 222.885      ( -92.5833 -222.887 )
Norm@50keV  : 0.203660    ( -0.0554945   0.10073 )
------------------------------------------------------------
#Fit statistic : Chi-Squared =          61.83 using 59 PHA bins.
# Reduced chi-squared =          1.104 for     56 degrees of freedom
# Null hypothesis probability =   2.758933e-01

Photon flux (15-150 keV)    in 0.128 sec: 16.2966 ( -0.8846  0.8821 ) ph/cm2/s
Energy fluence (15-150 keV)             : 1.94264e-07 ( 0  0 ) ergs/cm2
Band function

Time interval is from    0.000 sec. to    0.128 sec.

Spectral model in the Band function:
------------------------------------------------------------
Parameters  : value       lower 90%   higher 90%
alpha       : 4.86977   ( -4.831   -4.86977 )
beta        : -1.09284    ( -0.107321   0.104857 )
Epeak [keV] : 28.9767      ( -4.34796 3.92911 )
Norm@50keV   : 3452.23    ( -179.9   10121.6 )
------------------------------------------------------------
#Fit statistic : Chi-Squared =          56.79 using 59 PHA bins.
# Reduced chi-squared =          1.032 for     55 degrees of freedom
# Null hypothesis probability =   4.083016e-01

Photon flux (15-150 keV)    in 0.128 sec:  (    ) ph/cm2/s
Energy fluence (15-150 keV)             : 0 ( 0  0 ) ergs/cm2
Single BB

Spectral model blackbody:
------------------------------------------------------------
Parameters  : value    Lower 90%  Upper 90%
kT [keV]    : 19.9704  (  )
R^2/D10^2   : 0.805583  (   )
(R is the radius in km and D10 is the distance to the source in units of 10 kpc)
------------------------------------------------------------
#Fit statistic : Chi-Squared =         117.60 using 59 PHA bins.
# Reduced chi-squared =         2.0631 for     57 degrees of freedom
# Null hypothesis probability =   4.226049e-06

Energy  Fluence     90% Error
[keV]   [erg/cm2]   [erg/cm2]
15- 25  7.932e-09   7.795e-10
25- 50  3.947e-08   2.746e-09
50-150  1.167e-07   1.147e-08
15-150  1.641e-07   1.139e-08
Thermal bremsstrahlung (OTTB)

Spectral model: thermal bremsstrahlung
------------------------------------------------------------
Parameters  : value         Lower 90%    Upper 90%
kT [keV]    : 199.363       (      )
Norm        : 62.7244       (     )
------------------------------------------------------------
#Fit statistic : Chi-Squared =         154.92 using 59 PHA bins.
# Reduced chi-squared =         2.7180 for     57 degrees of freedom
# Null hypothesis probability =   5.444918e-11

Energy  Fluence     90% Error
[keV]   [erg/cm2]   [erg/cm2]
15- 25  1.999e-08   1.158e-09
25- 50  3.846e-08   3.002e-09
50-150  8.435e-08   1.969e-08
15-150  1.428e-07   2.775e-08
Double BB

Spectral model: bbodyrad<1> + bbodyrad<2>
------------------------------------------------------------
Parameters  : value         Lower 90%    Upper 90%
kT1 [keV]   : 9.48863        (-2.15228      2.54836)
R1^2/D10^2  : 4.78057        (-2.12988      4.83058)
kT2 [keV]   : 38.8362        (-9.40564      28.6112)
R2^2/D10^2  : 8.36656E-02    (-0.0644068   0.068091)
------------------------------------------------------------
#Fit statistic : Chi-Squared =          59.90 using 59 PHA bins.
# Reduced chi-squared =          1.089 for     55 degrees of freedom
# Null hypothesis probability =   3.024564e-01

Energy  Fluence     90% Error
[keV]   [erg/cm2]   [erg/cm2]
15- 25  1.313e-08   2.838e-09
25- 50  3.973e-08   7.885e-09
50-150  1.439e-07   6.129e-08
15-150  1.968e-07   6.630e-08
Peak spectrum fit
Power-law model

Time interval is from   -0.434 sec. to    0.566 sec.

Spectral model in power-law:
------------------------------------------------------------
Parameters  : value       lower 90%   higher 90%
Photon index: 1.03872     ( -0.12135   0.119932 )
Norm@50keV  : 1.91597E-02    ( -0.00130952   0.00130942 )
------------------------------------------------------------
#Fit statistic : Chi-Squared =          52.63 using 59 PHA bins.
# Reduced chi-squared =         0.9234 for     57 degrees of freedom
# Null hypothesis probability =   6.395168e-01

Photon flux (15-150 keV)    in 1 sec: 2.21106 ( -0.152661  0.152729 ) ph/cm2/s
Energy fluence (15-150 keV)             : 2.04411e-07 ( -1.60604e-08  1.6176e-08 ) ergs/cm2
Cutoff power-law model

Time interval is from   -0.434 sec. to    0.566 sec.
Spectral model in the cutoff power-law:
------------------------------------------------------------
Parameters  : value       lower 90%   higher 90%
Photon index: 0.838242     ( -0.489828   0.259231 )
Epeak [keV] : 313.177      ( -313.178 -313.178 )
Norm@50keV  : 2.38622E-02    ( -0.00574322   0.0161506 )
------------------------------------------------------------
#Fit statistic : Chi-Squared =          52.05 using 59 PHA bins.
# Reduced chi-squared =         0.9295 for     56 degrees of freedom
# Null hypothesis probability =   6.250831e-01

Photon flux (15-150 keV)    in 1 sec: 2.19361 ( -0.15764  0.15735 ) ph/cm2/s
Energy fluence (15-150 keV)             : 2.01666e-07 ( -1.7547e-08  1.7358e-08 ) ergs/cm2
Band function

Time interval is from   -0.434 sec. to    0.566 sec.

Spectral model in the Band function:
------------------------------------------------------------
Parameters  : value       lower 90%   higher 90%
alpha       : 4.96198   ( -14.7043   -4.96198 )
beta        : -1.11464    ( -0.168966   0.136823 )
Epeak [keV] : 27.5069      ( -8.80222 5.56648 )
Norm@50keV   : 737.677    ( -50.2764   9237.1 )
------------------------------------------------------------
#Fit statistic : Chi-Squared =          49.75 using 59 PHA bins.
# Reduced chi-squared =         0.9045 for     55 degrees of freedom
# Null hypothesis probability =   6.748792e-01

Photon flux (15-150 keV)    in 1 sec:  (    ) ph/cm2/s
Energy fluence (15-150 keV)             : 0 ( 0  0 ) ergs/cm2
Single BB

Spectral model blackbody:
------------------------------------------------------------
Parameters  : value    Lower 90%  Upper 90%
kT [keV]    : 20.2094  (-1.90912  2.17676)
R^2/D10^2   : 0.101830  (-0.0279335   0.0375566)
(R is the radius in km and D10 is the distance to the source in units of 10 kpc)
------------------------------------------------------------
#Fit statistic : Chi-Squared =          89.15 using 59 PHA bins.
# Reduced chi-squared =          1.564 for     57 degrees of freedom
# Null hypothesis probability =   4.143095e-03

Energy  Fluence     90% Error
[keV]   [erg/cm2]   [erg/cm2]
15- 25  7.984e-09   1.140e-09
25- 50  4.004e-08   3.805e-09
50-150  1.214e-07   1.490e-08
15-150  1.694e-07   1.510e-08
Thermal bremsstrahlung (OTTB)

Spectral model: thermal bremsstrahlung
------------------------------------------------------------
Parameters  : value         Lower 90%    Upper 90%
kT [keV]    : 200.000       (      )
Norm        : 8.76809       (-0.623768     0.623768)
------------------------------------------------------------
#Fit statistic : Chi-Squared =          97.61 using 59 PHA bins.
# Reduced chi-squared =          1.712 for     57 degrees of freedom
# Null hypothesis probability =   6.555106e-04

Energy  Fluence     90% Error
[keV]   [erg/cm2]   [erg/cm2]
15- 25  2.182e-08   1.870e-09
25- 50  4.199e-08   6.280e-09
50-150  9.208e-08   3.153e-08
15-150  1.559e-07   4.588e-08
Double BB
Spectral model: bbodyrad<1> + bbodyrad<2>
------------------------------------------------------------
Parameters  : value         Lower 90%    Upper 90%
kT1 [keV]   : 8.94286        (-2.43014      3.06207)
R1^2/D10^2  : 0.792909        (-0.429258      1.18526)
kT2 [keV]   : 37.8073        (-10.0534      37.239)
R2^2/D10^2  : 1.20762E-02    (-0.0100085   0.0203814)
------------------------------------------------------------
#Fit statistic : Chi-Squared =          51.30 using 59 PHA bins.
# Reduced chi-squared =         0.9327 for     55 degrees of freedom
# Null hypothesis probability =   6.169295e-01

Energy  Fluence     90% Error
[keV]   [erg/cm2]   [erg/cm2]
15- 25  1.462e-08   4.815e-09
25- 50  4.144e-08   1.251e-08
50-150  1.480e-07   6.767e-08
15-150  2.041e-07   7.637e-08
Pre-slew spectrum (Pre-slew PHA with pre-slew DRM)
Power-law model
Spectral model in power-law:
------------------------------------------------------------
Parameters  : value       lower 90%   higher 90%
Photon index: 0.992083     ( -0.089597   0.0891914 )
Norm@50keV  : 0.143079    ( -0.00748925   0.00748869 )
------------------------------------------------------------
#Fit statistic : Chi-Squared =          64.32 using 59 PHA bins.
# Reduced chi-squared =          1.128 for     57 degrees of freedom
# Null hypothesis probability =   2.358180e-01

Photon flux (15-150 keV)    in 0.128 sec: 16.4660 ( -0.86223  0.861478 ) ph/cm2/s
Energy fluence (15-150 keV)             : 1.98456e-07 ( -1.21697e-08  1.2523e-08 ) ergs/cm2
Cutoff power-law model
Spectral model in the cutoff power-law:
------------------------------------------------------------
Parameters  : value       lower 90%   higher 90%
Photon index: 0.675105     ( -0.372192   0.339679 )
Epeak [keV] : 222.885      ( -92.5833 -222.887 )
Norm@50keV  : 0.203660    ( -0.0554945   0.10073 )
------------------------------------------------------------
#Fit statistic : Chi-Squared =          61.83 using 59 PHA bins.
# Reduced chi-squared =          1.104 for     56 degrees of freedom
# Null hypothesis probability =   2.758933e-01

Photon flux (15-150 keV)    in 0.128 sec: 16.2966 ( -0.8846  0.8821 ) ph/cm2/s
Energy fluence (15-150 keV)             : 1.94264e-07 ( 0  0 ) ergs/cm2
Band function
Spectral model in the Band function:
------------------------------------------------------------
Parameters  : value       lower 90%   higher 90%
alpha       : 4.86977   ( -4.83102   -4.86977 )
beta        : -1.09284    ( -0.107321   0.104857 )
Epeak [keV] : 28.9767      ( -4.34796 3.92911 )
Norm@50keV   : 3452.23    ( -179.9   10121.6 )
------------------------------------------------------------
#Fit statistic : Chi-Squared =          56.79 using 59 PHA bins.
# Reduced chi-squared =          1.032 for     55 degrees of freedom
# Null hypothesis probability =   4.083016e-01

Photon flux (15-150 keV)    in 0.128 sec:  (    ) ph/cm2/s
Energy fluence (15-150 keV)             : 0 ( 0  0 ) ergs/cm2
S(25-50 keV) vs. S(50-100 keV) plot

S(25-50 keV)  = 3.66e-08
S(50-100 keV) = 7.36e-08
T90 vs. Hardness ratio plot

T90                                   = 0.0999999046325684 sec.
Hardness ratio (energy fluence ratio) = 2.01093
Color vs. Color plot

Count Ratio  (25-50 keV) / (15-25 keV) = 1.85479
Count Ratio (50-100 keV) / (15-25 keV) = 1.90415
Mask shadow pattern

IMX = -6.717245590820499E-02, IMY = -1.891371247912358E-01
TIME vs. PHA plot around the trigger time

Blue+Cyan dotted lines: Time interval of the scaled map
From 0.000000 to 0.064000
TIME vs. DetID plot around the trigger time

Blue+Cyan dotted lines: Time interval of the scaled map
From 0.000000 to 0.064000
100 us light curve (15-350 keV)

Blue+Cyan dotted lines: Time interval of the scaled map
From 0.000000 to 0.064000
Spacecraft aspect plot

Bright source in the pre-burst/pre-slew/post-slew images
Pre-burst image of 15-350 keV band
Time interval of the image:
-657.567400 -640.190500
-239.068000 0.000000

# RAcent  DECcent POSerr Theta    Phi  PeakCts   SNR AngSep     Name
#  [deg]    [deg]    ['] [deg]  [deg]                   [']
326.1660  38.2232    4.6  58.8  -20.7   3.0771   2.5    5.9	Cyg X-2
 10.3249  66.6781    2.7  44.2   24.5   1.5516   4.3 ------	UNKNOWN
 75.1851  -4.5296    2.9  48.9  160.4   2.9520   4.0 ------	UNKNOWN
 10.5027  47.4878    2.4  29.6    3.4   0.9683   4.9 ------	UNKNOWN
338.3605  46.8582    2.5  49.5  -10.5   1.7101   4.6 ------	UNKNOWN
 49.6163 -24.2463    2.9  51.5 -158.3   2.0616   4.0 ------	UNKNOWN
 31.7743 -12.1515    3.1  37.6 -135.9   1.2198   3.7 ------	UNKNOWN
 35.8994 -27.8760    3.3  53.2 -142.2   3.4967   3.5 ------	UNKNOWN
354.4565   7.8306    2.8  42.7  -68.5   3.9896   4.1  575.1	UNKNOWN
 25.1472 -21.5895    3.0  48.0 -128.8   3.1938   3.9 ------	UNKNOWN
Pre-slew background subtracted image of 15-350 keV band
Time interval of the image:
0.000000 0.128000

# RAcent  DECcent POSerr Theta    Phi  PeakCts   SNR AngSep     Name
#  [deg]    [deg]    ['] [deg]  [deg]                   [']
326.1591  38.3321    5.4  58.8  -20.5   0.1130   2.1    0.9	Cyg X-2
 47.5490  28.4948    0.3  11.3  109.6   0.2941  33.9 ------	UNKNOWN
 13.0763 -10.2408    2.1  41.7 -107.5   0.1732   5.6 ------	UNKNOWN
Post-slew image of 15-350 keV band
Time interval of the image:
51.832600 662.964900

# RAcent  DECcent POSerr Theta    Phi  PeakCts   SNR AngSep     Name
#  [deg]    [deg]    ['] [deg]  [deg]                   [']
 83.6409  22.0128    0.5  33.2  113.3  24.7545  24.3    0.4	Crab
 36.2541  72.7945    2.9  44.7   15.7   3.9846   4.0 ------	UNKNOWN
 51.3681 -25.4206    3.0  54.0 -163.9   6.3668   3.8 ------	UNKNOWN
337.9465  54.9533    2.9  55.5  -20.4   7.2141   3.9 ------	UNKNOWN
 24.5315 -14.0155    2.5  48.0 -128.9  10.8692   4.6 ------	UNKNOWN
349.5269  33.7644    3.4  49.3  -48.1  10.1321   3.4 ------	UNKNOWN
Plot creation:
Sat May 30 20:10:15 EDT 2015