Special notes of this burst
Image
Pre-slew 15.0-350.0 keV image (Event data)

#   RAcent    DECcent   POSerr    Theta     Phi              Peak Cts       SNR   Name
  251.8117    23.8823   0.0177    41.6293   164.0935         1.0192097     10.869 TRIG_00517566

Foreground time interval of the image:
 -1.424  15.912 (delta_t =  17.336 [sec])
Background time interval of the image:
-48.835  -1.424 (delta_t =  47.411 [sec])
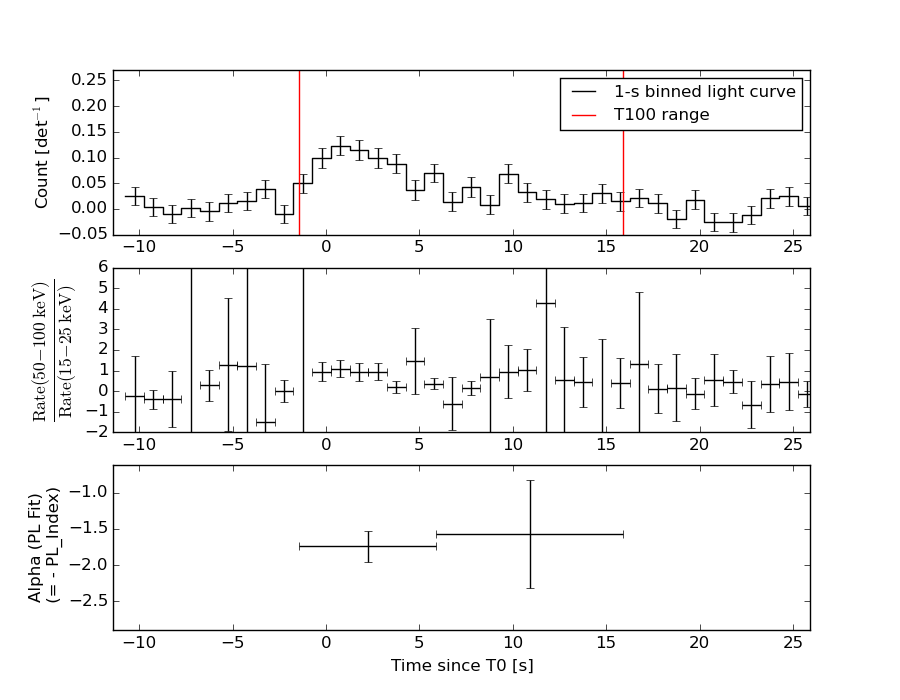
Lightcurves
Notes:
- 1) The mask-weighted light curves are using the flight position.
- 2) Multiple plots of different time binning/intervals are shown to cover all scenarios of short/long GRBs, rate/image triggers, and real/false positives.
- 3) For all the mask-weighted lightcurves, the y-axis units are counts/sec/det where a det is 0.4 x 0.4 = 0.16 sq cm.
- 4) The verticle lines correspond to following: green dotted lines are T50 interval, black dotted lines are T90 interval, blue solid line(s) is a spacecraft slew start time, and orange solid line(s) is a spacecraft slew end time.
- 5) Time of each bin is in the middle of the bin.
1 s binning
From T0-310 s to T0+310 s
From T100_start - 20 s to T100_end + 30 s

Full time interval

64 ms binning
Full time interval
From T100_start to T100_end
From T0-5 sec to T0+5 sec
16 ms binning
From T100_start-5 s to T100_start+5 s
Blue+Cyan dotted lines: Time interval of the scaled map
From 0.000000 to 2.048000
8 ms binning
From T100_start-3 s to T100_start+3 s

Blue+Cyan dotted lines: Time interval of the scaled map
From 0.000000 to 2.048000
2 ms binning
From T100_start-1 s to T100_start+1 s

Blue+Cyan dotted lines: Time interval of the scaled map
From 0.000000 to 2.048000
SN=5 or 10 sec. binning (whichever binning is satisfied first)

SN=5 or 10 sec. binning (T < 200 sec)
Quad-rate summed light curves (from T0-300s to T0+1000s)
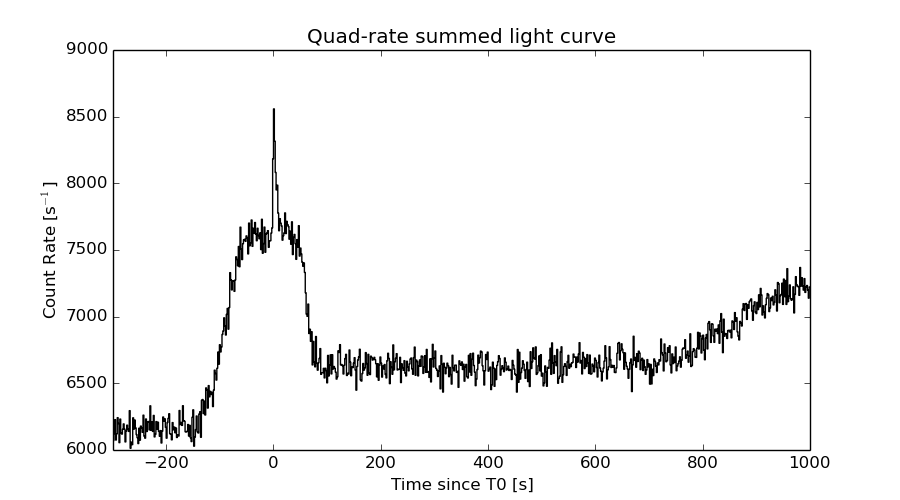
The mask-weighted light curves based on cleaned DPHs

Spectral Evolution
Spectra
Notes:
- 1) The fitting includes the systematic errors.
- 2) When the burst includes telescope slew time periods, the fitting uses an average response file made from multiple 5-s response files through out the slew time plus single time preiod for the non-slew times, and weighted by the total counts in the corresponding time period using addrmf. An average response file is needed becuase a spectral fit using the pre-slew DRM will introduce some errors in both a spectral shape and a normalization if the PHA file contains a lot of the slew/post-slew time interval.
- 3) For fits to more complicated models (e.g. a power-law over a cutoff power-law), the BAT team has decided to require a chi-square improvement of more than 6 for each extra dof.
Time averaged spectrum fit using the average DRM
Power-law model

Time interval is from   -1.424 sec. to   15.912 sec.

Spectral model in power-law:
------------------------------------------------------------
Parameters  : value       lower 90%   higher 90%
Photon index: 1.71202     ( -0.2368   0.24307 )
Norm@50keV  : 3.53416E-03    ( -0.00049511   0.000490044 )
------------------------------------------------------------
#Fit statistic : Chi-Squared =          53.09 using 59 PHA bins.
# Reduced chi-squared =         0.9314 for     57 degrees of freedom
# Null hypothesis probability =   6.224441e-01

Photon flux (15-150 keV)    in 17.34 sec: 0.471368 ( -0.0662128  0.0665558 ) ph/cm2/s
Energy fluence (15-150 keV)             : 5.66883e-07 ( -8.18732e-08  8.26105e-08 ) ergs/cm2
Cutoff power-law model

Time interval is from   -1.424 sec. to   15.912 sec.
Spectral model in the cutoff power-law:
------------------------------------------------------------
Parameters  : value       lower 90%   higher 90%
Photon index: 1.19464     ( -1.2335   0.721049 )
Epeak [keV] : 78.2552      ( -58.5563 -78.2545 )
Norm@50keV  : 6.41992E-03    ( -0.00312573   0.0190914 )
------------------------------------------------------------
#Fit statistic : Chi-Squared =          52.34 using 59 PHA bins.
# Reduced chi-squared =         0.9346 for     56 degrees of freedom
# Null hypothesis probability =   6.143227e-01

Photon flux (15-150 keV)    in 17.34 sec: 0.458571 ( -0.070889  0.070919 ) ph/cm2/s
Energy fluence (15-150 keV)             : 5.48379e-07 ( -8.97518e-08  9.01923e-08 ) ergs/cm2
Band function
Time interval is from   -1.424 sec. to   15.912 sec.

Spectral model in the Band function:
------------------------------------------------------------
Parameters  : value       lower 90%   higher 90%
alpha       : -1.07320   ( 1.07561   1.07561 )
beta        : -2.30222    ( 2.30515   0.790854 )
Epeak [keV] : 73.6820      ( -73.1876 -73.1876 )
Norm@50keV   : 7.30404E-03    ( -0.00366711   0 )
------------------------------------------------------------
#Fit statistic : Chi-Squared =          52.29 using 59 PHA bins.
# Reduced chi-squared =         0.9507 for     55 degrees of freedom
# Null hypothesis probability =   5.788013e-01

Photon flux (15-150 keV)    in 17.34 sec:  (    ) ph/cm2/s
Energy fluence (15-150 keV)             : 5.47179e-07 ( 0  0 ) ergs/cm2
Single BB

Spectral model blackbody:
------------------------------------------------------------
Parameters  : value    Lower 90%  Upper 90%
kT [keV]    : 14.2452  (-2.03953  2.40855)
R^2/D10^2   : 6.13316E-02  (-0.0269466   0.0469356)
(R is the radius in km and D10 is the distance to the source in units of 10 kpc)
------------------------------------------------------------
#Fit statistic : Chi-Squared =          61.74 using 59 PHA bins.
# Reduced chi-squared =          1.083 for     57 degrees of freedom
# Null hypothesis probability =   3.107123e-01

Energy  Fluence     90% Error
[keV]   [erg/cm2]   [erg/cm2]
15- 25  4.551e-08   1.197e-08
25- 50  1.722e-07   3.764e-08
50-150  2.321e-07   6.468e-08
15-150  4.497e-07   8.531e-08
Thermal bremsstrahlung (OTTB)

Spectral model: thermal bremsstrahlung
------------------------------------------------------------
Parameters  : value         Lower 90%    Upper 90%
kT [keV]    : 140.228       (-59.143      -138.284)
Norm        : 1.93259       (-0.300189     0.423353)
------------------------------------------------------------
#Fit statistic : Chi-Squared =          52.41 using 59 PHA bins.
# Reduced chi-squared =         0.9195 for     57 degrees of freedom
# Null hypothesis probability =   6.475756e-01

Energy  Fluence     90% Error
[keV]   [erg/cm2]   [erg/cm2]
15- 25  8.652e-08   3.099e-08
25- 50  1.588e-07   8.237e-08
50-150  3.046e-07   1.820e-07
15-150  5.499e-07   2.828e-07
Double BB
Spectral model: bbodyrad<1> + bbodyrad<2>
------------------------------------------------------------
Parameters  : value         Lower 90%    Upper 90%
kT1 [keV]   : 3.95378        (-2.06976      3.60965)
R1^2/D10^2  : 4.41208        (-4.09314      420.754)
kT2 [keV]   : 17.3826        (-3.27324      6.63345)
R2^2/D10^2  : 2.65586E-02    (-0.019656   0.0336012)
------------------------------------------------------------
#Fit statistic : Chi-Squared =          51.76 using 59 PHA bins.
# Reduced chi-squared =         0.9411 for     55 degrees of freedom
# Null hypothesis probability =   5.991861e-01

Energy  Fluence     90% Error
[keV]   [erg/cm2]   [erg/cm2]
15- 25  9.392e-08   4.711e-08
25- 50  1.498e-07   6.118e-08
50-150  2.757e-07   1.166e-07
15-150  5.194e-07   1.904e-07
Peak spectrum fit
Power-law model
Time interval is from    0.924 sec. to    1.924 sec.

Spectral model in power-law:
------------------------------------------------------------
Parameters  : value       lower 90%   higher 90%
Photon index: 1.87405     ( -0.434011   0.481605 )
Norm@50keV  : 8.84646E-03    ( -0.00239789   0.00223791 )
------------------------------------------------------------
#Fit statistic : Chi-Squared =          51.83 using 59 PHA bins.
# Reduced chi-squared =         0.9093 for     57 degrees of freedom
# Null hypothesis probability =   6.689243e-01

Photon flux (15-150 keV)    in 1 sec: 1.25580 ( -0.290068  0.290743 ) ph/cm2/s
Energy fluence (15-150 keV)             : 8.13252e-08 ( -2.08633e-08  2.12715e-08 ) ergs/cm2
Cutoff power-law model

Time interval is from    0.924 sec. to    1.924 sec.
Spectral model in the cutoff power-law:
------------------------------------------------------------
Parameters  : value       lower 90%   higher 90%
Photon index: 2.32521     (     )
Epeak [keV] : 123.918      (   )
Norm@50keV  : 5.15071E-03    (     )
------------------------------------------------------------
#Fit statistic : Chi-Squared =          51.18 using 59 PHA bins.
# Reduced chi-squared =         0.9139 for     56 degrees of freedom
# Null hypothesis probability =   6.575215e-01

Photon flux (15-150 keV)    in 1 sec: 1.25618 ( -0.288446  0.28974 ) ph/cm2/s
Energy fluence (15-150 keV)             : 8.11194e-08 ( -2.06121e-08  2.09116e-08 ) ergs/cm2
Band function

Time interval is from    0.924 sec. to    1.924 sec.

Spectral model in the Band function:
------------------------------------------------------------
Parameters  : value       lower 90%   higher 90%
alpha       : -1.48141   ( 1.48294   1.48294 )
beta        : -1.87332    ( 1.87369   0.433777 )
Epeak [keV] : 17.7427      ( -15.6901 -15.6901 )
Norm@50keV   : 2.19302E-02    ( -0.022389   0.623266 )
------------------------------------------------------------
#Fit statistic : Chi-Squared =          51.83 using 59 PHA bins.
# Reduced chi-squared =         0.9423 for     55 degrees of freedom
# Null hypothesis probability =   5.965984e-01

Photon flux (15-150 keV)    in 1 sec:  (    ) ph/cm2/s
Energy fluence (15-150 keV)             : 0 ( 0  0 ) ergs/cm2
Single BB

Spectral model blackbody:
------------------------------------------------------------
Parameters  : value    Lower 90%  Upper 90%
kT [keV]    : 10.1310  (-3.10792  5.40606)
R^2/D10^2   : 0.522447  (-0.409579   1.63042)
(R is the radius in km and D10 is the distance to the source in units of 10 kpc)
------------------------------------------------------------
#Fit statistic : Chi-Squared =          61.61 using 59 PHA bins.
# Reduced chi-squared =          1.081 for     57 degrees of freedom
# Null hypothesis probability =   3.147274e-01

Energy  Fluence     90% Error
[keV]   [erg/cm2]   [erg/cm2]
15- 25  1.097e-08   5.937e-09
25- 50  2.777e-08   1.233e-08
50-150  1.505e-08   8.994e-09
15-150  5.379e-08   2.684e-08
Thermal bremsstrahlung (OTTB)
Spectral model: thermal bremsstrahlung
------------------------------------------------------------
Parameters  : value         Lower 90%    Upper 90%
kT [keV]    : 99.9357       (-56.015      -99.9544)
Norm        : 5.42458       (-1.60038     2.55297)
------------------------------------------------------------
#Fit statistic : Chi-Squared =          53.26 using 59 PHA bins.
# Reduced chi-squared =         0.9345 for     57 degrees of freedom
# Null hypothesis probability =   6.160169e-01

Energy  Fluence     90% Error
[keV]   [erg/cm2]   [erg/cm2]
15- 25  1.418e-08   5.475e-09
25- 50  2.451e-08   1.207e-08
50-150  3.971e-08   2.998e-08
15-150  7.840e-08   5.068e-08
Double BB
Spectral model: bbodyrad<1> + bbodyrad<2>
------------------------------------------------------------
Parameters  : value         Lower 90%    Upper 90%
kT1 [keV]   : 6.32641        (-2.8421      3.53546)
R1^2/D10^2  : 2.72934        (-2.21859      32.6037)
kT2 [keV]   : 37.7401        (-34.3748      -37.8651)
R2^2/D10^2  : 3.96992E-03    (-0.0038448   0.0608043)
------------------------------------------------------------
#Fit statistic : Chi-Squared =          51.63 using 59 PHA bins.
# Reduced chi-squared =         0.9388 for     55 degrees of freedom
# Null hypothesis probability =   6.041255e-01

Energy  Fluence     90% Error
[keV]   [erg/cm2]   [erg/cm2]
15- 25  1.636e-08   9.320e-09
25- 50  2.252e-08   1.304e-08
50-150  4.721e-08   2.754e-08
15-150  8.609e-08   4.381e-08
Pre-slew spectrum (Pre-slew PHA with pre-slew DRM)
Power-law model
Spectral model in power-law:
------------------------------------------------------------
Parameters  : value       lower 90%   higher 90%
Photon index: 1.71202     ( -0.2368   0.24307 )
Norm@50keV  : 3.53416E-03    ( -0.00049511   0.000490044 )
------------------------------------------------------------
#Fit statistic : Chi-Squared =          53.09 using 59 PHA bins.
# Reduced chi-squared =         0.9314 for     57 degrees of freedom
# Null hypothesis probability =   6.224441e-01

Photon flux (15-150 keV)    in 17.34 sec: 0.471368 ( -0.0662128  0.0665558 ) ph/cm2/s
Energy fluence (15-150 keV)             : 5.66883e-07 ( -8.18732e-08  8.26105e-08 ) ergs/cm2
Cutoff power-law model
Spectral model in the cutoff power-law:
------------------------------------------------------------
Parameters  : value       lower 90%   higher 90%
Photon index: 1.19464     ( -1.2335   0.721049 )
Epeak [keV] : 78.2552      ( -58.5563 -78.2545 )
Norm@50keV  : 6.41992E-03    ( -0.00312573   0.0190914 )
------------------------------------------------------------
#Fit statistic : Chi-Squared =          52.34 using 59 PHA bins.
# Reduced chi-squared =         0.9346 for     56 degrees of freedom
# Null hypothesis probability =   6.143227e-01

Photon flux (15-150 keV)    in 17.34 sec: 0.458571 ( -0.070889  0.070919 ) ph/cm2/s
Energy fluence (15-150 keV)             : 5.48379e-07 ( -8.97518e-08  9.01923e-08 ) ergs/cm2
Band function

Spectral model in the Band function:
------------------------------------------------------------
Parameters  : value       lower 90%   higher 90%
alpha       : -1.07320   ( 1.07561   1.07561 )
beta        : -2.30222    ( 2.30515   0.790854 )
Epeak [keV] : 73.6820      ( -73.1876 -73.1876 )
Norm@50keV   : 7.30404E-03    ( -0.00366711   0 )
------------------------------------------------------------
#Fit statistic : Chi-Squared =          52.29 using 59 PHA bins.
# Reduced chi-squared =         0.9507 for     55 degrees of freedom
# Null hypothesis probability =   5.788013e-01

Photon flux (15-150 keV)    in 17.34 sec:  (    ) ph/cm2/s
Energy fluence (15-150 keV)             : 5.47179e-07 ( 0  0 ) ergs/cm2
S(25-50 keV) vs. S(50-100 keV) plot
S(25-50 keV)  = 1.54e-07
S(50-100 keV) = 1.88e-07
T90 vs. Hardness ratio plot

T90                                   = 14.1559999585152 sec.
Hardness ratio (energy fluence ratio) = 1.22078
Color vs. Color plot
Count Ratio  (25-50 keV) / (15-25 keV) = 1.19028
Count Ratio (50-100 keV) / (15-25 keV) = 0.873131
Mask shadow pattern
IMX = -8.547270635103429E-01, IMY = -2.435805688172751E-01
TIME vs. PHA plot around the trigger time
Blue+Cyan dotted lines: Time interval of the scaled map
From 0.000000 to 2.048000
TIME vs. DetID plot around the trigger time

Blue+Cyan dotted lines: Time interval of the scaled map
From 0.000000 to 2.048000
100 us light curve (15-350 keV)
Blue+Cyan dotted lines: Time interval of the scaled map
From 0.000000 to 2.048000
Spacecraft aspect plot
Bright source in the pre-burst/pre-slew/post-slew images
Pre-burst image of 15-350 keV band
Time interval of the image:
-48.835400 -1.424000

# RAcent  DECcent POSerr Theta    Phi  PeakCts   SNR AngSep     Name
#  [deg]    [deg]    ['] [deg]  [deg]                   [']
244.9871 -15.6459    0.6  11.8   88.3   1.5232  20.2    0.6	Sco X-1
254.4374  35.1950    6.3  52.7  168.7  -0.5067  -1.8    8.9	Her X-1
255.9891 -37.8245    1.6  20.4   -5.9   0.5347   7.2    1.2	4U 1700-377
256.3957 -36.5698   10.9  19.2   -6.7   0.0776   1.1    9.0	GX 349+2
262.9212 -24.8869   11.7   9.2  -43.4   0.0689   1.0    9.7	GX 1+4
264.7760 -44.4448  106.6  27.8  -20.3   0.0086   0.1    1.5	4U 1735-44
268.2338  -1.3484    5.1  19.4 -153.2   0.1768   2.3   10.2	SW J1753.5-0127
270.2527 -25.0162    4.1  14.4  -64.4   0.2118   2.8    4.1	GX 5-1
270.2201 -25.6700    4.5  14.7  -62.1   0.1996   2.6    6.2	GRS 1758-258
273.8504 -14.0555    6.5  16.4 -108.0   0.1372   1.8    9.1	GX 17+2
275.7568 -30.3907    3.1  21.3  -57.7   0.3149   3.6    8.8	H1820-303
284.8711 -24.8795    4.5  26.9  -77.7   0.2589   2.5    9.3	HT1900.1-2455
288.7432  11.0300    2.9  42.2 -138.6   0.5946   4.0    6.0	GRS 1915+105
263.1570 -33.7480   17.5  17.2  -25.7  -0.0478  -0.7    9.9	GX 354-0
207.6969 -42.6271    2.1  48.8   39.5   1.8412   5.4 ------	UNKNOWN
254.4952 -11.2597    2.2   6.7  148.5   0.3611   5.3 ------	UNKNOWN
263.2763  13.0098    2.4  31.0 -176.9   0.4032   4.8 ------	UNKNOWN
296.2114  17.4575    2.3  51.9 -138.8   1.7667   5.0 ------	UNKNOWN
Pre-slew background subtracted image of 15-350 keV band
Time interval of the image:
-1.424000 15.912000

# RAcent  DECcent POSerr Theta    Phi  PeakCts   SNR AngSep     Name
#  [deg]    [deg]    ['] [deg]  [deg]                   [']
244.9799 -15.6407  195.3  11.8   88.4  -0.0029  -0.1    0.0	Sco X-1
254.5808  35.3642   18.2  52.8  168.8   0.1261   0.6    6.2	Her X-1
256.0225 -38.0001   13.1  20.6   -6.0  -0.0449  -0.9    9.5	4U 1700-377
256.4531 -36.3248    4.6  18.9   -6.8  -0.1262  -2.5    6.0	GX 349+2
262.9890 -24.6914  138.6   9.1  -44.4   0.0039   0.1    3.4	GX 1+4
264.5445 -44.4965   52.1  27.8  -19.9   0.0110   0.2    8.9	4U 1735-44
268.5137  -1.4341    7.3  19.5 -152.4   0.0791   1.6    8.8	SW J1753.5-0127
270.1472 -24.9261    4.3  14.2  -64.6  -0.1287  -2.7   11.8	GX 5-1
270.2448 -25.5941    7.4  14.7  -62.4   0.0759   1.5    9.5	GRS 1758-258
273.9153 -14.1733  135.1  16.5 -107.6  -0.0045  -0.1    9.8	GX 17+2
275.8578 -30.3676    5.8  21.4  -57.9  -0.1131  -2.0    3.5	H1820-303
284.8711 -24.8749    5.9  26.9  -77.7  -0.1224  -1.9    9.4	HT1900.1-2455
288.6741  10.9737   18.4  42.1 -138.6  -0.0618  -0.6    7.5	GRS 1915+105
263.0656 -33.8462    5.3  17.3  -25.3   0.0995   2.2    3.9	GX 354-0
250.9318  20.7869    2.1  38.7  162.1   0.4070   5.6 ------	UNKNOWN
251.8117  23.8823    1.1  41.6  164.1   1.0184  10.9 ------	UNKNOWN
270.9243 -37.5952    2.2  23.5  -36.8   0.2647   5.2 ------	UNKNOWN
Post-slew image of 15-350 keV band
Time interval of the image:
86.164600 962.327900

# RAcent  DECcent POSerr Theta    Phi  PeakCts   SNR AngSep     Name
#  [deg]    [deg]    ['] [deg]  [deg]                   [']
244.9865 -15.6314    0.4  40.0   12.2  22.8926  30.8    0.7	Sco X-1
254.6352  35.4814    5.2  11.9 -166.5   1.0226   2.2   12.0	Her X-1
263.1198 -24.7307   13.1  49.8  -11.5   0.8459   0.9    6.1	GX 1+4
268.3675  -1.4041    2.3  30.0  -32.8   2.6022   5.1    2.9	SW J1753.5-0127
270.2426 -25.1015    2.4  52.1  -19.3   5.2064   4.8    2.6	GX 5-1
270.2628 -25.7720   14.1  52.8  -19.0   0.9738   0.8    2.8	GRS 1758-258
274.0202 -14.0757    6.4  43.7  -30.0   1.5026   1.8    2.5	GX 17+2
275.9998 -30.4972    0.0  59.1  -22.3   3.3797   1.2    8.7	H1820-303
288.7935  10.9233    1.8  37.5  -74.3   9.5734   6.5    1.4	GRS 1915+105
299.5725  35.1706    1.6  42.7 -114.7  14.4988   7.3    2.1	Cyg X-1
219.2397  28.4241    2.8  29.5  108.1   2.9974   4.1 ------	UNKNOWN
255.3276   2.4490    3.0  21.7   -7.6   1.6553   3.8 ------	UNKNOWN
268.4271 -17.8006    2.6  44.7  -20.8   3.3421   4.5 ------	UNKNOWN
313.3614  69.6301    3.6  58.0 -156.8  12.2133   3.2 ------	UNKNOWN
Plot creation:
Sat May 30 20:02:00 EDT 2015