Click here for the BAT GCN circular template
Image
Pre-slew 15.0-350.0 keV image (Event data)

#   RAcent    DECcent   POSerr    Theta     Phi              Peak Cts       SNR   Name
  212.5166     8.6815   0.0125    23.7030   117.8942         1.1165221     15.412 TRIG_00518200

Foreground time interval of the image:
 -0.016  29.856 (delta_t =  29.872 [sec])
Background time interval of the image:
-239.616  -0.016 (delta_t = 239.600 [sec])
Lightcurves
Notes:
- 1) The mask-weighted light curves are using the flight position.
- 2) Multiple plots of different time binning/intervals are shown to cover all scenarios of short/long GRBs, rate/image triggers, and real/false positives.
- 3) For all the mask-weighted lightcurves, the y-axis units are counts/sec/det where a det is 0.4 x 0.4 = 0.16 sq cm.
- 4) The verticle lines correspond to following: green dotted lines are T50 interval, black dotted lines are T90 interval, blue solid line(s) is a spacecraft slew start time, and orange solid line(s) is a spacecraft slew end time.
- 5) Time of each bin is in the middle of the bin.
1 s binning
From T0-310 s to T0+310 s

From T100_start - 20 s to T100_end + 30 s

Full time interval

64 ms binning
Full time interval

From T100_start to T100_end

From T0-5 sec to T0+5 sec

16 ms binning
From T100_start-5 s to T100_start+5 s

Blue+Cyan dotted lines: Time interval of the scaled map
From 0.000000 to 26.880000
8 ms binning
From T100_start-3 s to T100_start+3 s

Blue+Cyan dotted lines: Time interval of the scaled map
From 0.000000 to 26.880000
2 ms binning
From T100_start-1 s to T100_start+1 s

Blue+Cyan dotted lines: Time interval of the scaled map
From 0.000000 to 26.880000
SN=5 or 10 sec. binning (whichever binning is satisfied first)

SN=5 or 10 sec. binning (T < 200 sec)

Quad-rate summed light curves (from T0-300s to T0+1000s)

The mask-weighted light curves based on cleaned DPHs

Spectral Evolution

Spectra
Notes:
- 1) The fitting includes the systematic errors.
- 2) When the burst includes telescope slew time periods, the fitting uses an average response file made from multiple 5-s response files through out the slew time plus single time preiod for the non-slew times, and weighted by the total counts in the corresponding time period using addrmf. An average response file is needed becuase a spectral fit using the pre-slew DRM will introduce some errors in both a spectral shape and a normalization if the PHA file contains a lot of the slew/post-slew time interval.
- 3) For fits to more complicated models (e.g. a power-law over a cutoff power-law), the BAT team has decided to require a chi-square improvement of more than 6 for each extra dof.
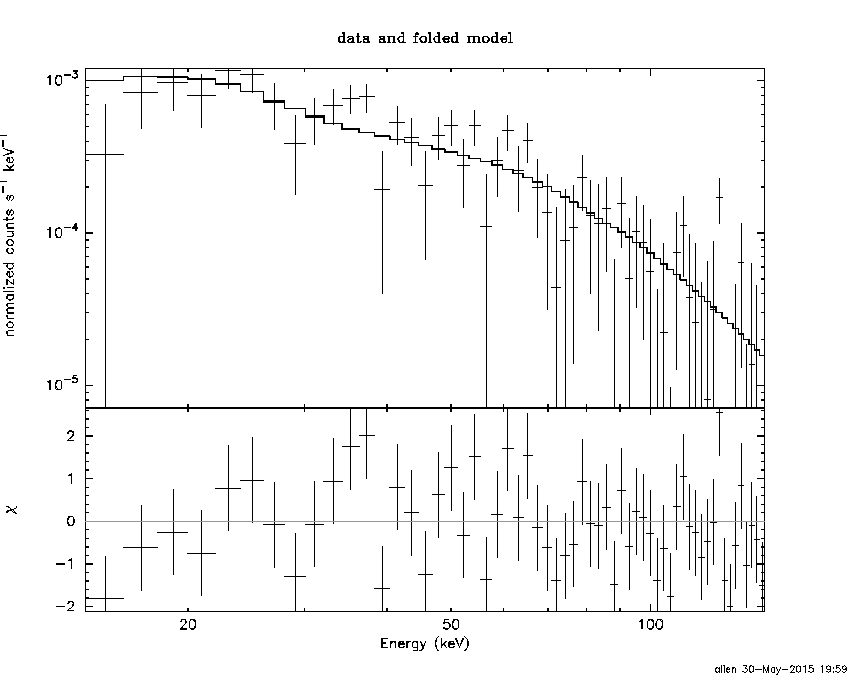
Time averaged spectrum fit using the average DRM
Power-law model

Time interval is from   -0.016 sec. to   29.856 sec.

Spectral model in power-law:
------------------------------------------------------------
Parameters  : value       lower 90%   higher 90%
Photon index: 1.57166     ( -0.182645   0.184875 )
Norm@50keV  : 2.19649E-03    ( -0.000246774   0.00024529 )
------------------------------------------------------------
#Fit statistic : Chi-Squared =          64.13 using 59 PHA bins.
# Reduced chi-squared =          1.125 for     57 degrees of freedom
# Null hypothesis probability =   2.408850e-01

Photon flux (15-150 keV)    in 29.87 sec: 0.279837 ( -0.0307238  0.0307924 ) ph/cm2/s
Energy fluence (15-150 keV)             : 6.15833e-07 ( -7.40471e-08  7.50194e-08 ) ergs/cm2
Cutoff power-law model

Time interval is from   -0.016 sec. to   29.856 sec.
Spectral model in the cutoff power-law:
------------------------------------------------------------
Parameters  : value       lower 90%   higher 90%
Photon index: 0.313765     ( -1.05251   0.841526 )
Epeak [keV] : 63.2855      ( -11.9922 35.8908 )
Norm@50keV  : 9.96298E-03    ( -0.00626168   0.0248162 )
------------------------------------------------------------
#Fit statistic : Chi-Squared =          56.99 using 59 PHA bins.
# Reduced chi-squared =          1.018 for     56 degrees of freedom
# Null hypothesis probability =   4.379510e-01

Photon flux (15-150 keV)    in 29.87 sec: 0.263654 ( -0.032336  0.032451 ) ph/cm2/s
Energy fluence (15-150 keV)             : 5.52831e-07 ( -8.05086e-08  8.43559e-08 ) ergs/cm2
Band function

Time interval is from   -0.016 sec. to   29.856 sec.

Spectral model in the Band function:
------------------------------------------------------------
Parameters  : value       lower 90%   higher 90%
alpha       : -0.313642   ( -0.661396   1.14057 )
beta        : -10.0000    ( 10   0 )
Epeak [keV] : 63.2727      ( -11.0067 35.8849 )
Norm@50keV   : 9.96515E-03    ( -0.00626419   0.0248946 )
------------------------------------------------------------
#Fit statistic : Chi-Squared =          56.99 using 59 PHA bins.
# Reduced chi-squared =          1.036 for     55 degrees of freedom
# Null hypothesis probability =   4.008561e-01

Photon flux (15-150 keV)    in 29.87 sec: 0.266353 (    ) ph/cm2/s
Energy fluence (15-150 keV)             : 5.53443e-07 ( 0  0 ) ergs/cm2
Single BB

Spectral model blackbody:
------------------------------------------------------------
Parameters  : value    Lower 90%  Upper 90%
kT [keV]    : 13.7346  (-1.60299  1.8561)
R^2/D10^2   : 4.35044E-02  (-0.0159825   0.0246372)
(R is the radius in km and D10 is the distance to the source in units of 10 kpc)
------------------------------------------------------------
#Fit statistic : Chi-Squared =          64.04 using 59 PHA bins.
# Reduced chi-squared =          1.124 for     57 degrees of freedom
# Null hypothesis probability =   2.431191e-01

Energy  Fluence     90% Error
[keV]   [erg/cm2]   [erg/cm2]
15- 25  5.186e-08   1.141e-08
25- 50  1.892e-07   2.646e-08
50-150  2.327e-07   5.073e-08
15-150  4.738e-07   7.049e-08
Thermal bremsstrahlung (OTTB)

Spectral model: thermal bremsstrahlung
------------------------------------------------------------
Parameters  : value         Lower 90%    Upper 90%
kT [keV]    : 163.938       (-62.7132      -162.677)
Norm        : 1.16241       (-0.134983     0.15765)
------------------------------------------------------------
#Fit statistic : Chi-Squared =          60.53 using 59 PHA bins.
# Reduced chi-squared =          1.062 for     57 degrees of freedom
# Null hypothesis probability =   3.496688e-01

Energy  Fluence     90% Error
[keV]   [erg/cm2]   [erg/cm2]
15- 25  8.845e-08   4.938e-08
25- 50  1.660e-07   8.852e-08
50-150  3.395e-07   1.925e-07
15-150  5.939e-07   3.230e-07
Double BB

Spectral model: bbodyrad<1> + bbodyrad<2>
------------------------------------------------------------
Parameters  : value         Lower 90%    Upper 90%
kT1 [keV]   : 7.47994        (-3.29541      42.7455)
R1^2/D10^2  : 0.193159        (-0.131885      1.03765)
kT2 [keV]   : 20.2756        (-5.45242      29.9442)
R2^2/D10^2  : 7.88115E-03    (-0.00762453   0.0137839)
------------------------------------------------------------
#Fit statistic : Chi-Squared =          56.44 using 59 PHA bins.
# Reduced chi-squared =          1.026 for     55 degrees of freedom
# Null hypothesis probability =   4.208066e-01

Energy  Fluence     90% Error
[keV]   [erg/cm2]   [erg/cm2]
15- 25  7.382e-08   4.143e-08
25- 50  1.790e-07   9.095e-08
50-150  3.027e-07   1.701e-07
15-150  5.556e-07   2.839e-07
Peak spectrum fit
Power-law model

Time interval is from   24.096 sec. to   25.096 sec.

Spectral model in power-law:
------------------------------------------------------------
Parameters  : value       lower 90%   higher 90%
Photon index: 1.16338     ( -0.577085   0.528555 )
Norm@50keV  : 4.41818E-03    ( -0.00132342   0.00131253 )
------------------------------------------------------------
#Fit statistic : Chi-Squared =          66.16 using 59 PHA bins.
# Reduced chi-squared =          1.161 for     57 degrees of freedom
# Null hypothesis probability =   1.900653e-01

Photon flux (15-150 keV)    in 1 sec: 0.516098 ( -0.160381  0.162797 ) ph/cm2/s
Energy fluence (15-150 keV)             : 4.53002e-08 ( -1.41784e-08  1.44294e-08 ) ergs/cm2
Cutoff power-law model

Time interval is from   24.096 sec. to   25.096 sec.
Spectral model in the cutoff power-law:
------------------------------------------------------------
Parameters  : value       lower 90%   higher 90%
Photon index: 0.530083     ( -8.64316   7.37686 )
Epeak [keV] : 122.852      ( -122.768 -122.768 )
Norm@50keV  : 8.86316E-03    ( -0.00887209   38.6465 )
------------------------------------------------------------
#Fit statistic : Chi-Squared =          66.05 using 59 PHA bins.
# Reduced chi-squared =          1.179 for     56 degrees of freedom
# Null hypothesis probability =   1.685527e-01

Photon flux (15-150 keV)    in 1 sec: 0.500255 ( -0.207998  0.17449 ) ph/cm2/s
Energy fluence (15-150 keV)             : 4.31361e-08 ( -1.89485e-08  1.62391e-08 ) ergs/cm2
Band function

Time interval is from   24.096 sec. to   25.096 sec.

Spectral model in the Band function:
------------------------------------------------------------
Parameters  : value       lower 90%   higher 90%
alpha       : 0.505867   ( 0.0910513   0.0910513 )
beta        : -1.86986    ( 1.62965   0.972762 )
Epeak [keV] : 76.5099      ( -76.3016 240.122 )
Norm@50keV   : 2.77164E-02    ( -0.0278759   16.0961 )
------------------------------------------------------------
#Fit statistic : Chi-Squared =          65.53 using 59 PHA bins.
# Reduced chi-squared =          1.191 for     55 degrees of freedom
# Null hypothesis probability =   1.564958e-01

Photon flux (15-150 keV)    in 1 sec:  (    ) ph/cm2/s
Energy fluence (15-150 keV)             : 0 ( 0  0 ) ergs/cm2
Single BB

Spectral model blackbody:
------------------------------------------------------------
Parameters  : value    Lower 90%  Upper 90%
kT [keV]    : 17.6493  (-4.82662  8.78835)
R^2/D10^2   : 3.64944E-02  (-0.0364937   0.0726985)
(R is the radius in km and D10 is the distance to the source in units of 10 kpc)
------------------------------------------------------------
#Fit statistic : Chi-Squared =          66.53 using 59 PHA bins.
# Reduced chi-squared =          1.167 for     57 degrees of freedom
# Null hypothesis probability =   1.816584e-01

Energy  Fluence     90% Error
[keV]   [erg/cm2]   [erg/cm2]
15- 25  2.290e-09   1.454e-09
25- 50  1.044e-08   6.201e-09
50-150  2.347e-08   1.598e-08
15-150  3.619e-08   2.214e-08
Thermal bremsstrahlung (OTTB)

Spectral model: thermal bremsstrahlung
------------------------------------------------------------
Parameters  : value         Lower 90%    Upper 90%
kT [keV]    : 199.363       (-106.734      -199.363)
Norm        : 2.18385       (-0.65887     0.65887)
------------------------------------------------------------
#Fit statistic : Chi-Squared =          67.58 using 59 PHA bins.
# Reduced chi-squared =          1.186 for     57 degrees of freedom
# Null hypothesis probability =   1.593932e-01

Energy  Fluence     90% Error
[keV]   [erg/cm2]   [erg/cm2]
15- 25  5.438e-09   3.369e-09
25- 50  1.046e-08   6.420e-09
50-150  2.294e-08   1.414e-08
15-150  3.884e-08   2.344e-08
Double BB

------------------------------------------------------------
#Fit statistic : Chi-Squared =          66.26 using 59 PHA bins.
#Fit statistic : Chi-Squared =          64.82 using 59 PHA bins.
#Fit statistic : Chi-Squared =          64.64 using 59 PHA bins.
#Fit statistic : Chi-Squared =          64.53 using 59 PHA bins.
# Reduced chi-squared =          1.205 for     55 degrees of freedom
# Reduced chi-squared =          1.179 for     55 degrees of freedom
# Reduced chi-squared =          1.175 for     55 degrees of freedom
# Reduced chi-squared =          1.173 for     55 degrees of freedom
# Null hypothesis probability =   1.421082e-01
# Null hypothesis probability =   1.713575e-01
# Null hypothesis probability =   1.753614e-01
# Null hypothesis probability =   1.777370e-01

Energy  Fluence     90% Error
[keV]   [erg/cm2]   [erg/cm2]
15- 25  3.346e-09   1.825e-09
25- 50  9.952e-09   5.995e-09
50-150  2.439e-08   1.576e-08
15-150  3.769e-08   2.223e-08
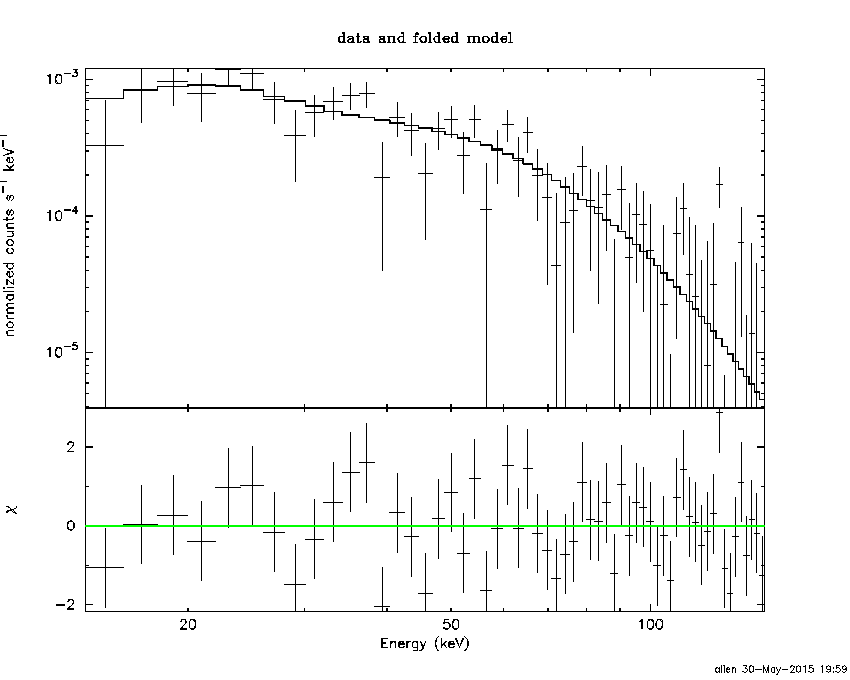
Pre-slew spectrum (Pre-slew PHA with pre-slew DRM)
Power-law model
Spectral model in power-law:
------------------------------------------------------------
Parameters  : value       lower 90%   higher 90%
Photon index: 1.57166     ( -0.182645   0.184875 )
Norm@50keV  : 2.19649E-03    ( -0.000246774   0.00024529 )
------------------------------------------------------------
#Fit statistic : Chi-Squared =          64.13 using 59 PHA bins.
# Reduced chi-squared =          1.125 for     57 degrees of freedom
# Null hypothesis probability =   2.408850e-01

Photon flux (15-150 keV)    in 29.87 sec: 0.279837 ( -0.0307238  0.0307924 ) ph/cm2/s
Energy fluence (15-150 keV)             : 6.15833e-07 ( -7.40471e-08  7.50194e-08 ) ergs/cm2
Cutoff power-law model

Spectral model in the cutoff power-law:
------------------------------------------------------------
Parameters  : value       lower 90%   higher 90%
Photon index: 0.313765     ( -1.05251   0.841526 )
Epeak [keV] : 63.2855      ( -11.9922 35.8908 )
Norm@50keV  : 9.96298E-03    ( -0.00626168   0.0248162 )
------------------------------------------------------------
#Fit statistic : Chi-Squared =          56.99 using 59 PHA bins.
# Reduced chi-squared =          1.018 for     56 degrees of freedom
# Null hypothesis probability =   4.379510e-01

Photon flux (15-150 keV)    in 29.87 sec: 0.263654 ( -0.032336  0.032451 ) ph/cm2/s
Energy fluence (15-150 keV)             : 5.52831e-07 ( -8.05086e-08  8.43559e-08 ) ergs/cm2
Band function
Spectral model in the Band function:
------------------------------------------------------------
Parameters  : value       lower 90%   higher 90%
alpha       : -0.313642   ( -0.661396   1.14057 )
beta        : -10.0000    ( 10   20 )
Epeak [keV] : 63.2727      ( -11.0067 35.8849 )
Norm@50keV   : 9.96515E-03    ( -0.00626419   0.0248946 )
------------------------------------------------------------
#Fit statistic : Chi-Squared =          56.99 using 59 PHA bins.
# Reduced chi-squared =          1.036 for     55 degrees of freedom
# Null hypothesis probability =   4.008561e-01

Photon flux (15-150 keV)    in 29.87 sec: 0.266353 (    ) ph/cm2/s
Energy fluence (15-150 keV)             : 5.53443e-07 ( 0  0 ) ergs/cm2
S(25-50 keV) vs. S(50-100 keV) plot

S(25-50 keV)  = 1.58e-07
S(50-100 keV) = 2.12e-07
T90 vs. Hardness ratio plot

T90                                   = 24.9759999513626 sec.
Hardness ratio (energy fluence ratio) = 1.34177
Color vs. Color plot

Count Ratio  (25-50 keV) / (15-25 keV) = 1.31047
Count Ratio (50-100 keV) / (15-25 keV) = 0.969782
Mask shadow pattern
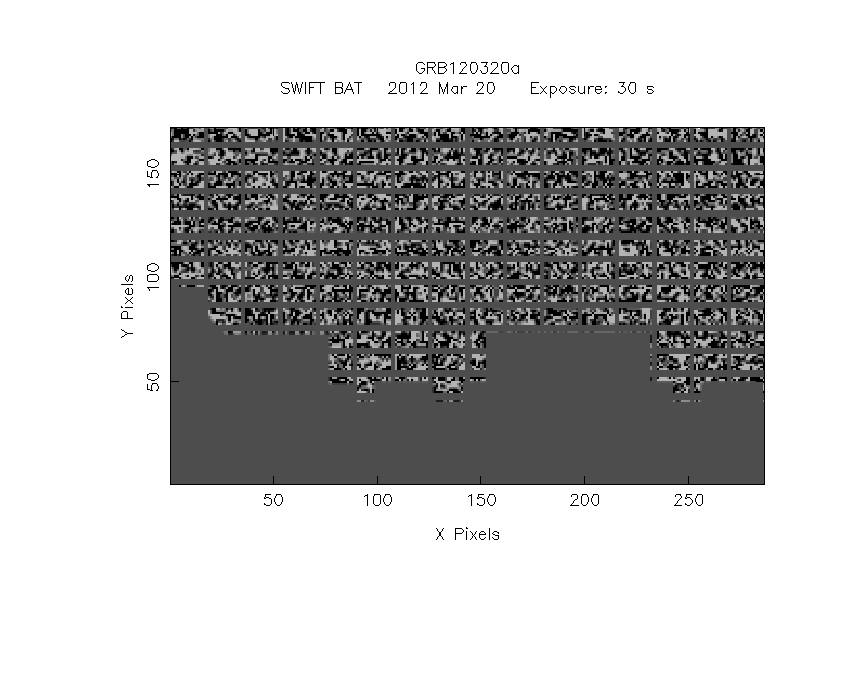
IMX = -2.053962601929236E-01, IMY = -3.880213364858037E-01
TIME vs. PHA plot around the trigger time

Blue+Cyan dotted lines: Time interval of the scaled map
From 0.000000 to 26.880000
TIME vs. DetID plot around the trigger time

Blue+Cyan dotted lines: Time interval of the scaled map
From 0.000000 to 26.880000
100 us light curve (15-350 keV)

Blue+Cyan dotted lines: Time interval of the scaled map
From 0.000000 to 26.880000
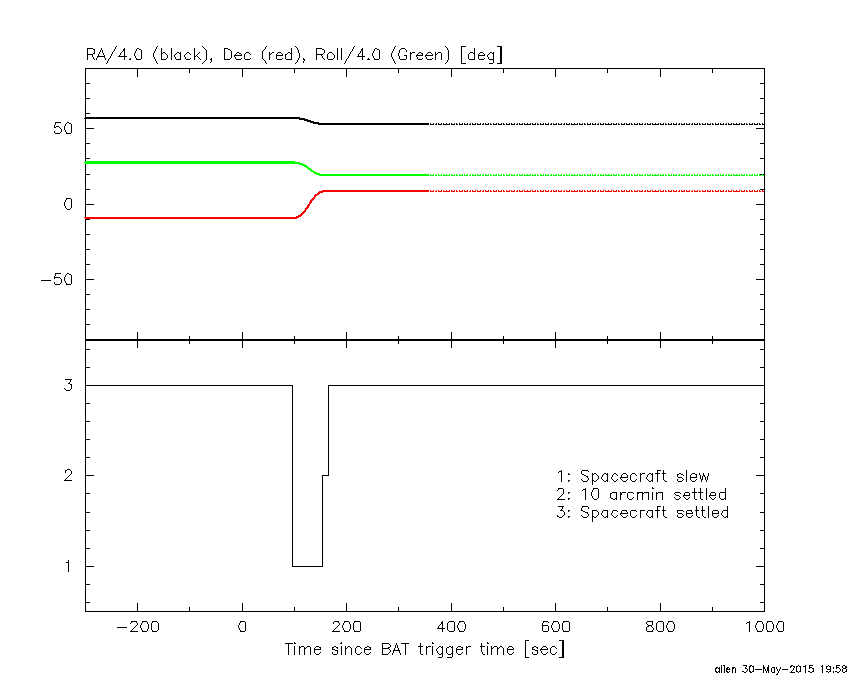
Spacecraft aspect plot
Bright source in the pre-burst/pre-slew/post-slew images
Pre-burst image of 15-350 keV band
Time interval of the image:
-239.616000 -0.016000

# RAcent  DECcent POSerr Theta    Phi  PeakCts   SNR AngSep     Name
#  [deg]    [deg]    ['] [deg]  [deg]                   [']
244.9728 -15.6387    0.2  17.6  -86.9  17.6455  69.0    0.4	Sco X-1
254.4611  35.3767    4.9  50.9 -172.7   1.4637   2.4    2.1	Her X-1
256.0729 -37.9751    7.4  38.2  -56.9   0.7358   1.6    8.9	4U 1700-377
256.5297 -36.3130    6.8  37.4  -59.3   0.8297   1.7    8.0	GX 349+2
262.8184 -24.8450    0.0  36.5  -80.4   0.8863   1.6   12.0	GX 1+4
268.3585  -1.5706    4.9  40.6 -118.7   1.4202   2.3    7.1	SW J1753.5-0127
262.8927 -33.7747   10.6  40.3  -67.4  -0.7150  -1.1    6.0	GX 354-0
197.0102  18.2257    4.2  41.2  111.3   2.5349   2.7 ------	UNKNOWN
217.0223 -47.6052    2.5  39.6   -8.5   1.4571   4.6 ------	UNKNOWN
266.3770  31.8104    2.7  54.8 -160.4   3.0835   4.2 ------	UNKNOWN
269.8885  30.8267    3.0  56.5 -157.1   3.8119   3.8 ------	UNKNOWN
Pre-slew background subtracted image of 15-350 keV band
Time interval of the image:
-0.016000 29.856000

# RAcent  DECcent POSerr Theta    Phi  PeakCts   SNR AngSep     Name
#  [deg]    [deg]    ['] [deg]  [deg]                   [']
245.1360 -15.5360    4.3  17.7  -87.4   0.1747   2.7   11.0	Sco X-1
254.4214  35.4891    8.3  51.0 -172.8   0.2042   1.4    9.0	Her X-1
255.9988 -37.7160    8.2  38.0  -57.1  -0.1615  -1.4    7.7	4U 1700-377
256.5541 -36.2997  112.9  37.4  -59.3   0.0116   0.1    9.4	GX 349+2
263.1903 -24.6862    6.1  36.7  -80.9  -0.2492  -1.9   10.5	GX 1+4
268.3156  -1.4148   56.6  40.6 -118.9   0.0317   0.2    3.9	SW J1753.5-0127
263.1368 -33.9566    0.0  40.5  -67.3  -0.5541  -3.2   10.4	GX 354-0
212.5166   8.6816    0.7  23.7  117.9   1.1165  15.4 ------	UNKNOWN
201.0140 -54.3044    2.3  50.1    0.0   0.6867   5.1 ------	UNKNOWN
210.0382 -54.8055    2.6  47.9   -6.3   0.4909   4.4 ------	UNKNOWN
222.0925 -56.4712    2.3  47.6  -15.8   0.5673   5.0 ------	UNKNOWN
254.4001 -54.3792    2.4  49.8  -40.0   0.9586   4.7 ------	UNKNOWN
Post-slew image of 15-350 keV band
Time interval of the image:
154.684590 962.510000

# RAcent  DECcent POSerr Theta    Phi  PeakCts   SNR AngSep     Name
#  [deg]    [deg]    ['] [deg]  [deg]                   [']
244.9754 -15.6332    0.3  40.3  -39.2  37.1548  42.1    0.5	Sco X-1
207.6997  13.1204    3.1   6.5  147.2   1.6755   3.8 ------	UNKNOWN
224.5604 -41.5813    2.4  51.5    2.4   5.9154   4.9 ------	UNKNOWN
211.1101  59.3227    3.5  50.7 -167.1   4.2325   3.3 ------	UNKNOWN
Plot creation:
Sat May 30 20:00:09 EDT 2015