Special notes of this burst
Image
Pre-slew 15.0-350.0 keV image (Event data)

#   RAcent    DECcent   POSerr    Theta     Phi              Peak Cts       SNR   Name
  273.9026    69.2481   0.0049    15.3125  -119.7098         4.4756009     39.376 TRIG_00518626

Foreground time interval of the image:
-68.984  10.989 (delta_t =  79.973 [sec])
Background time interval of the image:
-239.312 -68.984 (delta_t = 170.328 [sec])
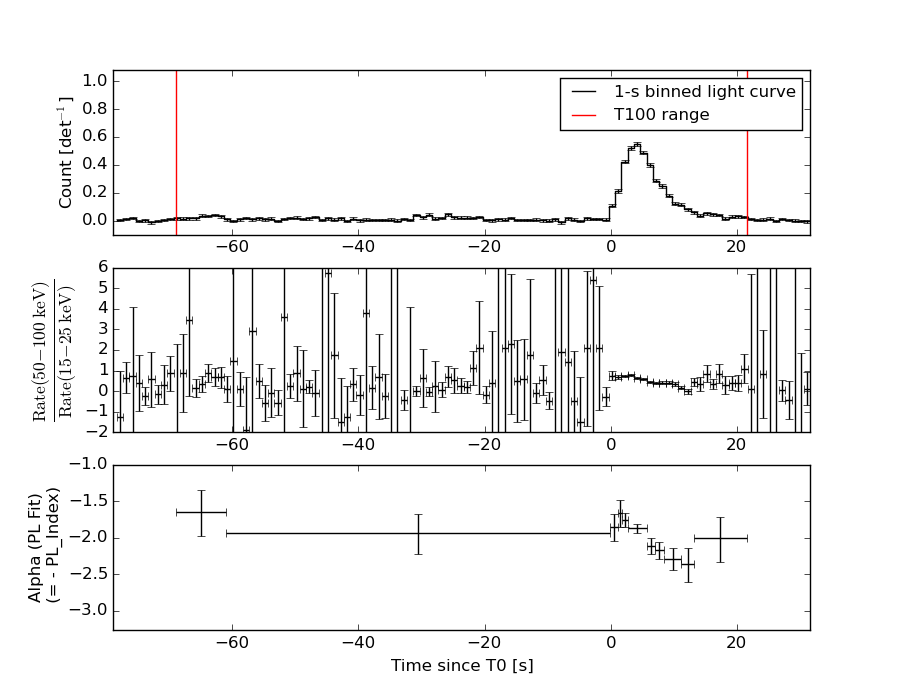
Lightcurves
Notes:
- 1) The mask-weighted light curves are using the flight position.
- 2) Multiple plots of different time binning/intervals are shown to cover all scenarios of short/long GRBs, rate/image triggers, and real/false positives.
- 3) For all the mask-weighted lightcurves, the y-axis units are counts/sec/det where a det is 0.4 x 0.4 = 0.16 sq cm.
- 4) The verticle lines correspond to following: green dotted lines are T50 interval, black dotted lines are T90 interval, blue solid line(s) is a spacecraft slew start time, and orange solid line(s) is a spacecraft slew end time.
- 5) Time of each bin is in the middle of the bin.
1 s binning
From T0-310 s to T0+310 s
From T100_start - 20 s to T100_end + 30 s

Full time interval
64 ms binning
Full time interval
From T100_start to T100_end

From T0-5 sec to T0+5 sec
16 ms binning
From T100_start-5 s to T100_start+5 s

Blue+Cyan dotted lines: Time interval of the scaled map
From 0.000000 to 0.512000
8 ms binning
From T100_start-3 s to T100_start+3 s

Blue+Cyan dotted lines: Time interval of the scaled map
From 0.000000 to 0.512000
2 ms binning
From T100_start-1 s to T100_start+1 s
Blue+Cyan dotted lines: Time interval of the scaled map
From 0.000000 to 0.512000
SN=5 or 10 sec. binning (whichever binning is satisfied first)
SN=5 or 10 sec. binning (T < 200 sec)
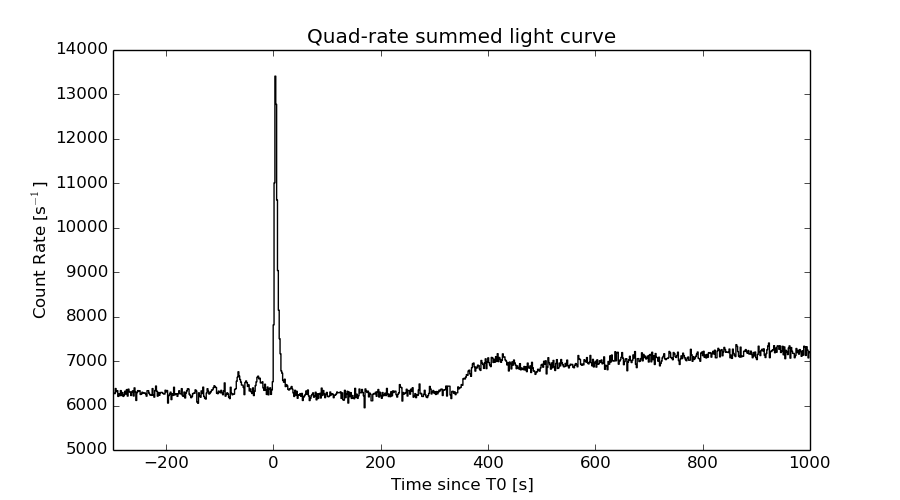
Quad-rate summed light curves (from T0-300s to T0+1000s)
Spectral Evolution
Spectra
Notes:
- 1) The fitting includes the systematic errors.
- 2) When the burst includes telescope slew time periods, the fitting uses an average response file made from multiple 5-s response files through out the slew time plus single time preiod for the non-slew times, and weighted by the total counts in the corresponding time period using addrmf. An average response file is needed becuase a spectral fit using the pre-slew DRM will introduce some errors in both a spectral shape and a normalization if the PHA file contains a lot of the slew/post-slew time interval.
- 3) For fits to more complicated models (e.g. a power-law over a cutoff power-law), the BAT team has decided to require a chi-square improvement of more than 6 for each extra dof.
Time averaged spectrum fit using the average DRM
Power-law model

Time interval is from  -68.984 sec. to   21.592 sec.

Spectral model in power-law:
------------------------------------------------------------
Parameters  : value       lower 90%   higher 90%
Photon index: 1.98561     ( -0.0697645   0.070626 )
Norm@50keV  : 3.19970E-03    ( -0.000125535   0.000124808 )
------------------------------------------------------------
#Fit statistic : Chi-Squared =          62.18 using 59 PHA bins.
# Reduced chi-squared =          1.091 for     57 degrees of freedom
# Null hypothesis probability =   2.970657e-01

Photon flux (15-150 keV)    in 90.58 sec: 0.476807 ( -0.0177482  0.0178074 ) ph/cm2/s
Energy fluence (15-150 keV)             : 2.67086e-06 ( -1.0052e-07  1.00954e-07 ) ergs/cm2
Cutoff power-law model

Time interval is from  -68.984 sec. to   21.592 sec.
Spectral model in the cutoff power-law:
------------------------------------------------------------
Parameters  : value       lower 90%   higher 90%
Photon index: 1.39955     ( -0.32662   0.30226 )
Epeak [keV] : 46.8378      ( -6.55892 7.89511 )
Norm@50keV  : 6.52742E-03    ( -0.00197347   0.00314675 )
------------------------------------------------------------
#Fit statistic : Chi-Squared =          50.46 using 59 PHA bins.
# Reduced chi-squared =         0.9011 for     56 degrees of freedom
# Null hypothesis probability =   6.837655e-01

Photon flux (15-150 keV)    in 90.58 sec: 0.456676 ( -0.02016  0.02026 ) ph/cm2/s
Energy fluence (15-150 keV)             : 2.51775e-06 ( -1.24267e-07  1.25317e-07 ) ergs/cm2
Band function

Time interval is from  -68.984 sec. to   21.592 sec.

Spectral model in the Band function:
------------------------------------------------------------
Parameters  : value       lower 90%   higher 90%
alpha       : -1.11451   ( -0.51673   1.28177 )
beta        : -2.33312    ( 2.33406   0.241043 )
Epeak [keV] : 42.2125      ( -9.47458 10.1563 )
Norm@50keV   : 9.80060E-03    ( -0.00437617   0.0656097 )
------------------------------------------------------------
#Fit statistic : Chi-Squared =          49.36 using 59 PHA bins.
# Reduced chi-squared =         0.8975 for     55 degrees of freedom
# Null hypothesis probability =   6.889269e-01

Photon flux (15-150 keV)    in 90.58 sec: 0.454146 ( 6.54585  -0.020517 ) ph/cm2/s
Energy fluence (15-150 keV)             : 2.53109e-06 ( -2.53045e-06  -1.20009e-07 ) ergs/cm2
Single BB

Spectral model blackbody:
------------------------------------------------------------
Parameters  : value    Lower 90%  Upper 90%
kT [keV]    : 11.2195  (  )
R^2/D10^2   : 0.134929  (   )
(R is the radius in km and D10 is the distance to the source in units of 10 kpc)
------------------------------------------------------------
#Fit statistic : Chi-Squared =         175.02 using 59 PHA bins.
# Reduced chi-squared =         3.0705 for     57 degrees of freedom
# Null hypothesis probability =   6.360007e-14

Energy  Fluence     90% Error
[keV]   [erg/cm2]   [erg/cm2]
15- 25  3.226e-07   2.265e-08
25- 50  9.355e-07   3.569e-08
50-150  6.752e-07   5.842e-08
15-150  1.933e-06   7.337e-08
Thermal bremsstrahlung (OTTB)
Spectral model: thermal bremsstrahlung
------------------------------------------------------------
Parameters  : value         Lower 90%    Upper 90%
kT [keV]    : 73.8697       (-8.23809      9.94465)
Norm        : 2.24153       (-0.137569     0.149264)
------------------------------------------------------------
#Fit statistic : Chi-Squared =          50.57 using 59 PHA bins.
# Reduced chi-squared =         0.8871 for     57 degrees of freedom
# Null hypothesis probability =   7.135843e-01

Energy  Fluence     90% Error
[keV]   [erg/cm2]   [erg/cm2]
15- 25  5.237e-07   2.722e-08
25- 50  8.450e-07   2.849e-08
50-150  1.129e-06   8.922e-08
15-150  2.497e-06   1.051e-07
Double BB
Spectral model: bbodyrad<1> + bbodyrad<2>
------------------------------------------------------------
Parameters  : value         Lower 90%    Upper 90%
kT1 [keV]   : 6.58713        (-0.903981      0.913715)
R1^2/D10^2  : 0.710655        (-0.248161      0.481728)
kT2 [keV]   : 20.4282        (-2.95308      4.30747)
R2^2/D10^2  : 9.39745E-03    (-0.00507611   0.0088992)
------------------------------------------------------------
#Fit statistic : Chi-Squared =          54.66 using 59 PHA bins.
# Reduced chi-squared =         0.9938 for     55 degrees of freedom
# Null hypothesis probability =   4.877038e-01

Energy  Fluence     90% Error
[keV]   [erg/cm2]   [erg/cm2]
15- 25  4.873e-07   6.386e-08
25- 50  8.520e-07   8.274e-08
50-150  1.131e-06   2.341e-07
15-150  2.470e-06   3.139e-07
Peak spectrum fit
Power-law model
Time interval is from    3.588 sec. to    4.588 sec.

Spectral model in power-law:
------------------------------------------------------------
Parameters  : value       lower 90%   higher 90%
Photon index: 1.85429     ( -0.080727   0.0818493 )
Norm@50keV  : 3.36734E-02    ( -0.00164454   0.00163443 )
------------------------------------------------------------
#Fit statistic : Chi-Squared =          62.26 using 59 PHA bins.
# Reduced chi-squared =          1.092 for     57 degrees of freedom
# Null hypothesis probability =   2.944009e-01

Photon flux (15-150 keV)    in 1 sec: 4.74142 ( -0.217802  0.218136 ) ph/cm2/s
Energy fluence (15-150 keV)             : 3.09604e-07 ( -1.51578e-08  1.52315e-08 ) ergs/cm2
Cutoff power-law model

Time interval is from    3.588 sec. to    4.588 sec.
Spectral model in the cutoff power-law:
------------------------------------------------------------
Parameters  : value       lower 90%   higher 90%
Photon index: 1.23365     ( -0.3961   0.359522 )
Epeak [keV] : 56.4725      ( -7.85908 18.2034 )
Norm@50keV  : 7.25233E-02    ( -0.025607   0.0454762 )
------------------------------------------------------------
#Fit statistic : Chi-Squared =          53.04 using 59 PHA bins.
# Reduced chi-squared =         0.9471 for     56 degrees of freedom
# Null hypothesis probability =   5.877485e-01

Photon flux (15-150 keV)    in 1 sec: 4.58973 ( -0.23346  0.23358 ) ph/cm2/s
Energy fluence (15-150 keV)             : 2.92916e-07 ( -1.7841e-08  1.7909e-08 ) ergs/cm2
Band function
Time interval is from    3.588 sec. to    4.588 sec.

Spectral model in the Band function:
------------------------------------------------------------
Parameters  : value       lower 90%   higher 90%
alpha       : -0.184424   ( -1.04531   1.67263 )
beta        : -2.15055    ( -0.390817   0.181622 )
Epeak [keV] : 39.3359      ( -8.66524 15.5515 )
Norm@50keV   : 0.349492    ( -0.328891   5.24002 )
------------------------------------------------------------
#Fit statistic : Chi-Squared =          48.07 using 59 PHA bins.
# Reduced chi-squared =         0.8739 for     55 degrees of freedom
# Null hypothesis probability =   7.346329e-01

Photon flux (15-150 keV)    in 1 sec:  (    ) ph/cm2/s
Energy fluence (15-150 keV)             : 2.95293e-07 ( -2.95286e-07  -1.6833e-08 ) ergs/cm2
Single BB

Spectral model blackbody:
------------------------------------------------------------
Parameters  : value    Lower 90%  Upper 90%
kT [keV]    : 11.5613  (  )
R^2/D10^2   : 1.27929  (   )
(R is the radius in km and D10 is the distance to the source in units of 10 kpc)
------------------------------------------------------------
#Fit statistic : Chi-Squared =         130.01 using 59 PHA bins.
# Reduced chi-squared =         2.2809 for     57 degrees of freedom
# Null hypothesis probability =   1.249342e-07

Energy  Fluence     90% Error
[keV]   [erg/cm2]   [erg/cm2]
15- 25  3.602e-08   2.970e-09
25- 50  1.084e-07   5.000e-09
50-150  8.493e-08   8.595e-09
15-150  2.294e-07   1.220e-08
Thermal bremsstrahlung (OTTB)

Spectral model: thermal bremsstrahlung
------------------------------------------------------------
Parameters  : value         Lower 90%    Upper 90%
kT [keV]    : 90.8192       (-13.3529      17.3523)
Norm        : 21.3343       (-1.43852     1.57413)
------------------------------------------------------------
#Fit statistic : Chi-Squared =          52.87 using 59 PHA bins.
# Reduced chi-squared =         0.9276 for     57 degrees of freedom
# Null hypothesis probability =   6.305754e-01

Energy  Fluence     90% Error
[keV]   [erg/cm2]   [erg/cm2]
15- 25  5.568e-08   4.355e-09
25- 50  9.436e-08   4.240e-09
50-150  1.445e-07   4.080e-08
15-150  2.945e-07   3.925e-08
Double BB
Spectral model: bbodyrad<1> + bbodyrad<2>
------------------------------------------------------------
Parameters  : value         Lower 90%    Upper 90%
kT1 [keV]   : 8.08735        (-1.1609      1.05171)
R1^2/D10^2  : 3.76696        (-1.18717      2.26704)
kT2 [keV]   : 28.6936        (-7.39681      15.5428)
R2^2/D10^2  : 2.63537E-02    (-0.0198053   0.0555824)
------------------------------------------------------------
#Fit statistic : Chi-Squared =          51.90 using 59 PHA bins.
# Reduced chi-squared =         0.9437 for     55 degrees of freedom
# Null hypothesis probability =   5.937780e-01

Energy  Fluence     90% Error
[keV]   [erg/cm2]   [erg/cm2]
15- 25  4.840e-08   5.405e-09
25- 50  1.012e-07   1.095e-08
50-150  1.465e-07   5.278e-08
15-150  2.962e-07   6.185e-08
Pre-slew spectrum (Pre-slew PHA with pre-slew DRM)
Power-law model

Spectral model in power-law:
------------------------------------------------------------
Parameters  : value       lower 90%   higher 90%
Photon index: 1.95409     ( -0.0707982   0.0716684 )
Norm@50keV  : 3.30863E-03    ( -0.000132706   0.000131952 )
------------------------------------------------------------
#Fit statistic : Chi-Squared =          61.99 using 59 PHA bins.
# Reduced chi-squared =          1.087 for     57 degrees of freedom
# Null hypothesis probability =   3.029146e-01

Photon flux (15-150 keV)    in 79.97 sec: 0.486106 ( -0.0184831  0.0185381 ) ph/cm2/s
Energy fluence (15-150 keV)             : 2.43526e-06 ( -9.47413e-08  9.51851e-08 ) ergs/cm2
Cutoff power-law model

Spectral model in the cutoff power-law:
------------------------------------------------------------
Parameters  : value       lower 90%   higher 90%
Photon index: 1.32980     ( -0.334276   0.308976 )
Epeak [keV] : 49.2022      ( -6.07484 8.58218 )
Norm@50keV  : 7.06764E-03    ( -0.0021758   0.00350343 )
------------------------------------------------------------
#Fit statistic : Chi-Squared =          49.17 using 59 PHA bins.
# Reduced chi-squared =         0.8780 for     56 degrees of freedom
# Null hypothesis probability =   7.290364e-01

Photon flux (15-150 keV)    in 79.97 sec: 0.464928 ( -0.020841  0.020935 ) ph/cm2/s
Energy fluence (15-150 keV)             : 2.28862e-06 ( -1.15901e-07  1.16948e-07 ) ergs/cm2
Band function

Spectral model in the Band function:
------------------------------------------------------------
Parameters  : value       lower 90%   higher 90%
alpha       : -1.02035   ( -0.557988   1.21305 )
beta        : -2.31044    ( 2.31222   0.237398 )
Epeak [keV] : 43.3907      ( -9.56413 12.0407 )
Norm@50keV   : 1.10222E-02    ( -0.00586837   0.0632619 )
------------------------------------------------------------
#Fit statistic : Chi-Squared =          48.17 using 59 PHA bins.
# Reduced chi-squared =         0.8759 for     55 degrees of freedom
# Null hypothesis probability =   7.309009e-01

Photon flux (15-150 keV)    in 79.97 sec: 0.462408 ( 6.53759  -0.021194 ) ph/cm2/s
Energy fluence (15-150 keV)             : 2.30338e-06 ( -2.30282e-06  -1.11606e-07 ) ergs/cm2
S(25-50 keV) vs. S(50-100 keV) plot

S(25-50 keV)  = 8.01e-07
S(50-100 keV) = 8.09e-07
T90 vs. Hardness ratio plot

T90                                   = 69.4799999594688 sec.
Hardness ratio (energy fluence ratio) = 1.00999
Color vs. Color plot

Count Ratio  (25-50 keV) / (15-25 keV) = 1.08938
Count Ratio (50-100 keV) / (15-25 keV) = 0.560942
Mask shadow pattern

IMX = -1.356994435304406E-01, IMY = 2.378115082158468E-01
TIME vs. PHA plot around the trigger time
Blue+Cyan dotted lines: Time interval of the scaled map
From 0.000000 to 0.512000
TIME vs. DetID plot around the trigger time

Blue+Cyan dotted lines: Time interval of the scaled map
From 0.000000 to 0.512000
100 us light curve (15-350 keV)

Blue+Cyan dotted lines: Time interval of the scaled map
From 0.000000 to 0.512000
Spacecraft aspect plot

Bright source in the pre-burst/pre-slew/post-slew images
Pre-burst image of 15-350 keV band
Time interval of the image:
-239.312000 -68.984000

# RAcent  DECcent POSerr Theta    Phi  PeakCts   SNR AngSep     Name
#  [deg]    [deg]    ['] [deg]  [deg]                   [']
254.4553  35.3400  382.6  22.3   21.9   0.0040   0.0    0.2	Her X-1
288.8122  10.9436    2.8  54.8  -18.2   1.8672   4.1    0.8	GRS 1915+105
299.6056  35.2256    2.2  39.0  -47.4   1.2705   5.3    1.6	Cyg X-1
308.0811  41.0057    2.4  39.2  -61.4   1.4859   4.8    3.4	Cyg X-3
246.2489   9.9980    2.5  47.7   35.6   2.1826   4.7 ------	UNKNOWN
148.5366  52.0614    3.4  53.6  160.8   2.4999   3.4 ------	UNKNOWN
193.0777  59.1035    2.6  29.6  147.0   0.7651   4.4 ------	UNKNOWN
104.6735  62.2107    2.8  57.4 -168.8   2.7539   4.2 ------	UNKNOWN
291.5502  55.9962    2.3  21.9  -74.2   0.7666   5.0 ------	UNKNOWN
319.5258  52.9212    3.1  37.6  -84.2   1.4525   3.7 ------	UNKNOWN
 19.6637  69.0950    2.3  48.0 -128.9   2.9132   5.0 ------	UNKNOWN
Pre-slew background subtracted image of 15-350 keV band
Time interval of the image:
-68.984000 10.988590

# RAcent  DECcent POSerr Theta    Phi  PeakCts   SNR AngSep     Name
#  [deg]    [deg]    ['] [deg]  [deg]                   [']
254.5056  35.4389    6.0  22.2   21.8   0.2131   1.9    6.2	Her X-1
288.6898  10.7723   14.9  54.9  -18.0   0.2678   0.8   12.2	GRS 1915+105
299.4284  35.0696   66.4  39.0  -47.0   0.0314   0.2   11.2	Cyg X-1
308.0573  40.9406    3.8  39.3  -61.3   0.7449   3.0    2.5	Cyg X-3
273.9026  69.2481    0.3  15.3 -119.7   4.4755  39.4 ------	UNKNOWN
Post-slew image of 15-350 keV band
Time interval of the image:
48.388600 332.788590

# RAcent  DECcent POSerr Theta    Phi  PeakCts   SNR AngSep     Name
#  [deg]    [deg]    ['] [deg]  [deg]                   [']
254.2715  35.3647    4.8  35.6   30.4  -0.6678  -2.4    9.2	Her X-1
288.7528  10.9315    4.2  59.1  -14.7   2.9814   2.7    2.8	GRS 1915+105
299.6108  35.1874    1.5  36.9  -33.8   2.2537   7.9    1.3	Cyg X-1
308.0602  40.9595    1.4  33.5  -47.9   2.3974   8.3    2.3	Cyg X-3
326.2774  38.3106   13.9  41.5  -67.4   0.6895   0.8    5.0	Cyg X-2
161.0203  57.5847    2.5  44.3  137.4   3.3465   4.5 ------	UNKNOWN
256.3599  27.0794    2.8  43.4   25.3   1.6972   4.2 ------	UNKNOWN
290.8042  43.4501    2.5  27.3  -25.1   0.9504   4.6 ------	UNKNOWN
 10.4969  77.8488    3.3  25.1 -148.1   0.6904   3.5 ------	UNKNOWN
Plot creation:
Sat May 30 19:56:10 EDT 2015