Click here for the BAT GCN circular template
Image
Pre-slew 15.0-350.0 keV image (Event data)
#   RAcent    DECcent   POSerr    Theta     Phi              Peak Cts       SNR   Name
  246.8536   -29.4160   0.0075    17.0697    76.1983         2.1313812     25.527 TRIG_00518731

Foreground time interval of the image:
-15.788  25.829 (delta_t =  41.617 [sec])
Background time interval of the image:
-239.672 -15.788 (delta_t = 223.884 [sec])
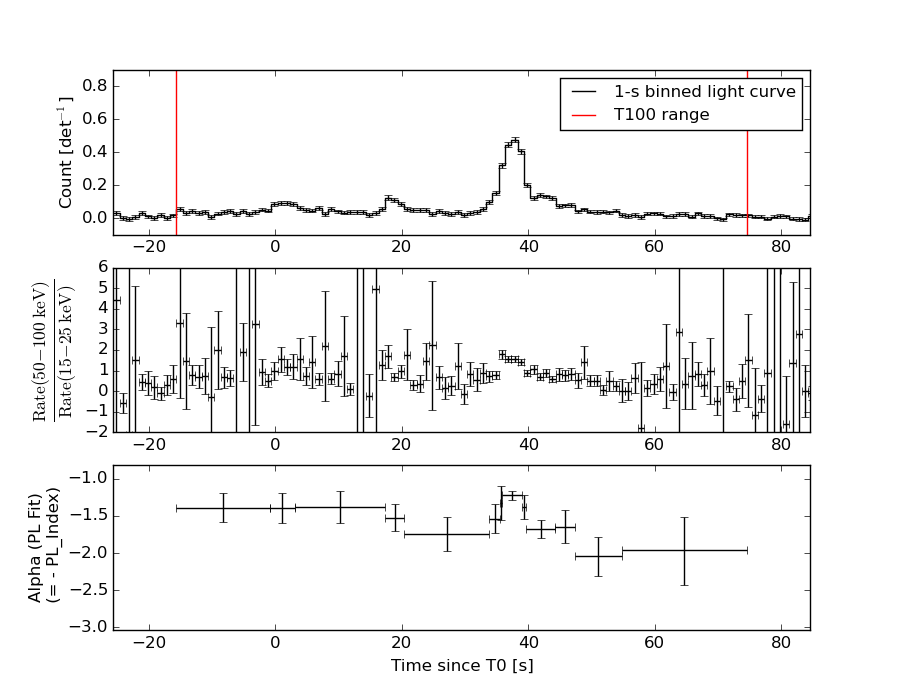
Lightcurves
Notes:
- 1) The mask-weighted light curves are using the flight position.
- 2) Multiple plots of different time binning/intervals are shown to cover all scenarios of short/long GRBs, rate/image triggers, and real/false positives.
- 3) For all the mask-weighted lightcurves, the y-axis units are counts/sec/det where a det is 0.4 x 0.4 = 0.16 sq cm.
- 4) The verticle lines correspond to following: green dotted lines are T50 interval, black dotted lines are T90 interval, blue solid line(s) is a spacecraft slew start time, and orange solid line(s) is a spacecraft slew end time.
- 5) Time of each bin is in the middle of the bin.
1 s binning
From T0-310 s to T0+310 s
From T100_start - 20 s to T100_end + 30 s
Full time interval
64 ms binning
Full time interval
From T100_start to T100_end

From T0-5 sec to T0+5 sec
16 ms binning
From T100_start-5 s to T100_start+5 s
Blue+Cyan dotted lines: Time interval of the scaled map
From 0.000000 to 2.048000
8 ms binning
From T100_start-3 s to T100_start+3 s
Blue+Cyan dotted lines: Time interval of the scaled map
From 0.000000 to 2.048000
2 ms binning
From T100_start-1 s to T100_start+1 s
Blue+Cyan dotted lines: Time interval of the scaled map
From 0.000000 to 2.048000
SN=5 or 10 sec. binning (whichever binning is satisfied first)
SN=5 or 10 sec. binning (T < 200 sec)
Quad-rate summed light curves (from T0-300s to T0+1000s)
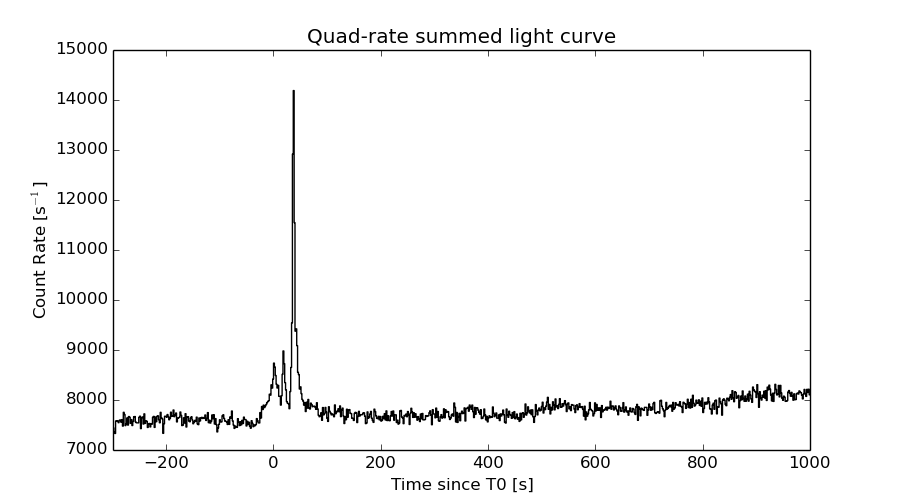
The mask-weighted light curves based on cleaned DPHs

Spectral Evolution
Spectra
Notes:
- 1) The fitting includes the systematic errors.
- 2) When the burst includes telescope slew time periods, the fitting uses an average response file made from multiple 5-s response files through out the slew time plus single time preiod for the non-slew times, and weighted by the total counts in the corresponding time period using addrmf. An average response file is needed becuase a spectral fit using the pre-slew DRM will introduce some errors in both a spectral shape and a normalization if the PHA file contains a lot of the slew/post-slew time interval.
- 3) For fits to more complicated models (e.g. a power-law over a cutoff power-law), the BAT team has decided to require a chi-square improvement of more than 6 for each extra dof.
Time averaged spectrum fit using the average DRM
Power-law model
Time interval is from  -15.788 sec. to   74.576 sec.

Spectral model in power-law:
------------------------------------------------------------
Parameters  : value       lower 90%   higher 90%
Photon index: 1.51715     ( -0.0613644   0.061371 )
Norm@50keV  : 4.17984E-03    ( -0.000133985   0.000133933 )
------------------------------------------------------------
#Fit statistic : Chi-Squared =          53.58 using 59 PHA bins.
# Reduced chi-squared =         0.9400 for     57 degrees of freedom
# Null hypothesis probability =   6.042110e-01

Photon flux (15-150 keV)    in 90.36 sec: 0.524252 ( -0.0182963  0.0183539 ) ph/cm2/s
Energy fluence (15-150 keV)             : 3.57313e-06 ( -1.22116e-07  1.22405e-07 ) ergs/cm2
Cutoff power-law model

Time interval is from  -15.788 sec. to   74.576 sec.
Spectral model in the cutoff power-law:
------------------------------------------------------------
Parameters  : value       lower 90%   higher 90%
Photon index: 1.36060     ( -0.239044   0.188044 )
Epeak [keV] : 217.662      ( -129.753 -217.662 )
Norm@50keV  : 4.95262E-03    ( -0.000853265   0.00141561 )
------------------------------------------------------------
#Fit statistic : Chi-Squared =          52.20 using 59 PHA bins.
# Reduced chi-squared =         0.9322 for     56 degrees of freedom
# Null hypothesis probability =   6.193591e-01

Photon flux (15-150 keV)    in 90.36 sec: 0.518196 ( -0.020123  0.02018 ) ph/cm2/s
Energy fluence (15-150 keV)             : 3.53166e-06 ( -1.37537e-07  1.36941e-07 ) ergs/cm2
Band function

Time interval is from  -15.788 sec. to   74.576 sec.

Spectral model in the Band function:
------------------------------------------------------------
Parameters  : value       lower 90%   higher 90%
alpha       : 1.65054   ( -4.52172   -2.42354 )
beta        : -1.56573    ( -0.0760148   0.0684778 )
Epeak [keV] : 29.6630      ( -6.05543 3.84829 )
Norm@50keV   : 0.849811    ( -0.847437   149.824 )
------------------------------------------------------------
#Fit statistic : Chi-Squared =          49.18 using 59 PHA bins.
# Reduced chi-squared =         0.8942 for     55 degrees of freedom
# Null hypothesis probability =   6.955720e-01

Photon flux (15-150 keV)    in 90.36 sec: 0.510890 ( 6.48911  -0.021388 ) ph/cm2/s
Energy fluence (15-150 keV)             : 0 ( 0  0 ) ergs/cm2
Single BB
Spectral model blackbody:
------------------------------------------------------------
Parameters  : value    Lower 90%  Upper 90%
kT [keV]    : 16.2474  (  )
R^2/D10^2   : 4.27765E-02  (   )
(R is the radius in km and D10 is the distance to the source in units of 10 kpc)
------------------------------------------------------------
#Fit statistic : Chi-Squared =         265.83 using 59 PHA bins.
# Reduced chi-squared =         4.6637 for     57 degrees of freedom
# Null hypothesis probability =   1.034131e-28

Energy  Fluence     90% Error
[keV]   [erg/cm2]   [erg/cm2]
15- 25  2.102e-07   1.446e-08
25- 50  8.962e-07   3.917e-08
50-150  1.663e-06   9.578e-08
15-150  2.770e-06   1.008e-07
Thermal bremsstrahlung (OTTB)

Spectral model: thermal bremsstrahlung
------------------------------------------------------------
Parameters  : value         Lower 90%    Upper 90%
kT [keV]    : 200.000       (      )
Norm        : 2.13768       (-0.0682918     0.0682911)
------------------------------------------------------------
#Fit statistic : Chi-Squared =          55.95 using 59 PHA bins.
# Reduced chi-squared =         0.9816 for     57 degrees of freedom
# Null hypothesis probability =   5.144232e-01

Energy  Fluence     90% Error
[keV]   [erg/cm2]   [erg/cm2]
15- 25  4.811e-07   1.861e-08
25- 50  9.255e-07   3.257e-08
50-150  2.030e-06   7.274e-08
15-150  3.436e-06   1.288e-07
Double BB
Spectral model: bbodyrad<1> + bbodyrad<2>
------------------------------------------------------------
Parameters  : value         Lower 90%    Upper 90%
kT1 [keV]   : 7.15580        (-0.759552      0.832865)
R1^2/D10^2  : 0.504148        (-0.159496      0.251276)
kT2 [keV]   : 27.8613        (-2.86864      3.84984)
R2^2/D10^2  : 5.35985E-03    (-0.00194303   0.00256601)
------------------------------------------------------------
#Fit statistic : Chi-Squared =          49.30 using 59 PHA bins.
# Reduced chi-squared =         0.8964 for     55 degrees of freedom
# Null hypothesis probability =   6.911784e-01

Energy  Fluence     90% Error
[keV]   [erg/cm2]   [erg/cm2]
15- 25  4.447e-07   5.657e-08
25- 50  9.148e-07   7.441e-08
50-150  2.164e-06   2.164e-07
15-150  3.523e-06   2.702e-07
Peak spectrum fit
Power-law model
Time interval is from   37.156 sec. to   38.156 sec.

Spectral model in power-law:
------------------------------------------------------------
Parameters  : value       lower 90%   higher 90%
Photon index: 1.25088     ( -0.0916066   0.0914288 )
Norm@50keV  : 3.27912E-02    ( -0.00167073   0.00167073 )
------------------------------------------------------------
#Fit statistic : Chi-Squared =          59.57 using 59 PHA bins.
# Reduced chi-squared =          1.045 for     57 degrees of freedom
# Null hypothesis probability =   3.823442e-01

Photon flux (15-150 keV)    in 1 sec: 3.87887 ( -0.205727  0.206028 ) ph/cm2/s
Energy fluence (15-150 keV)             : 3.28097e-07 ( -1.84533e-08  1.85136e-08 ) ergs/cm2
Cutoff power-law model
Time interval is from   37.156 sec. to   38.156 sec.
Spectral model in the cutoff power-law:
------------------------------------------------------------
Parameters  : value       lower 90%   higher 90%
Photon index: 1.09021     ( -0.360428   0.205257 )
Epeak [keV] : 316.457      ( -316.454 -316.454 )
Norm@50keV  : 3.88546E-02    ( -0.00735973   0.017306 )
------------------------------------------------------------
#Fit statistic : Chi-Squared =          58.91 using 59 PHA bins.
# Reduced chi-squared =          1.052 for     56 degrees of freedom
# Null hypothesis probability =   3.694034e-01

Photon flux (15-150 keV)    in 1 sec: 3.84804 ( -0.21507  0.21516 ) ph/cm2/s
Energy fluence (15-150 keV)             : 3.25542e-07 ( -1.951e-08  1.9396e-08 ) ergs/cm2
Band function
Time interval is from   37.156 sec. to   38.156 sec.

Spectral model in the Band function:
------------------------------------------------------------
Parameters  : value       lower 90%   higher 90%
alpha       : -1.09659   ( 0.76673   0.76673 )
beta        : -1.56318    ( 2.4311   1.25975 )
Epeak [keV] : 335.771      ( -335.744 -335.744 )
Norm@50keV   : 3.84721E-02    ( -0.00112396   0.00195721 )
------------------------------------------------------------
#Fit statistic : Chi-Squared =          58.92 using 59 PHA bins.
# Reduced chi-squared =          1.071 for     55 degrees of freedom
# Null hypothesis probability =   3.340373e-01

Photon flux (15-150 keV)    in 1 sec:  (    ) ph/cm2/s
Energy fluence (15-150 keV)             : 0 ( 0  0 ) ergs/cm2
Single BB
Spectral model blackbody:
------------------------------------------------------------
Parameters  : value    Lower 90%  Upper 90%
kT [keV]    : 19.1906  (  )
R^2/D10^2   : 0.200190  (   )
(R is the radius in km and D10 is the distance to the source in units of 10 kpc)
------------------------------------------------------------
#Fit statistic : Chi-Squared =         138.00 using 59 PHA bins.
# Reduced chi-squared =         2.4210 for     57 degrees of freedom
# Null hypothesis probability =   1.143714e-08

Energy  Fluence     90% Error
[keV]   [erg/cm2]   [erg/cm2]
15- 25  1.444e-08   1.585e-09
25- 50  6.993e-08   5.085e-09
50-150  1.897e-07   1.740e-08
15-150  2.740e-07   1.725e-08
Thermal bremsstrahlung (OTTB)
Spectral model: thermal bremsstrahlung
------------------------------------------------------------
Parameters  : value         Lower 90%    Upper 90%
kT [keV]    : 200.000       (      )
Norm        : 16.1381       (-0.8353     0.835151)
------------------------------------------------------------
#Fit statistic : Chi-Squared =          91.13 using 59 PHA bins.
# Reduced chi-squared =          1.599 for     57 degrees of freedom
# Null hypothesis probability =   2.740157e-03

Energy  Fluence     90% Error
[keV]   [erg/cm2]   [erg/cm2]
15- 25  4.019e-08   2.285e-09
25- 50  7.732e-08   4.840e-09
50-150  1.696e-07   1.325e-08
15-150  2.871e-07   2.990e-08
Double BB
Spectral model: bbodyrad<1> + bbodyrad<2>
------------------------------------------------------------
Parameters  : value         Lower 90%    Upper 90%
kT1 [keV]   : 6.71484        (-1.22831      1.56121)
R1^2/D10^2  : 3.76197        (-1.88983      4.14622)
kT2 [keV]   : 28.5783        (-3.62567      5.55122)
R2^2/D10^2  : 4.68679E-02    (-0.021135   0.0278456)
------------------------------------------------------------
#Fit statistic : Chi-Squared =          59.17 using 59 PHA bins.
# Reduced chi-squared =          1.076 for     55 degrees of freedom
# Null hypothesis probability =   3.260665e-01

Energy  Fluence     90% Error
[keV]   [erg/cm2]   [erg/cm2]
15- 25  3.221e-08   8.720e-09
25- 50  7.013e-08   1.072e-08
50-150  2.234e-07   3.455e-08
15-150  3.258e-07   4.495e-08
Pre-slew spectrum (Pre-slew PHA with pre-slew DRM)
Power-law model
Spectral model in power-law:
------------------------------------------------------------
Parameters  : value       lower 90%   higher 90%
Photon index: 1.44080     ( -0.104543   0.104384 )
Norm@50keV  : 3.32867E-03    ( -0.000191804   0.000191572 )
------------------------------------------------------------
#Fit statistic : Chi-Squared =          51.11 using 59 PHA bins.
# Reduced chi-squared =         0.8967 for     57 degrees of freedom
# Null hypothesis probability =   6.945870e-01

Photon flux (15-150 keV)    in 41.62 sec: 0.409286 ( -0.024653  0.0247178 ) ph/cm2/s
Energy fluence (15-150 keV)             : 1.32799e-06 ( -8.32229e-08  8.36391e-08 ) ergs/cm2
Cutoff power-law model
Spectral model in the cutoff power-law:
------------------------------------------------------------
Parameters  : value       lower 90%   higher 90%
Photon index: 1.09292     ( -0.435451   0.383816 )
Epeak [keV] : 135.818      ( -48.7483 -135.818 )
Norm@50keV  : 4.90339E-03    ( -0.00164438   0.00294117 )
------------------------------------------------------------
#Fit statistic : Chi-Squared =          48.85 using 59 PHA bins.
# Reduced chi-squared =         0.8724 for     56 degrees of freedom
# Null hypothesis probability =   7.398046e-01

Photon flux (15-150 keV)    in 41.62 sec: 0.400935 ( -0.026353  0.026371 ) ph/cm2/s
Energy fluence (15-150 keV)             : 1.29342e-06 ( -9.30498e-08  9.26753e-08 ) ergs/cm2
Band function

Spectral model in the Band function:
------------------------------------------------------------
Parameters  : value       lower 90%   higher 90%
alpha       : -1.09285   ( -0.2851   0.27886 )
beta        : -10.0000    ( 10   5.32907e-15 )
Epeak [keV] : 135.784      ( -33.7643 -135.784 )
Norm@50keV   : 4.90324E-03    ( -0.0016449   0.00294189 )
------------------------------------------------------------
#Fit statistic : Chi-Squared =          48.85 using 59 PHA bins.
# Reduced chi-squared =         0.8882 for     55 degrees of freedom
# Null hypothesis probability =   7.072387e-01

Photon flux (15-150 keV)    in 41.62 sec: 0.400971 (    ) ph/cm2/s
Energy fluence (15-150 keV)             : 0 ( 0  0 ) ergs/cm2
S(25-50 keV) vs. S(50-100 keV) plot

S(25-50 keV)  = 8.91e-07
S(50-100 keV) = 1.25e-06
T90 vs. Hardness ratio plot
T90                                   = 63.5319999456406 sec.
Hardness ratio (energy fluence ratio) = 1.40292
Color vs. Color plot

Count Ratio  (25-50 keV) / (15-25 keV) = 1.35091
Count Ratio (50-100 keV) / (15-25 keV) = 1.01917
Mask shadow pattern
IMX = 7.325308810734436E-02, IMY = -2.981952685723963E-01
TIME vs. PHA plot around the trigger time
Blue+Cyan dotted lines: Time interval of the scaled map
From 0.000000 to 2.048000
TIME vs. DetID plot around the trigger time

Blue+Cyan dotted lines: Time interval of the scaled map
From 0.000000 to 2.048000
100 us light curve (15-350 keV)

Blue+Cyan dotted lines: Time interval of the scaled map
From 0.000000 to 2.048000
Spacecraft aspect plot

Bright source in the pre-burst/pre-slew/post-slew images
Pre-burst image of 15-350 keV band
Time interval of the image:
-239.672000 -15.788000

# RAcent  DECcent POSerr Theta    Phi  PeakCts   SNR AngSep     Name
#  [deg]    [deg]    ['] [deg]  [deg]                   [']
244.9772 -15.6444    0.2  23.8  111.8  14.4818  47.3    0.3	Sco X-1
255.8268 -37.9660    5.2  12.6   34.2   0.4711   2.2   10.5	4U 1700-377
256.4067 -36.3299    2.3  11.2   38.8   1.0461   4.9    5.8	GX 349+2
262.9963 -24.6576    5.8   5.3  136.4   0.4178   2.0    5.3	GX 1+4
264.9746 -44.3229    0.0  15.4   -3.7  -0.0230  -0.1   12.5	4U 1735-44
268.3471  -1.3687    3.0  27.7  176.6   0.9020   3.9    5.2	SW J1753.5-0127
270.4486 -25.0937    6.4   5.3 -144.0   0.3714   1.8    9.0	GX 5-1
270.2273 -25.8615    4.5   4.6 -139.5   0.5251   2.6    8.2	GRS 1758-258
273.9379 -14.0446    5.0  16.5 -161.0   0.5184   2.3    4.0	GX 17+2
275.9373 -30.5161    5.8   8.4  -84.8   0.4172   2.0    9.0	H1820-303
285.0191 -25.0329   21.9  17.0 -106.6   0.1213   0.5    6.8	HT1900.1-2455
288.7889  10.9437    1.5  45.4 -155.9   3.4855   7.8    0.6	GRS 1915+105
262.8176 -33.7806    6.4   5.7   24.2   0.4166   1.8    9.1	GX 354-0
277.3319 -23.8156    2.6  11.0 -123.0   0.9038   4.4 ------	UNKNOWN
290.5611  13.0709    3.4  48.1 -155.2   1.7219   3.4 ------	UNKNOWN
300.5577 -11.1389    3.3  36.5 -119.8   1.3069   3.5 ------	UNKNOWN
305.8264   0.7545    2.7  48.0 -128.9   4.3753   4.2 ------	UNKNOWN
Pre-slew background subtracted image of 15-350 keV band
Time interval of the image:
-15.788000 25.828590

# RAcent  DECcent POSerr Theta    Phi  PeakCts   SNR AngSep     Name
#  [deg]    [deg]    ['] [deg]  [deg]                   [']
244.9063 -15.7443    2.5  23.8  111.5  -0.4630  -4.6    7.5	Sco X-1
256.0102 -38.0022    4.3  12.5   33.6  -0.1824  -2.6    9.6	4U 1700-377
256.2309 -36.4804    4.8  11.4   38.6  -0.1715  -2.4   10.5	GX 349+2
262.8696 -24.5926    7.8   5.4  135.8  -0.1036  -1.5   11.9	GX 1+4
264.9718 -44.3364    5.5  15.4   -3.7   0.1545   2.1   11.9	4U 1735-44
268.3657  -1.4499    9.4  27.6  176.6  -0.1019  -1.2    0.2	SW J1753.5-0127
270.2907 -25.0744 1596.5   5.2 -145.4  -0.0005  -0.0    0.5	GX 5-1
270.3024 -25.7430   19.8   4.7 -140.0  -0.0439  -0.6    0.0	GRS 1758-258
274.0855 -14.1939    6.1  16.4 -160.4  -0.1404  -1.9   10.5	GX 17+2
275.7604 -30.2112    0.0   8.2  -86.7  -0.0574  -0.8   12.7	H1820-303
284.8881 -24.8278    4.8  17.0 -107.4   0.1870   2.4    9.8	HT1900.1-2455
288.7878  10.9948    4.6  45.4 -156.0  -0.3454  -2.5    3.0	GRS 1915+105
262.7824 -33.9578    0.0   5.9   23.5  -0.0729  -1.0   12.7	GX 354-0
246.8536 -29.4160    0.5  17.1   76.2   2.1313  25.5 ------	UNKNOWN
268.9135  28.0098    2.9  57.0  175.0   1.8436   4.0 ------	UNKNOWN
280.9458  10.2701    2.0  41.7 -165.8   0.6434   5.7 ------	UNKNOWN
Post-slew image of 15-350 keV band
Time interval of the image:
64.828600 962.388200

# RAcent  DECcent POSerr Theta    Phi  PeakCts   SNR AngSep     Name
#  [deg]    [deg]    ['] [deg]  [deg]                   [']
186.7111 -62.7965   10.0  50.6   18.1   2.4016   1.2    2.2	GX 301-2
244.9785 -15.6412    0.2  13.9  159.7  45.6188  73.3    0.1	Sco X-1
255.9839 -37.8182    2.6  11.3  -52.5   2.4795   4.4    1.6	4U 1700-377
256.3769 -36.3012    5.2  10.5  -59.6   1.2741   2.2    7.8	GX 349+2
262.9029 -24.7231    5.0  15.0 -117.2   1.5032   2.3    5.9	GX 1+4
264.7484 -44.3058    5.3  20.6  -51.5   1.3712   2.2    8.7	4U 1735-44
268.3721  -1.4091    3.6  34.7 -152.6   2.5327   3.1    2.6	SW J1753.5-0127
270.3010 -25.0610    2.3  21.3 -109.0   3.3822   5.1    1.4	GX 5-1
270.3596 -25.7156    4.3  21.1 -107.2   1.8627   2.7    3.5	GRS 1758-258
274.0459 -13.9312    3.3  29.5 -128.6   3.0972   3.5    6.7	GX 17+2
275.8976 -30.4210    2.2  25.1  -93.2   4.5263   5.3    3.5	H1820-303
284.8544 -24.8034    0.0  34.0 -101.3  -1.8574  -1.5   12.1	HT1900.1-2455
263.1539 -33.7656   13.6  14.5  -81.2   0.5467   0.8    9.2	GX 354-0
187.5145 -44.8249    2.2  48.6   41.7  16.4029   5.3 ------	UNKNOWN
208.0751 -52.5224    2.8  36.6   27.0   4.2792   4.1 ------	UNKNOWN
202.8764 -56.9757    3.9  41.1   22.4   3.3397   3.0 ------	UNKNOWN
227.0525 -70.9469    4.0  43.0   -3.4   3.1449   2.9 ------	UNKNOWN
284.5283 -68.8385    3.7  45.0  -30.9   3.8443   3.2 ------	UNKNOWN
Plot creation:
Sat May 30 19:53:59 EDT 2015