Click here for the BAT GCN circular template
Image
Pre-slew 15-350 keV image (Event data; bkg subtracted)
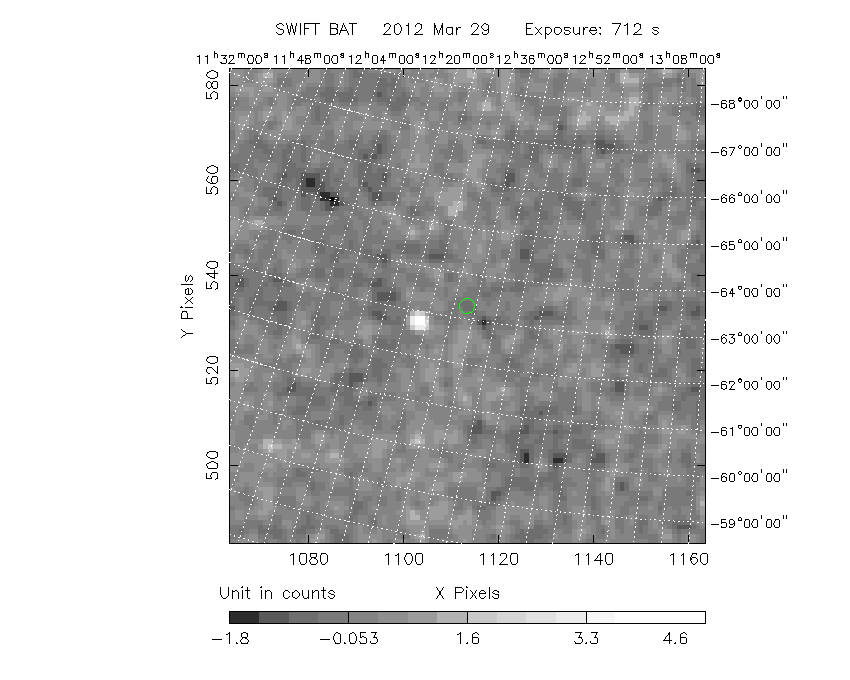
#   RAcent  DECcent POSerr  Theta    Phi     Peak Cts     SNR  Name
  188.5989 -63.2922 0.1224   26.8 -166.3      -0.8213    -1.6  TRIG_00518853
------------------------------------------

Foreground time interval of the image:
  0.000 712.000 (delta_t = 712.000 [sec])
Background time interval of the image:
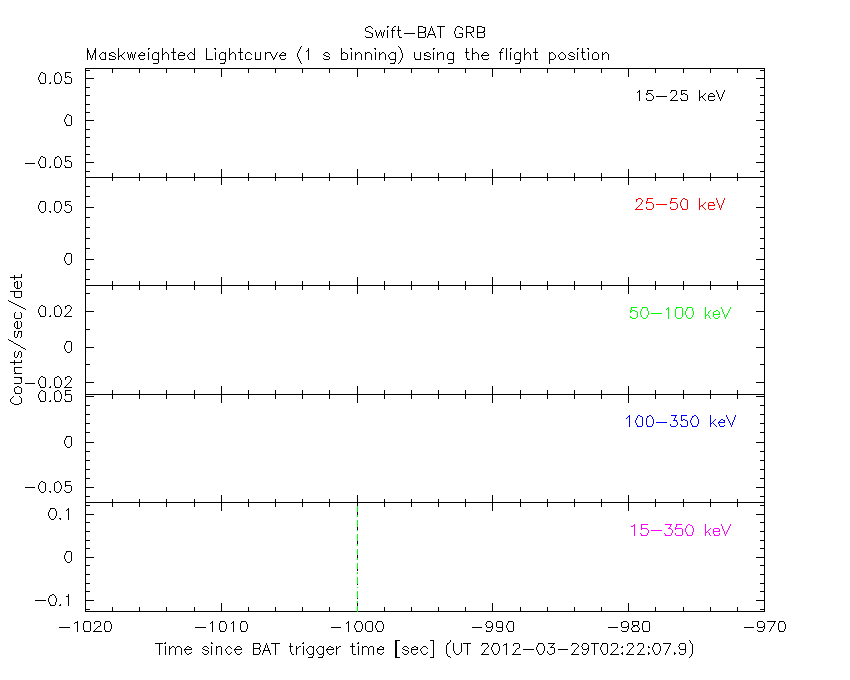
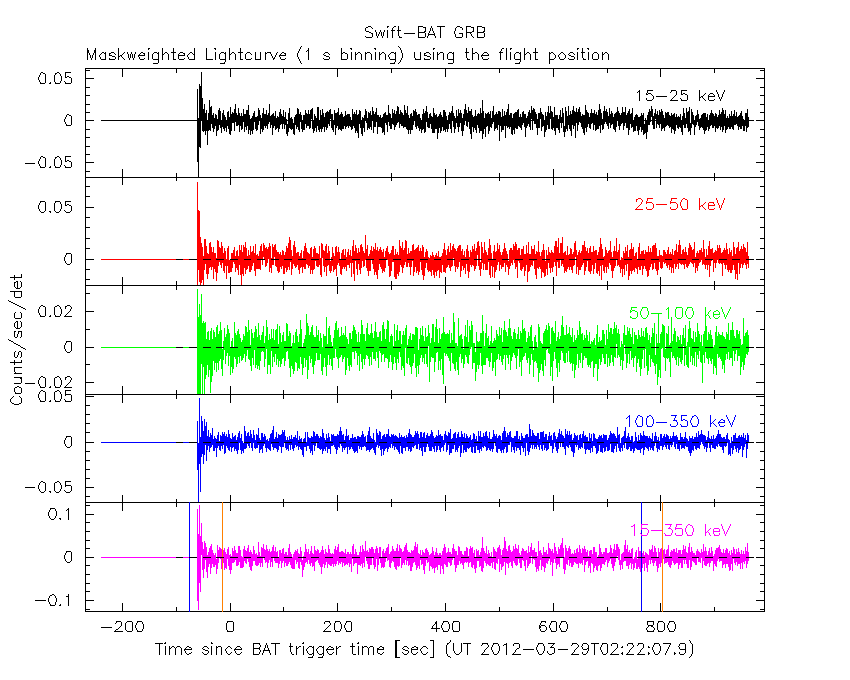
Lightcurves
Notes:
- 1) All plots contain as much data as has been downloaded to date.
- 2) The mask-weighted light curves are using the flight position.
- 3) Multiple plots of different time binning/intervals are shown to cover all scenarios of short/long GRBs, rate/image triggers, and real/false positives.
- 4) For all the mask-weighted lightcurves, the y-axis units are counts/sec/det where a det is 0.4 x 0.4 = 0.16 sq cm.
- 5) The verticle lines correspond to following: green dotted lines are T50 interval, black dotted lines are T90 interval, blue solid line(s) is a spacecraft slew start time, and orange solid line(s) is a spacecraft slew end time.
- 6) Time of each bin is in the middle of the bin.
1 s binning
From T0-310 s to T0+310 s
From T100_start - 20 s to T100_end + 30 s
Full time interval
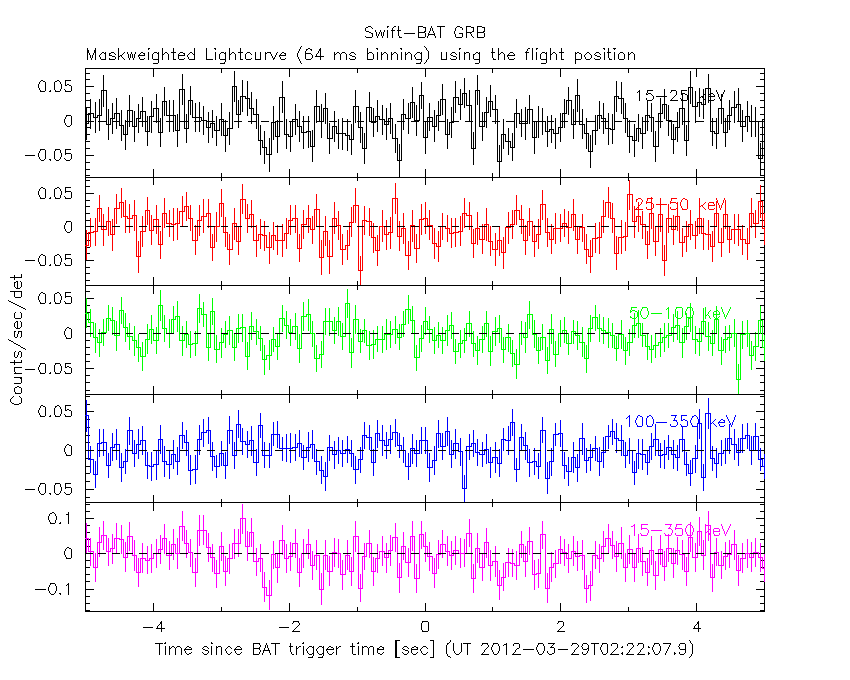
64 ms binning
Full time interval
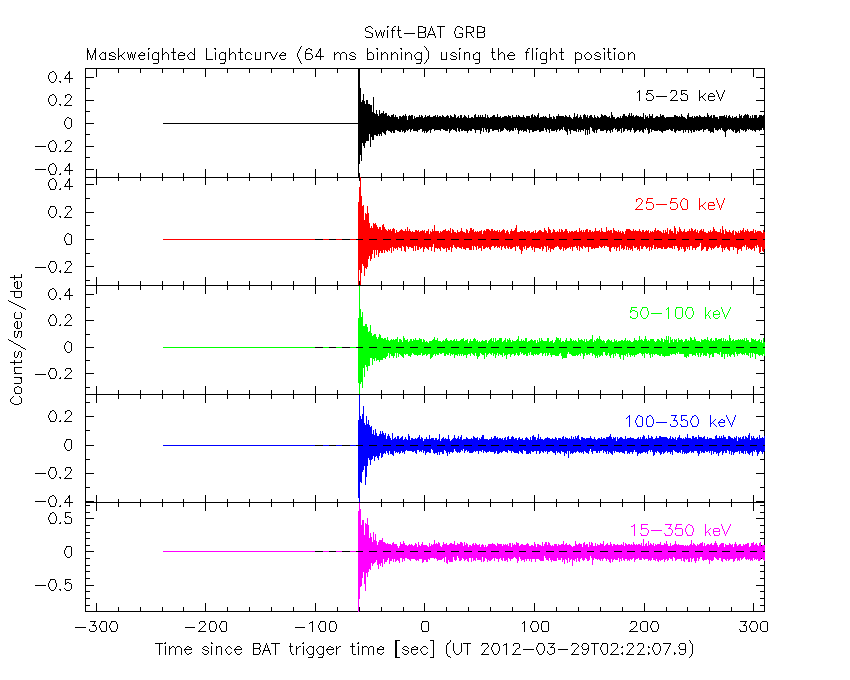
From T100_start to T100_end

From T0-5 sec to T0+5 sec
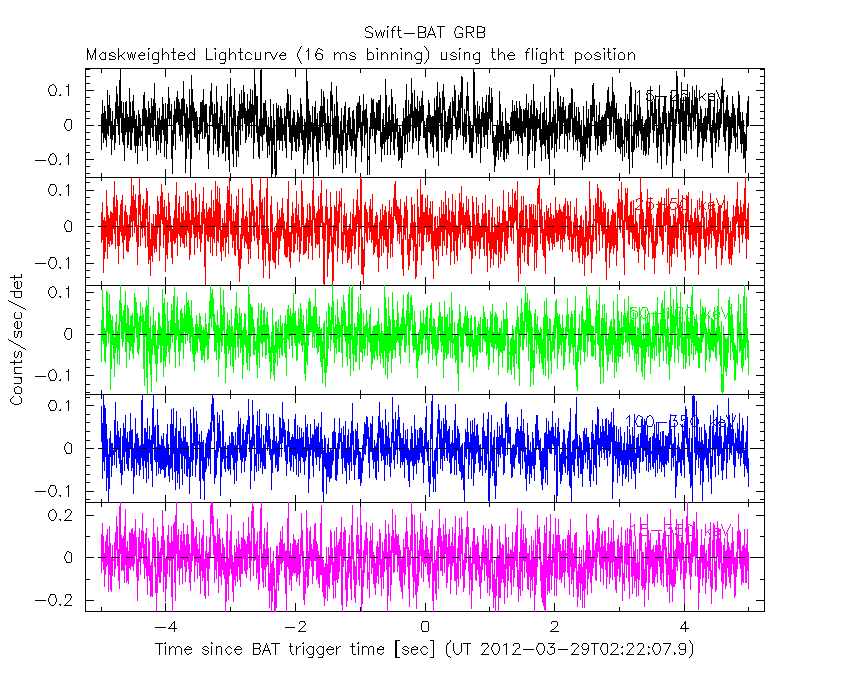
16 ms binning
From T100_start-5 s to T100_start+5 s
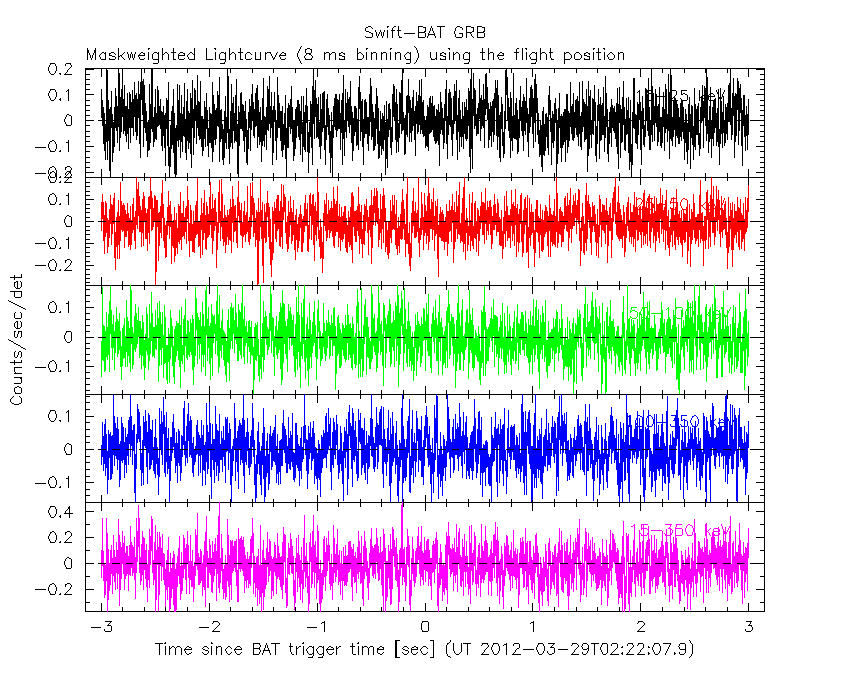
8 ms binning
From T100_start-3 s to T100_start+3 s
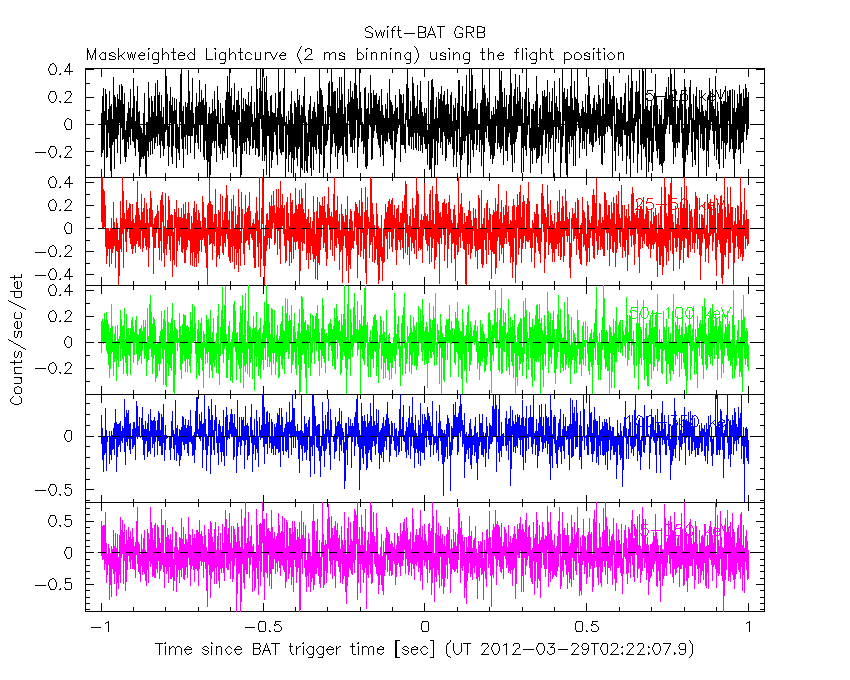
2 ms binning
From T100_start-1 s to T100_start+1 s
SN=5 or 10 sec. binning (whichever binning is satisfied first)
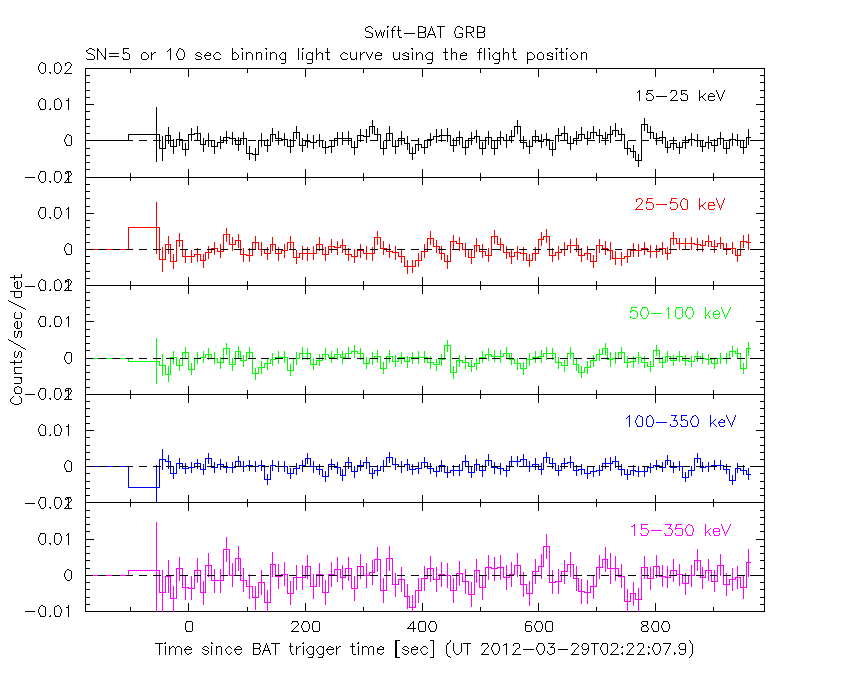
SN=5 or 10 sec. binning (T < 200 sec)

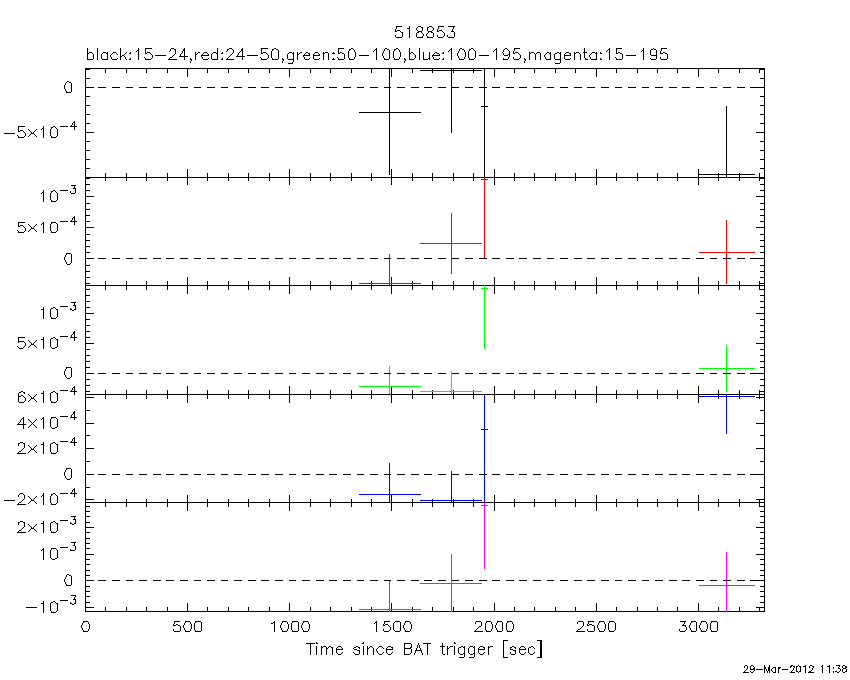
The mask-weighted light curves based on cleaned DPHs
Spectra
Notes:
- 1) The fitting includes the systematic errors.
- 2) For long bursts, a spectral fit of the pre-slew DRM will introduce some errors in both a spectral shape and a normalization if the PHA file contains a lot of the slew/post-slew time interval.
- 3) For fits to more complicated models (e.g. a power-law over a cutoff power-law), the BAT team has decided to require a chi-square improvement of more than 6 for each extra dof.
- 4) For short bursts (T90<1sec), the specrtum is also fit with Blackbody, OTTB, and Double Blackbody.
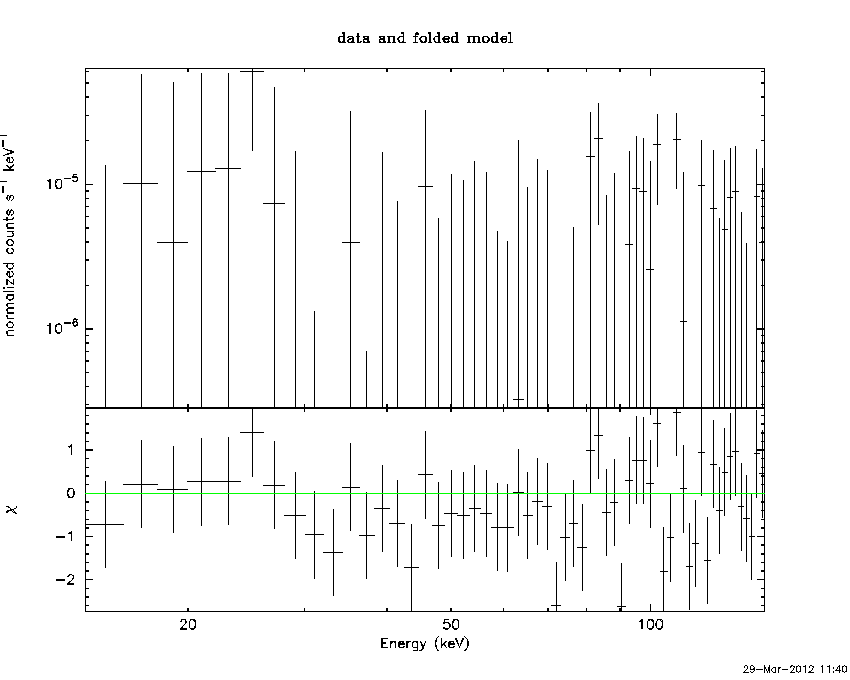
Time averaged spectrum fit using the pre-slew DRM
Power-law model

Time interval is from    0.000 sec. to  712.000 sec.

Spectral model in power-law:
------------------------------------------------------------
Parameters  : value       lower 90%   higher 90%
Photon index: 1.50000     ( -1.5   -1.5 )
Norm@50keV  : 0.0    ( 0   1.37593e-05 )
------------------------------------------------------------
# Chi-Squared =          57.47 using 59 PHA bins.
# Reduced chi-squared =          1.008 for     57 degrees of freedom
# Null hypothesis probability =   4.577127e-01

Photon flux (15-150 keV)    in 712 sec: 0.0 ( 0  0.00304016 ) ph/cm2/s
Energy fluence (15-150 keV)             : 0 ( 0  1.43301e-07 ) ergs/cm2
Cutoff power-law model

Time interval is from    0.000 sec. to  712.000 sec.
Spectral model in the cutoff power-law:
------------------------------------------------------------
Parameters  : value       lower 90%   higher 90%
Photon index: 1.00000     (     )
Epeak [keV] : 50.0000      (   )
Norm@50keV  : 0.0    (     )
------------------------------------------------------------
# Chi-Squared =          57.47 using 59 PHA bins.
# Reduced chi-squared =          1.026 for     56 degrees of freedom
# Null hypothesis probability =   4.205578e-01

Photon flux (15-150 keV)    in 712 sec: 0.0 ( 0  0.00350153 ) ph/cm2/s
Energy fluence (15-150 keV)             : 0 ( 0  2.11393e-07 ) ergs/cm2
Band function

Time interval is from    0.000 sec. to  712.000 sec.

Spectral model in the Band function:
------------------------------------------------------------
Parameters  : value       lower 90%   higher 90%
alpha       : -0.983950   ( 0.98395   0.98395 )
beta        : -2.50000    ( 2.5   2.5 )
Epeak [keV] : 80.0000      ( -80 -80 )
Norm@50keV   : 0.0    ( 0   249259 )
------------------------------------------------------------
# Chi-Squared =          57.47 using 59 PHA bins.
# Reduced chi-squared =          1.045 for     55 degrees of freedom
# Null hypothesis probability =   3.838800e-01

Photon flux (15-150 keV)    in 712 sec:  (    ) ph/cm2/s
Energy fluence (15-150 keV)             : 0 ( 0  0 ) ergs/cm2
Single BB

Spectral model blackbody:
------------------------------------------------------------
Parameters  : value    Lower 90%  Upper 90%
kT [keV]    : 5.00000  (-5  -5)
R^2/D10^2   : 0.0  (0   0)
(R is the radius in km and D10 is the distance to the source in units of 10 kpc)
------------------------------------------------------------
# Chi-Squared =          57.47 using 59 PHA bins.
# Reduced chi-squared =          1.008 for     57 degrees of freedom
# Null hypothesis probability =   4.577127e-01

Energy  Fluence     90% Error
[keV]   [erg/cm2]   [erg/cm2]
15- 25  0.000e+00   0.000e+00
25- 50  0.000e+00   0.000e+00
50-150  0.000e+00   0.000e+00
15-150  0.000e+00   0.000e+00
Thermal bremsstrahlung (OTTB)

Spectral model: thermal bremsstrahlung
------------------------------------------------------------
Parameters  : value         Lower 90%    Upper 90%
kT [keV]    : 7.00000       (-7      -7)
Norm        : 0.0       (0     0)
------------------------------------------------------------
# Chi-Squared =          57.47 using 59 PHA bins.
# Reduced chi-squared =          1.008 for     57 degrees of freedom
# Null hypothesis probability =   4.577127e-01

Energy  Fluence     90% Error
[keV]   [erg/cm2]   [erg/cm2]
15- 25  0.000e+00   0.000e+00
25- 50  0.000e+00   0.000e+00
50-150  0.000e+00   0.000e+00
15-150  0.000e+00   0.000e+00
Double BB

Spectral model: bbodyrad<1> + bbodyrad<2>
------------------------------------------------------------
Parameters  : value         Lower 90%    Upper 90%
kT1 [keV]   : 4.00000        (-4      -4)
R1^2/D10^2  : 0.0        (0      0)
kT2 [keV]   : 10.0000        (-10      -10)
R2^2/D10^2  : 0.0    (0   0)
------------------------------------------------------------
# Chi-Squared =          57.47 using 59 PHA bins.
# Reduced chi-squared =          1.045 for     55 degrees of freedom
# Null hypothesis probability =   3.838800e-01

Energy  Fluence     90% Error
[keV]   [erg/cm2]   [erg/cm2]
15- 25  0.000e+00   0.000e+00
25- 50  0.000e+00   0.000e+00
50-150  0.000e+00   0.000e+00
15-150  0.000e+00   0.000e+00
Peak spectrum fit
Power-law model

Time interval is from    0.000 sec. to  712.000 sec.

Spectral model in power-law:
------------------------------------------------------------
Parameters  : value       lower 90%   higher 90%
Photon index: 1.50000     ( -1.5   -1.5 )
Norm@50keV  : 0.0    ( 0   1.37593e-05 )
------------------------------------------------------------
# Chi-Squared =          57.47 using 59 PHA bins.
# Reduced chi-squared =          1.008 for     57 degrees of freedom
# Null hypothesis probability =   4.577127e-01

Photon flux (15-150 keV)    in 712 sec: 0.0 ( 0  0.00304016 ) ph/cm2/s
Energy fluence (15-150 keV)             : 0 ( 0  1.43306e-07 ) ergs/cm2
Cutoff power-law model

Time interval is from    0.000 sec. to  712.000 sec.
Spectral model in the cutoff power-law:
------------------------------------------------------------
Parameters  : value       lower 90%   higher 90%
Photon index: 1.00000     (     )
Epeak [keV] : 50.0000      (   )
Norm@50keV  : 0.0    (     )
------------------------------------------------------------
# Chi-Squared =          57.47 using 59 PHA bins.
# Reduced chi-squared =          1.026 for     56 degrees of freedom
# Null hypothesis probability =   4.205578e-01

Photon flux (15-150 keV)    in 712 sec: 0.0 ( 0  0.00350153 ) ph/cm2/s
Energy fluence (15-150 keV)             : 0 ( 0  2.11393e-07 ) ergs/cm2
Band function
Time interval is from    0.000 sec. to  712.000 sec.

Spectral model in the Band function:
------------------------------------------------------------
Parameters  : value       lower 90%   higher 90%
alpha       : -0.983950   ( 0.98395   0.98395 )
beta        : -2.50000    ( 2.5   2.5 )
Epeak [keV] : 80.0000      ( -80 -80 )
Norm@50keV   : 0.0    ( 0   249259 )
------------------------------------------------------------
# Chi-Squared =          57.47 using 59 PHA bins.
# Reduced chi-squared =          1.045 for     55 degrees of freedom
# Null hypothesis probability =   3.838800e-01

Photon flux (15-150 keV)    in 712 sec:  (    ) ph/cm2/s
Energy fluence (15-150 keV)             : 0 ( 0  0 ) ergs/cm2
Single BB

Spectral model blackbody:
------------------------------------------------------------
Parameters  : value    Lower 90%  Upper 90%
kT [keV]    : 5.00000  (-5  -5)
R^2/D10^2   : 0.0  (0   0)
(R is the radius in km and D10 is the distance to the source in units of 10 kpc)
------------------------------------------------------------
# Chi-Squared =          57.47 using 59 PHA bins.
# Reduced chi-squared =          1.008 for     57 degrees of freedom
# Null hypothesis probability =   4.577127e-01

Energy  Fluence     90% Error
[keV]   [erg/cm2]   [erg/cm2]
15- 25  0.000e+00   0.000e+00
25- 50  0.000e+00   0.000e+00
50-150  0.000e+00   0.000e+00
15-150  0.000e+00   0.000e+00
Thermal bremsstrahlung (OTTB)

Spectral model: thermal bremsstrahlung
------------------------------------------------------------
Parameters  : value         Lower 90%    Upper 90%
kT [keV]    : 7.00000       (-7      -7)
Norm        : 0.0       (0     0)
------------------------------------------------------------
# Chi-Squared =          57.47 using 59 PHA bins.
# Reduced chi-squared =          1.008 for     57 degrees of freedom
# Null hypothesis probability =   4.577127e-01

Energy  Fluence     90% Error
[keV]   [erg/cm2]   [erg/cm2]
15- 25  0.000e+00   0.000e+00
25- 50  0.000e+00   0.000e+00
50-150  0.000e+00   0.000e+00
15-150  0.000e+00   0.000e+00
Double BB

Spectral model: bbodyrad<1> + bbodyrad<2>
------------------------------------------------------------
Parameters  : value         Lower 90%    Upper 90%
kT1 [keV]   : 4.00000        (-4      -4)
R1^2/D10^2  : 0.0        (0      0)
kT2 [keV]   : 10.0000        (-10      -10)
R2^2/D10^2  : 0.0    (0   0)
------------------------------------------------------------
# Chi-Squared =          57.47 using 59 PHA bins.
# Reduced chi-squared =          1.045 for     55 degrees of freedom
# Null hypothesis probability =   3.838800e-01

Energy  Fluence     90% Error
[keV]   [erg/cm2]   [erg/cm2]
15- 25  0.000e+00   0.000e+00
25- 50  0.000e+00   0.000e+00
50-150  0.000e+00   0.000e+00
15-150  0.000e+00   0.000e+00
Pre-slew spectrum (Pre-slew PHA with pre-slew DRM)
Power-law model

Spectral model in power-law:
------------------------------------------------------------
Parameters  : value       lower 90%   higher 90%
Photon index: 1.50000     ( -1.5   -1.5 )
Norm@50keV  : 0.0    ( 0   1.37593e-05 )
------------------------------------------------------------
# Chi-Squared =          57.47 using 59 PHA bins.
# Reduced chi-squared =          1.008 for     57 degrees of freedom
# Null hypothesis probability =   4.577127e-01

Photon flux (15-150 keV)    in 712 sec: 0.0 ( 0  0.00304016 ) ph/cm2/s
Energy fluence (15-150 keV)             : 0 ( 0  1.43301e-07 ) ergs/cm2
Cutoff power-law model

Spectral model in the cutoff power-law:
------------------------------------------------------------
Parameters  : value       lower 90%   higher 90%
Photon index: 1.00000     (     )
Epeak [keV] : 50.0000      (   )
Norm@50keV  : 0.0    (     )
------------------------------------------------------------
# Chi-Squared =          57.47 using 59 PHA bins.
# Reduced chi-squared =          1.026 for     56 degrees of freedom
# Null hypothesis probability =   4.205578e-01

Photon flux (15-150 keV)    in 712 sec: 0.0 ( 0  0.00350153 ) ph/cm2/s
Energy fluence (15-150 keV)             : 0 ( 0  2.11393e-07 ) ergs/cm2
Band function

Spectral model in the Band function:
------------------------------------------------------------
Parameters  : value       lower 90%   higher 90%
alpha       : -0.983950   ( 0.98395   0.98395 )
beta        : -2.50000    ( 2.5   2.5 )
Epeak [keV] : 80.0000      ( -80 -80 )
Norm@50keV   : 0.0    ( 0   249259 )
------------------------------------------------------------
# Chi-Squared =          57.47 using 59 PHA bins.
# Reduced chi-squared =          1.045 for     55 degrees of freedom
# Null hypothesis probability =   3.838800e-01

Photon flux (15-150 keV)    in 712 sec:  (    ) ph/cm2/s
Energy fluence (15-150 keV)             : 0 ( 0  0 ) ergs/cm2
S(25-50 keV) vs. S(50-100 keV) plot
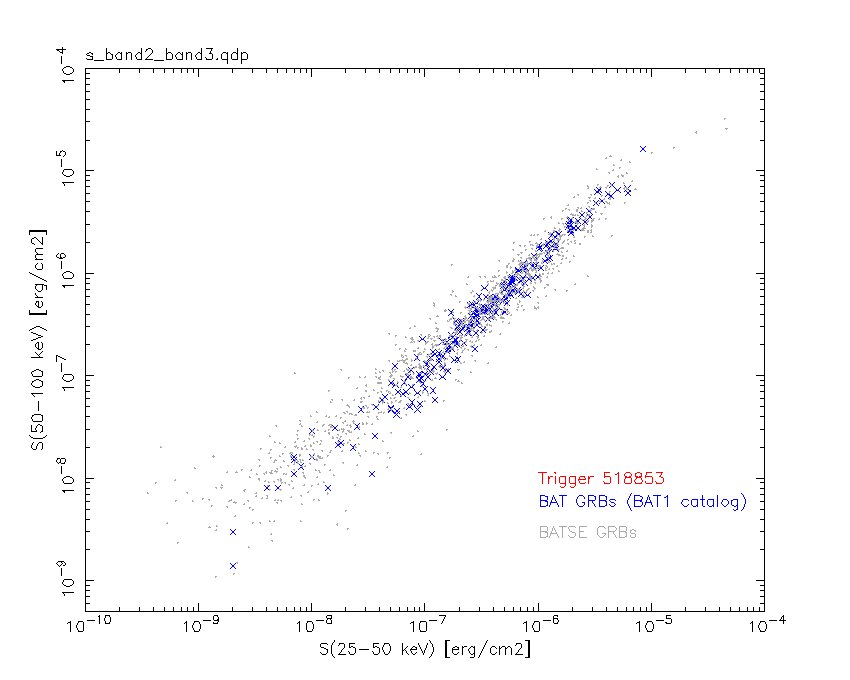
S(25-50 keV)  = 0
S(50-100 keV) = 0
T90 vs. Hardness ratio plot

T90                                   = 712 sec.
Hardness ratio (energy fluence ratio) =
Color vs. Color plot
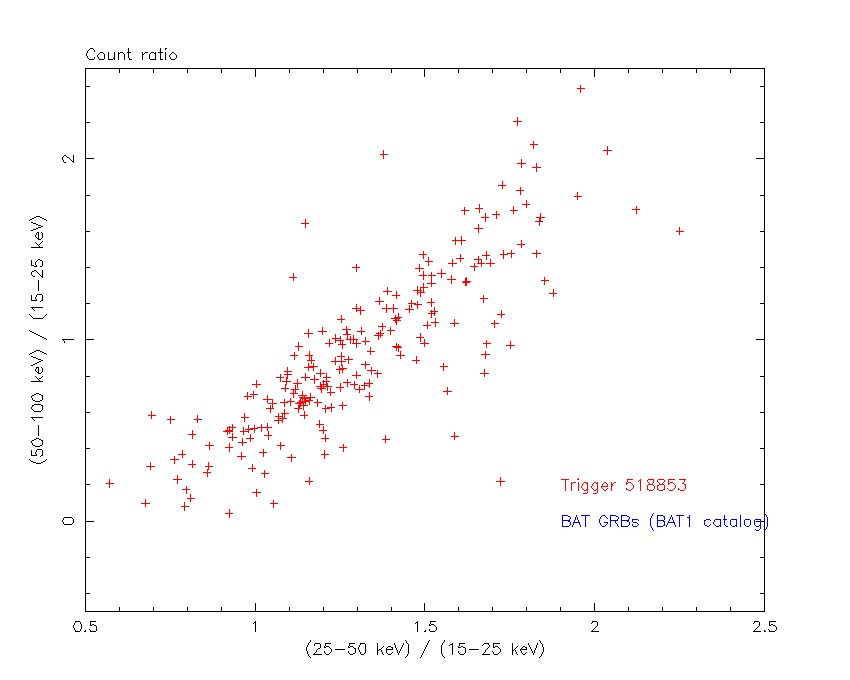
Count Ratio  (25-50 keV) / (15-25 keV) = -3.6319
Count Ratio (50-100 keV) / (15-25 keV) = -3.95614
Mask shadow pattern
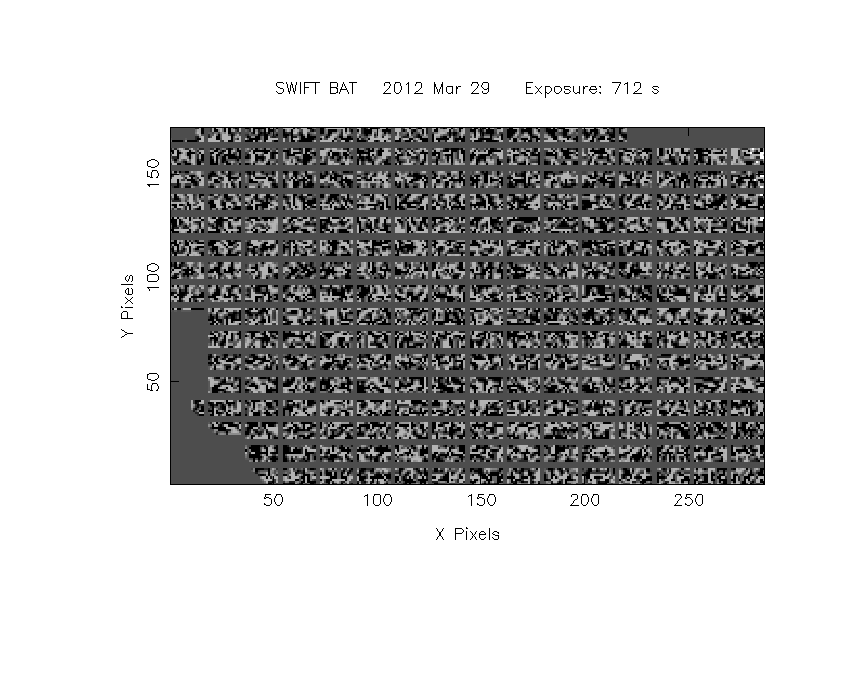
IMX = -4.911528997011668E-01, IMY = 1.195000721400103E-01
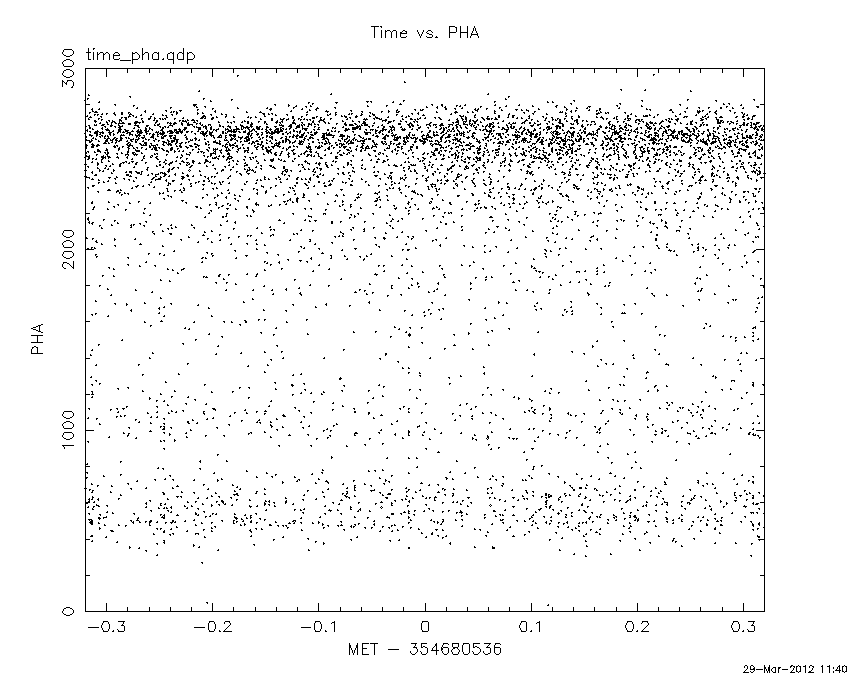
TIME vs. PHA plot around the trigger time
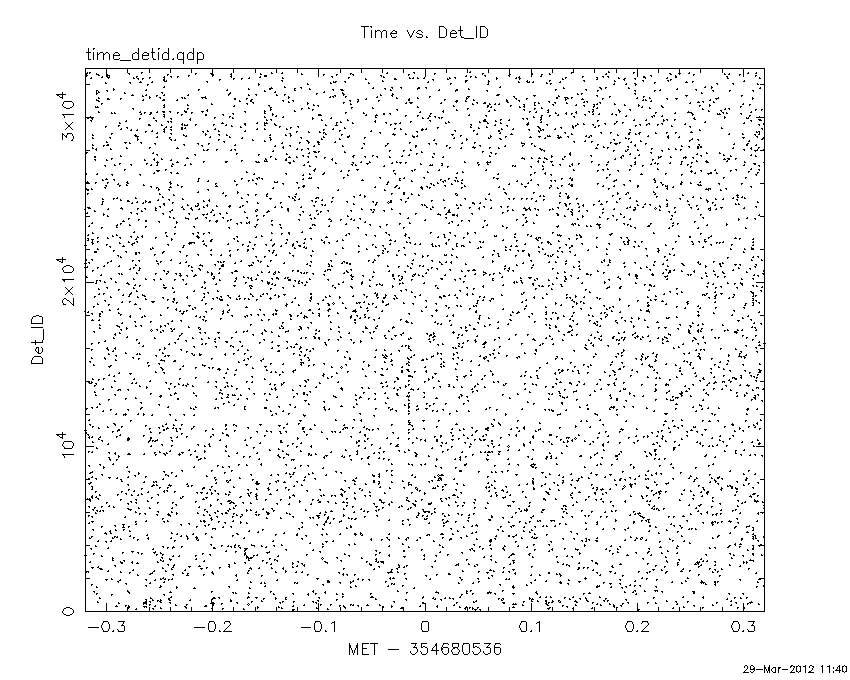
TIME vs. DetID plot around the trigger time
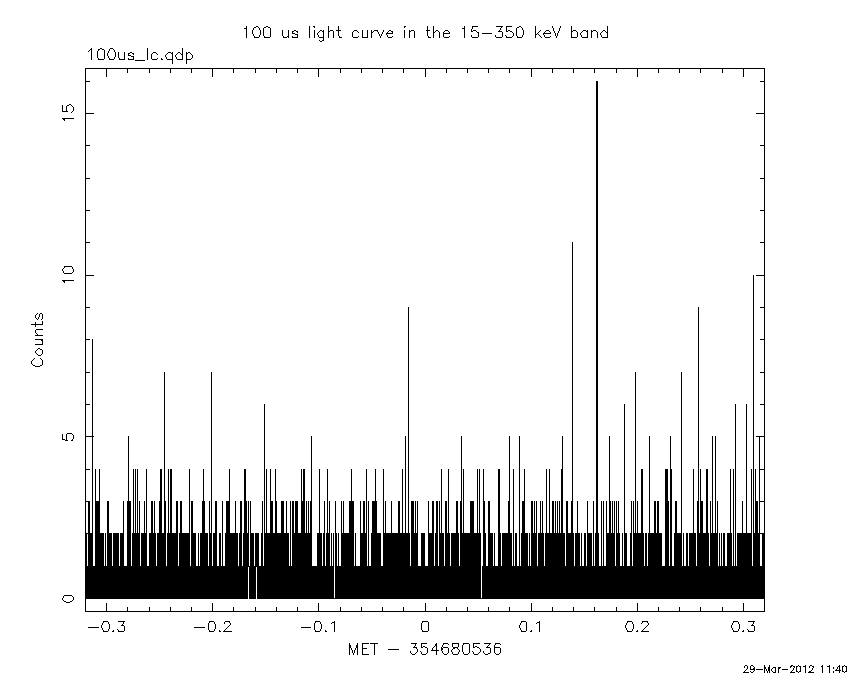
100 us light curve (15-350 keV)
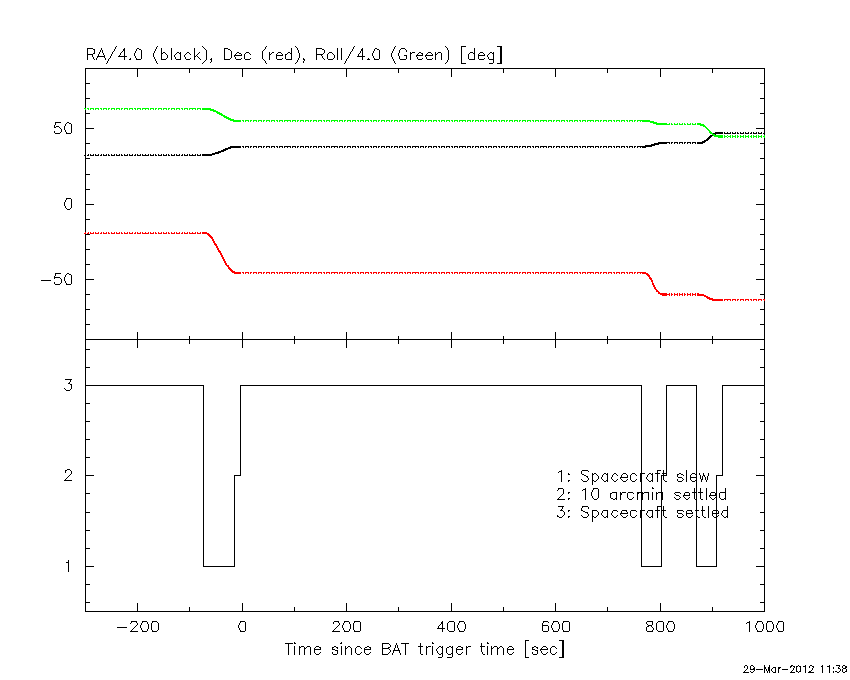
Spacecraft aspect plot
Bright source in the pre-burst/pre-slew/post-slew images
Pre-burst image of 15-350 keV band
Time interval of the image:
Pre-slew background subtracted image of 15-350 keV band
Time interval of the image:
0.000000 712.000000

# RAcent  DECcent POSerr Theta    Phi  PeakCts   SNR AngSep     Name
#  [deg]    [deg]    ['] [deg]  [deg]                   [']
135.5166 -40.5539    0.8  13.6  -25.7   6.2552  13.8    0.5	Vela X-1
170.3002 -60.6134    1.8  18.3 -158.6   2.9393   6.5    0.7	Cen X-3
186.6538 -62.7726    1.0  25.8 -166.5   5.5324  11.6    0.2	GX 301-2
106.5445  -4.7475    2.8  57.2   -9.7   8.6298   4.2 ------	UNKNOWN
138.7398 -73.3295    3.6  28.6 -122.3   1.8367   3.2 ------	UNKNOWN
258.6215 -65.0510    3.0  55.6 -160.2   6.7974   3.9 ------	UNKNOWN
113.5759 -69.7030    2.9  31.0 -105.5   2.6740   4.0 ------	UNKNOWN
Post-slew image of 15-350 keV band
Time interval of the image:
802.100600 870.000610

# RAcent  DECcent POSerr Theta    Phi  PeakCts   SNR AngSep     Name
#  [deg]    [deg]    ['] [deg]  [deg]                   [']
135.5578 -40.6047    2.2  25.5    5.7   0.4752   5.3    3.3	Vela X-1
170.4056 -60.5631    4.1   4.0  162.4   0.2231   2.8    4.5	Cen X-3
186.6942 -62.8205    2.1  11.9  173.6   0.4409   5.4    3.2	GX 301-2
264.7627 -44.3793    4.2  58.1 -176.6   1.4168   2.7    4.3	4U 1735-44
212.0053 -30.7865    2.7  43.7  129.7   1.3593   4.3 ------	UNKNOWN
136.4197 -20.2012    2.7  43.8   22.1   0.7571   4.3 ------	UNKNOWN
131.7802 -20.2644    2.2  45.2   16.3   0.9857   5.3 ------	UNKNOWN
205.5906 -60.8114    2.1  21.0  170.1   0.4665   5.6 ------	UNKNOWN
282.1165 -52.8477    3.4  57.4 -159.8   1.6197   3.4 ------	UNKNOWN
357.5483 -75.9463    2.8  43.9 -116.0   1.5082   4.1 ------	UNKNOWN
Plot creation:
Thu Mar 29 11:41:00 EDT 2012