Special notes of this burst
Image
Pre-slew 15.0-350.0 keV image (Event data)

#   RAcent    DECcent   POSerr    Theta     Phi              Peak Cts       SNR   Name
   58.0599   -17.6604   0.0228     1.7798   141.1757         0.6700607      8.439 TRIG_00519043

Foreground time interval of the image:
-15.299  52.716 (delta_t =  68.015 [sec])
Background time interval of the image:
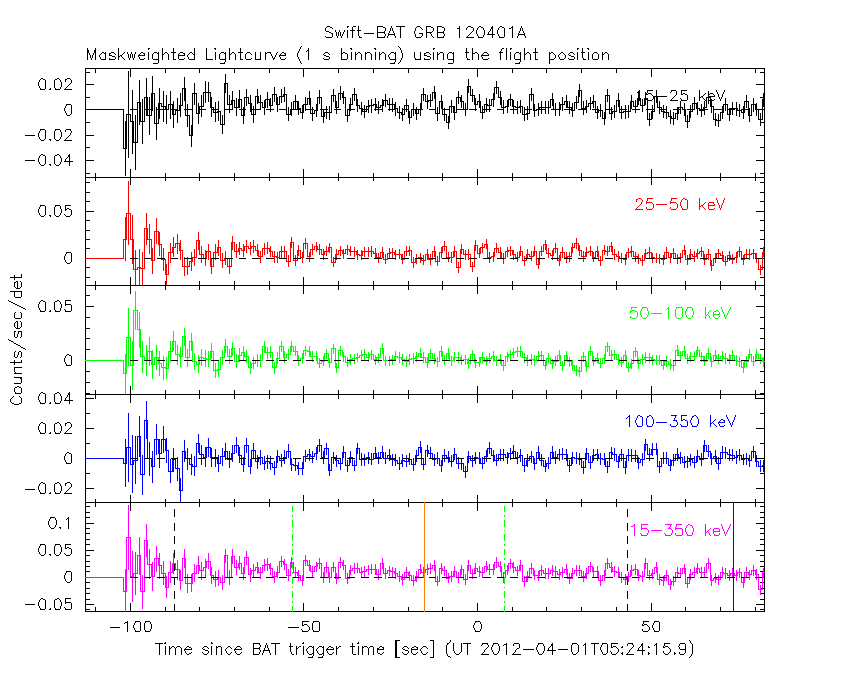
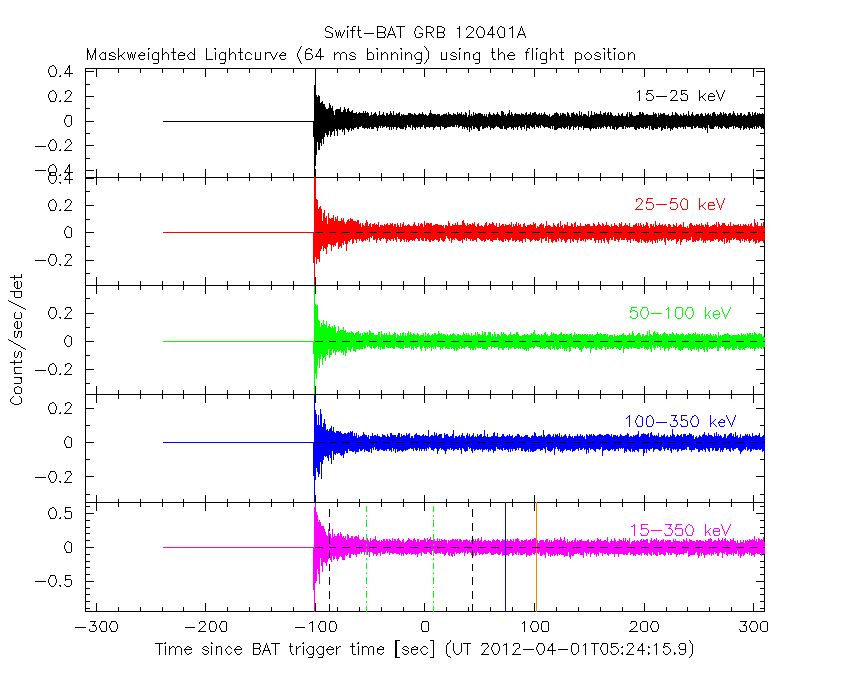
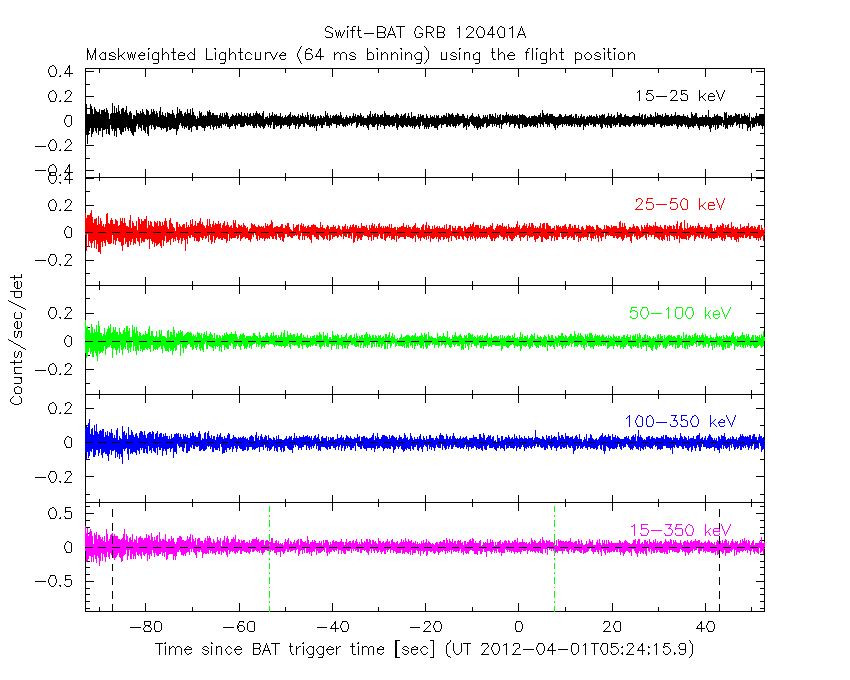
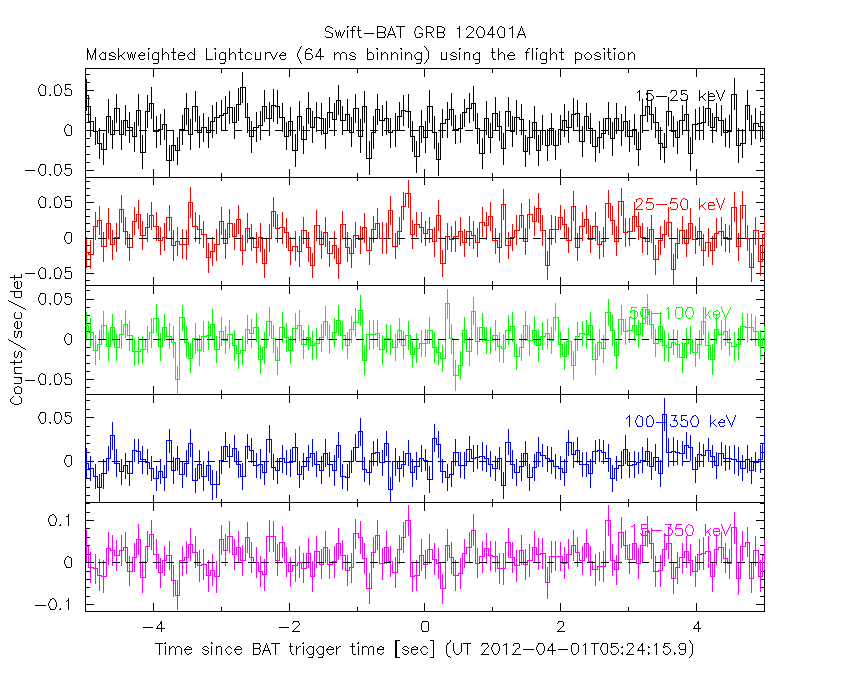
Lightcurves
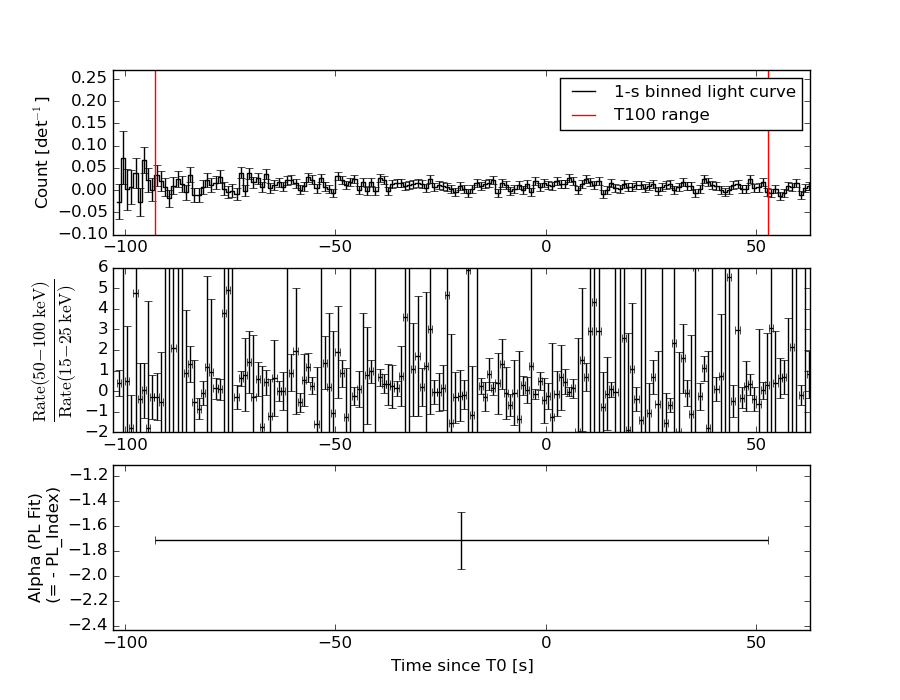
Notes:
- 1) The mask-weighted light curves are using the flight position.
- 2) Multiple plots of different time binning/intervals are shown to cover all scenarios of short/long GRBs, rate/image triggers, and real/false positives.
- 3) For all the mask-weighted lightcurves, the y-axis units are counts/sec/det where a det is 0.4 x 0.4 = 0.16 sq cm.
- 4) The verticle lines correspond to following: green dotted lines are T50 interval, black dotted lines are T90 interval, blue solid line(s) is a spacecraft slew start time, and orange solid line(s) is a spacecraft slew end time.
- 5) Time of each bin is in the middle of the bin.
1 s binning
From T0-310 s to T0+310 s

From T100_start - 20 s to T100_end + 30 s
Full time interval

64 ms binning
Full time interval
From T100_start to T100_end
From T0-5 sec to T0+5 sec
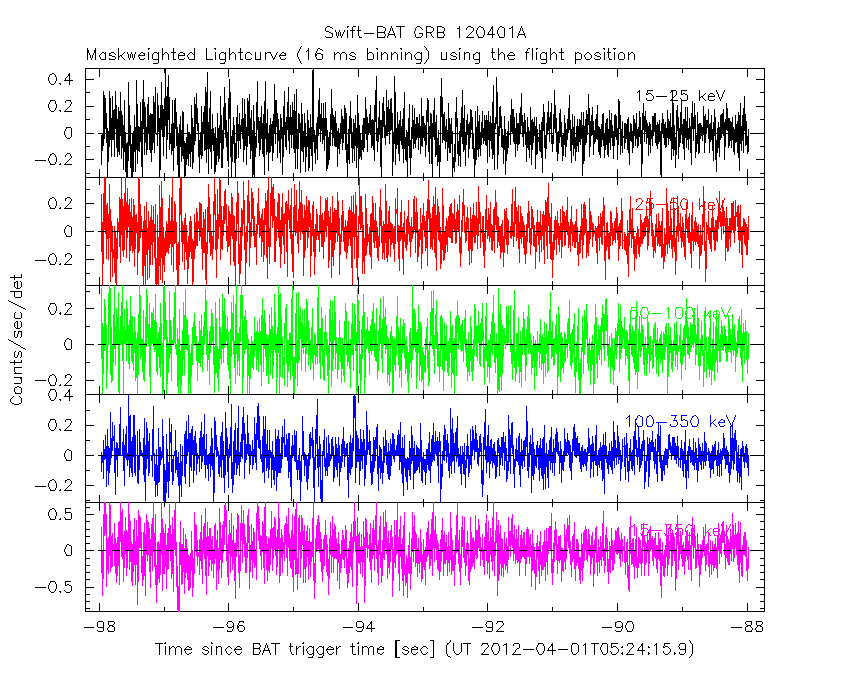
16 ms binning
From T100_start-5 s to T100_start+5 s
Blue+Cyan dotted lines: Time interval of the scaled map
From 0.000000 to 64.000000
8 ms binning
From T100_start-3 s to T100_start+3 s

Blue+Cyan dotted lines: Time interval of the scaled map
From 0.000000 to 64.000000
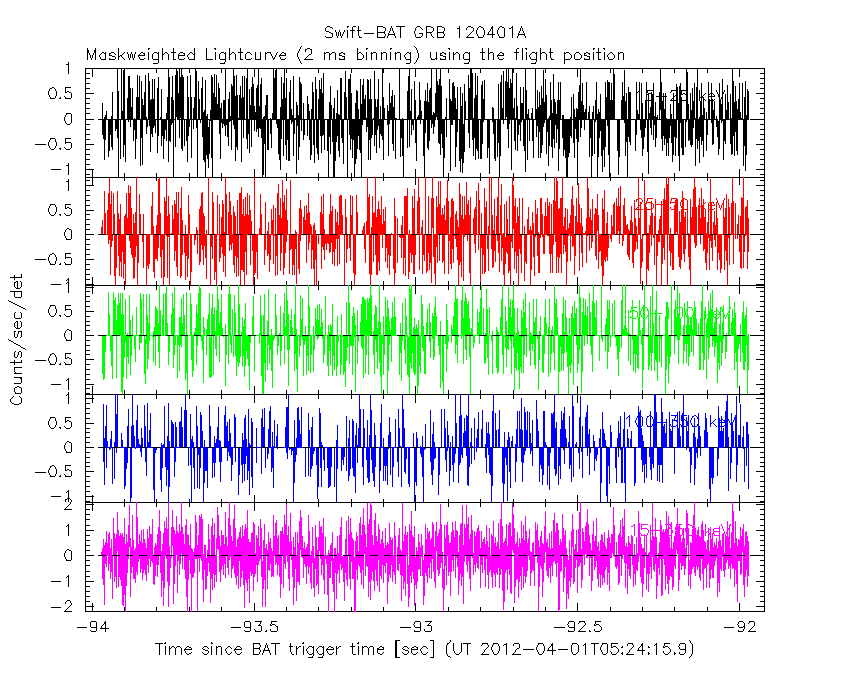
2 ms binning
From T100_start-1 s to T100_start+1 s
Blue+Cyan dotted lines: Time interval of the scaled map
From 0.000000 to 64.000000
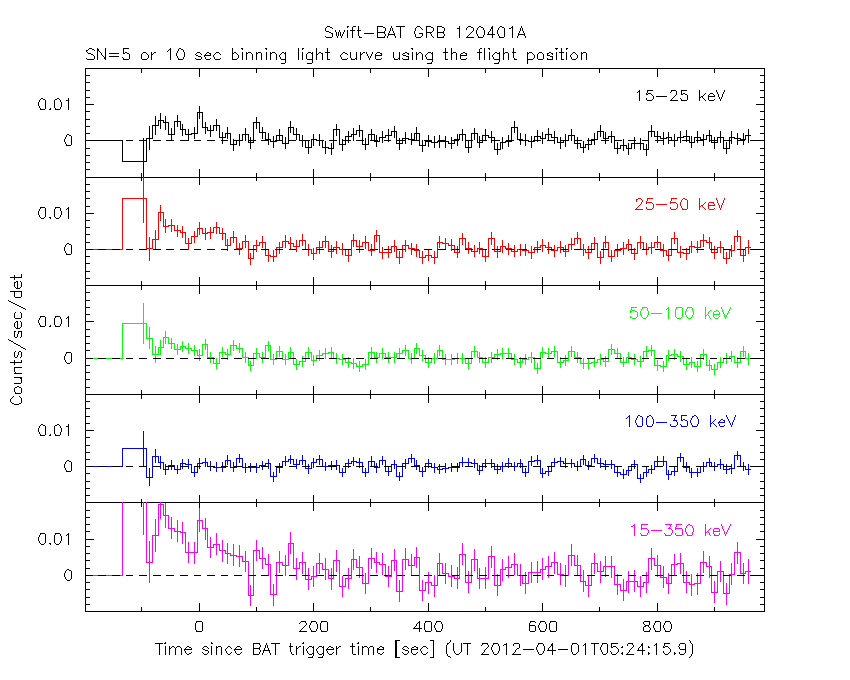
SN=5 or 10 sec. binning (whichever binning is satisfied first)
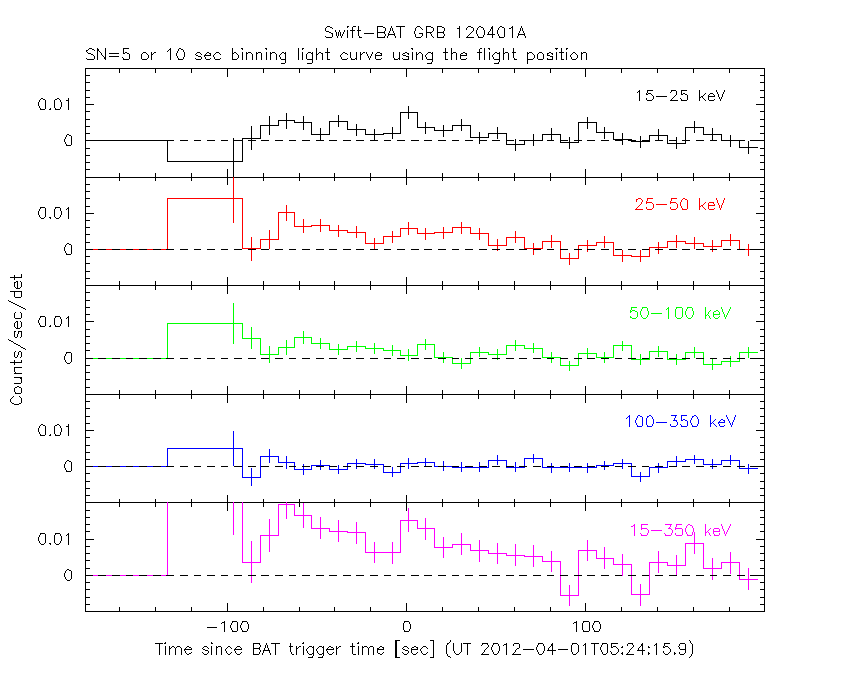
SN=5 or 10 sec. binning (T < 200 sec)
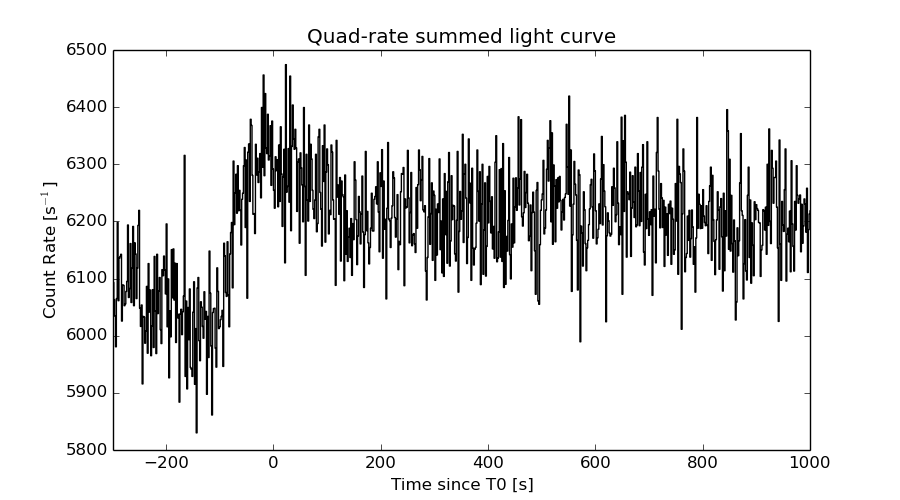
Quad-rate summed light curves (from T0-300s to T0+1000s)
The mask-weighted light curves based on cleaned DPHs

Spectral Evolution
Spectra
Notes:
- 1) The fitting includes the systematic errors.
- 2) When the burst includes telescope slew time periods, the fitting uses an average response file made from multiple 5-s response files through out the slew time plus single time preiod for the non-slew times, and weighted by the total counts in the corresponding time period using addrmf. An average response file is needed becuase a spectral fit using the pre-slew DRM will introduce some errors in both a spectral shape and a normalization if the PHA file contains a lot of the slew/post-slew time interval.
- 3) For fits to more complicated models (e.g. a power-law over a cutoff power-law), the BAT team has decided to require a chi-square improvement of more than 6 for each extra dof.
Time averaged spectrum fit using the average DRM
Power-law model
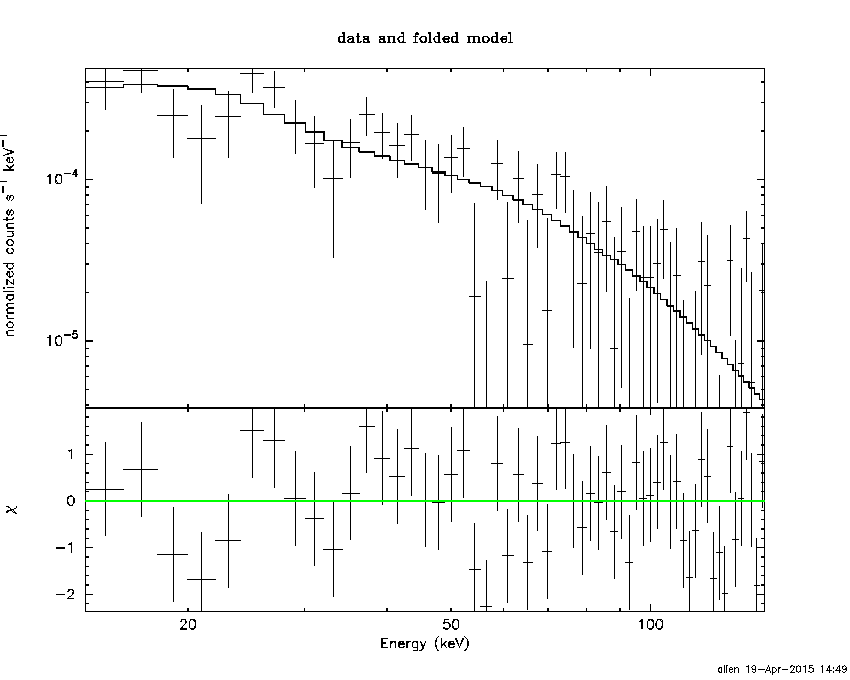
Time interval is from  -92.972 sec. to   52.716 sec.

Spectral model in power-law:
------------------------------------------------------------
Parameters  : value       lower 90%   higher 90%
Photon index: 1.71425     ( -0.223931   0.233742 )
Norm@50keV  : 6.83356E-04    ( -9.97161e-05   9.76324e-05 )
------------------------------------------------------------
#Fit statistic : Chi-Squared =          60.78 using 59 PHA bins.
# Reduced chi-squared =          1.066 for     57 degrees of freedom
# Null hypothesis probability =   3.414946e-01

Photon flux (15-150 keV)    in 145.7 sec: 9.12138E-02 ( -0.0116951  0.0117 ) ph/cm2/s
Energy fluence (15-150 keV)             : 9.20855e-07 ( -1.38926e-07  1.41788e-07 ) ergs/cm2
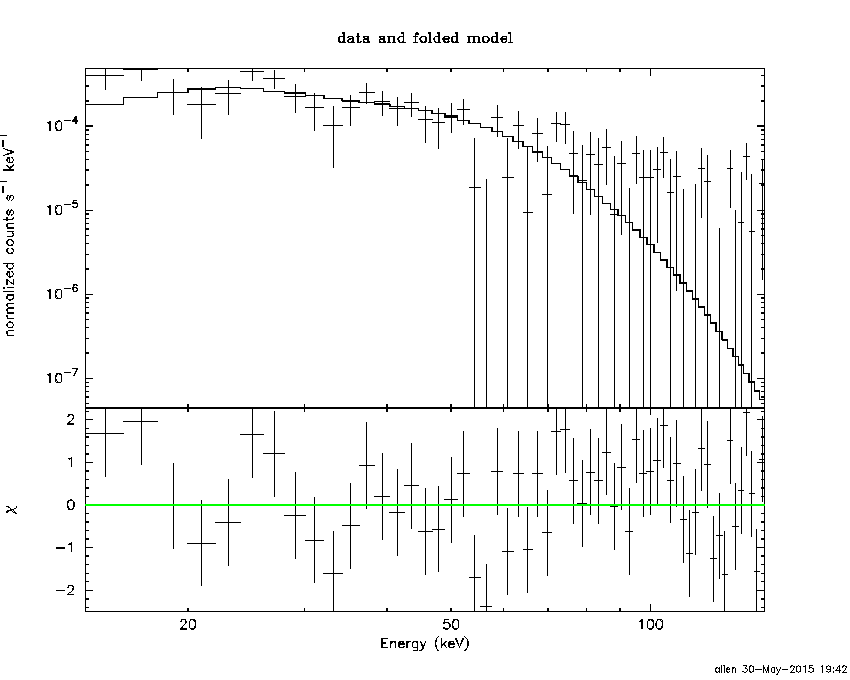
Cutoff power-law model
Time interval is from  -92.972 sec. to   52.716 sec.
Spectral model in the cutoff power-law:
------------------------------------------------------------
Parameters  : value       lower 90%   higher 90%
Photon index: 1.15925     ( -1.1342   0.734388 )
Epeak [keV] : 68.5011      ( -43.8267 -68.5011 )
Norm@50keV  : 1.37626E-03    ( -0.000769293   0.00440972 )
------------------------------------------------------------
#Fit statistic : Chi-Squared =          59.70 using 59 PHA bins.
# Reduced chi-squared =          1.066 for     56 degrees of freedom
# Null hypothesis probability =   3.427219e-01

Photon flux (15-150 keV)    in 145.7 sec: 8.92461E-02 ( -0.0121714  0.0121119 ) ph/cm2/s
Energy fluence (15-150 keV)             : 8.74366e-07 ( -1.56488e-07  1.60487e-07 ) ergs/cm2
Band function

Time interval is from  -92.972 sec. to   52.716 sec.

Spectral model in the Band function:
------------------------------------------------------------
Parameters  : value       lower 90%   higher 90%
alpha       : -1.20291   ( -0.588063   0.726824 )
beta        : -9.35917    ( 9.37074   19.3707 )
Epeak [keV] : 71.5807      ( -26.2053 -71.4543 )
Norm@50keV   : 1.29416E-03    ( -0.000585821   0.000825139 )
------------------------------------------------------------
#Fit statistic : Chi-Squared =          59.71 using 59 PHA bins.
# Reduced chi-squared =          1.086 for     55 degrees of freedom
# Null hypothesis probability =   3.084987e-01

Photon flux (15-150 keV)    in 145.7 sec: 8.94782E-02 (    ) ph/cm2/s
Energy fluence (15-150 keV)             : 8.80698e-07 ( 0  0 ) ergs/cm2
Single BB
Spectral model blackbody:
------------------------------------------------------------
Parameters  : value    Lower 90%  Upper 90%
kT [keV]    : 11.7652  (-1.70253  2.08092)
R^2/D10^2   : 2.39677E-02  (-0.0107807   0.018585)
(R is the radius in km and D10 is the distance to the source in units of 10 kpc)
------------------------------------------------------------
#Fit statistic : Chi-Squared =          70.10 using 59 PHA bins.
# Reduced chi-squared =          1.230 for     57 degrees of freedom
# Null hypothesis probability =   1.139882e-01

Energy  Fluence     90% Error
[keV]   [erg/cm2]   [erg/cm2]
15- 25  1.020e-07   2.257e-08
25- 50  3.137e-07   5.223e-08
50-150  2.576e-07   7.110e-08
15-150  6.733e-07   1.202e-07
Thermal bremsstrahlung (OTTB)

Spectral model: thermal bremsstrahlung
------------------------------------------------------------
Parameters  : value         Lower 90%    Upper 90%
kT [keV]    : 99.9345       (-38.0082      -108.368)
Norm        : 0.405713       (-0.0637468     0.0700497)
------------------------------------------------------------
#Fit statistic : Chi-Squared =          60.00 using 59 PHA bins.
# Reduced chi-squared =          1.053 for     57 degrees of freedom
# Null hypothesis probability =   3.674612e-01

Energy  Fluence     90% Error
[keV]   [erg/cm2]   [erg/cm2]
15- 25  1.545e-07   2.891e-08
25- 50  2.671e-07   4.706e-08
50-150  4.327e-07   2.153e-07
15-150  8.544e-07   2.480e-07
Double BB

Spectral model: bbodyrad<1> + bbodyrad<2>
------------------------------------------------------------
Parameters  : value         Lower 90%    Upper 90%
kT1 [keV]   : 7.82283        (-3.247      2.62762)
R1^2/D10^2  : 7.61913E-02        (-0.0450989      0.336561)
kT2 [keV]   : 26.6117        (-22.0268      74.4411)
R2^2/D10^2  : 7.96220E-04    (-0.000771341   0.00630993)
------------------------------------------------------------
#Fit statistic : Chi-Squared =          59.87 using 59 PHA bins.
# Reduced chi-squared =          1.089 for     55 degrees of freedom
# Null hypothesis probability =   3.033112e-01

Energy  Fluence     90% Error
[keV]   [erg/cm2]   [erg/cm2]
15- 25  1.346e-07   7.416e-08
25- 50  2.839e-07   1.532e-07
50-150  4.684e-07   2.691e-07
15-150  8.869e-07   4.383e-07
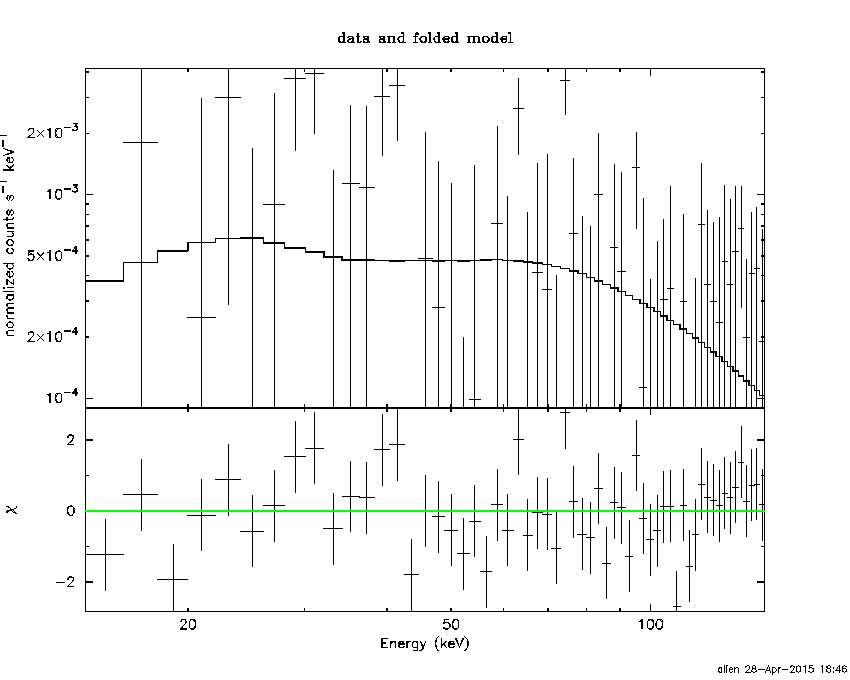
Peak spectrum fit
Power-law model

Time interval is from  -92.520 sec. to  -91.520 sec.

Spectral model in power-law:
------------------------------------------------------------
Parameters  : value       lower 90%   higher 90%
Photon index: -1.96203     (     )
Norm@50keV  : 1.89357E-04    ( -0.000189359   0.00563589 )
------------------------------------------------------------
#Fit statistic : Chi-Squared =          63.89 using 59 PHA bins.
# Reduced chi-squared =          1.121 for     57 degrees of freedom
# Null hypothesis probability =   2.473120e-01

Photon flux (15-150 keV)    in 1 sec: 0.377478 8.26538E-02 (    ) ph/cm2/s
Energy fluence (15-150 keV)             : 6.20764e-16 ( 0  0 ) ergs/cm2
Cutoff power-law model
Time interval is from  -92.520 sec. to  -91.520 sec.
Spectral model in the cutoff power-law:
------------------------------------------------------------
Parameters  : value       lower 90%   higher 90%
Photon index: 0.632195     ( -0.629984   1.21144 )
Epeak [keV] : 9999.36      ( -9999.36 -9999.36 )
Norm@50keV  : 3.39981E-03    ( -0.00338895   0.817487 )
------------------------------------------------------------
#Fit statistic : Chi-Squared =          64.55 using 59 PHA bins.
# Reduced chi-squared =          1.153 for     56 degrees of freedom
# Null hypothesis probability =   2.025773e-01

Photon flux (15-150 keV)    in 1 sec: 0.397254 6.16275E-02 (    ) ph/cm2/s
Energy fluence (15-150 keV)             : 4.22915e-08 ( -2.61298e-08  2.61154e-08 ) ergs/cm2
Band function

Time interval is from  -92.520 sec. to  -91.520 sec.

Spectral model in the Band function:
------------------------------------------------------------
Parameters  : value       lower 90%   higher 90%
alpha       : 4.96669   ( -4.96669   -4.96669 )
beta        : 1.96422    ( -3.87663   -1.96422 )
Epeak [keV] : 98.5683      ( -98.5683 -98.5683 )
Norm@50keV   : 6.17698E-03    (     )
------------------------------------------------------------
#Fit statistic : Chi-Squared =          63.89 using 59 PHA bins.
# Reduced chi-squared =          1.162 for     55 degrees of freedom
# Null hypothesis probability =   1.924361e-01

Photon flux (15-150 keV)    in 1 sec:  (    ) ph/cm2/s
Energy fluence (15-150 keV)             : 0 ( 0  0 ) ergs/cm2
Single BB

Spectral model blackbody:
------------------------------------------------------------
Parameters  : value    Lower 90%  Upper 90%
kT [keV]    : 200.000  (  )
R^2/D10^2   : 1.23109E-04  (-0.000123183   -0.000123183)
(R is the radius in km and D10 is the distance to the source in units of 10 kpc)
------------------------------------------------------------
#Fit statistic : Chi-Squared =          65.19 using 59 PHA bins.
# Reduced chi-squared =          1.144 for     57 degrees of freedom
# Null hypothesis probability =   2.132573e-01

Energy  Fluence     90% Error
[keV]   [erg/cm2]   [erg/cm2]
15- 25  2.609e-10   1.810e-10
25- 50  2.039e-09   1.277e-09
50-150  3.485e-08   2.292e-08
15-150  3.715e-08   2.236e-08
Thermal bremsstrahlung (OTTB)
Spectral model: thermal bremsstrahlung
------------------------------------------------------------
Parameters  : value         Lower 90%    Upper 90%
kT [keV]    : 199.339       (      )
Norm        : 1.40665       (-1.8798     1.4235)
------------------------------------------------------------
#Fit statistic : Chi-Squared =          66.64 using 59 PHA bins.
# Reduced chi-squared =          1.169 for     57 degrees of freedom
# Null hypothesis probability =   1.793141e-01

Energy  Fluence     90% Error
[keV]   [erg/cm2]   [erg/cm2]
15- 25  0.000e+00   0.000e+00
25- 50  0.000e+00   0.000e+00
50-150  0.000e+00   0.000e+00
15-150  0.000e+00   0.000e+00
Double BB

R1^2/D10^2  : 2.48188E-08        (      )
kT2 [keV]   : 198.343        (-198.348      -198.348)
R2^2/D10^2  : 1.24585E-04    (-8.09263e-05   0.260076)
------------------------------------------------------------
#Fit statistic : Chi-Squared =          65.31 using 59 PHA bins.
#Fit statistic : Chi-Squared =          65.28 using 59 PHA bins.
#Fit statistic : Chi-Squared =          65.19 using 59 PHA bins.
# Reduced chi-squared =          1.188 for     55 degrees of freedom
# Reduced chi-squared =          1.187 for     55 degrees of freedom
# Reduced chi-squared =          1.185 for     55 degrees of freedom
# Null hypothesis probability =   1.609484e-01
# Null hypothesis probability =   1.616532e-01
# Null hypothesis probability =   1.634601e-01

Energy  Fluence     90% Error
[keV]   [erg/cm2]   [erg/cm2]
15- 25  0.000e+00   0.000e+00
25- 50  0.000e+00   0.000e+00
50-150  0.000e+00   0.000e+00
15-150  0.000e+00   0.000e+00
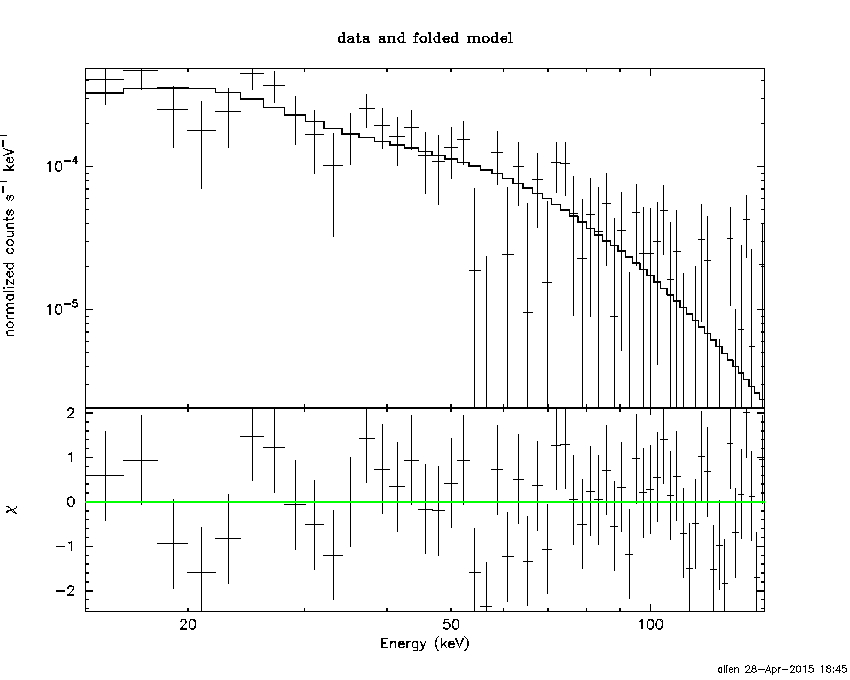
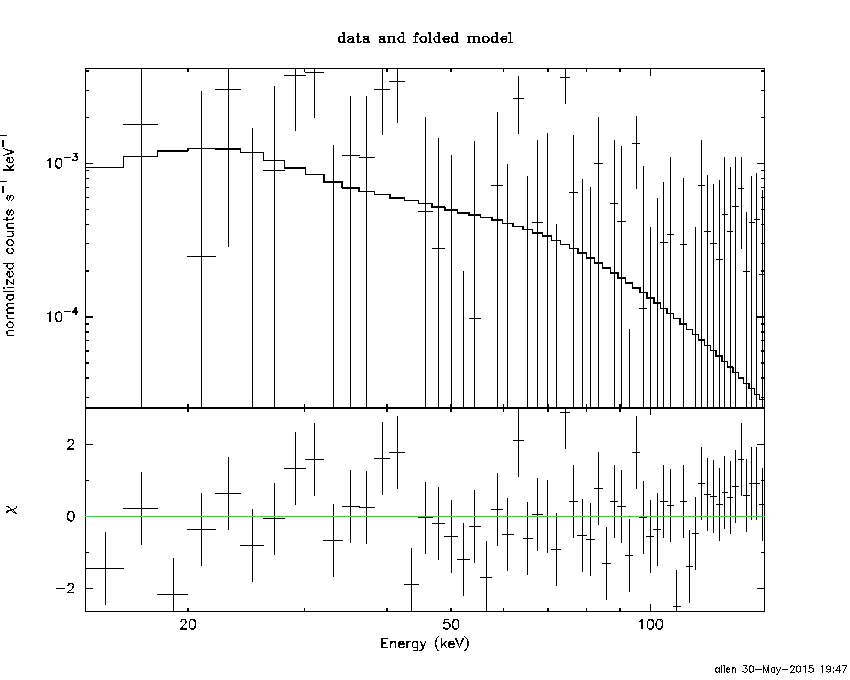
Pre-slew spectrum (Pre-slew PHA with pre-slew DRM)
Power-law model

Spectral model in power-law:
------------------------------------------------------------
Parameters  : value       lower 90%   higher 90%
Photon index: 2.07033     ( -0.333585   0.378468 )
Norm@50keV  : 4.82739E-04    ( -0.000127011   0.000122566 )
------------------------------------------------------------
#Fit statistic : Chi-Squared =          57.31 using 59 PHA bins.
# Reduced chi-squared =          1.005 for     57 degrees of freedom
# Null hypothesis probability =   4.636498e-01

Photon flux (15-150 keV)    in 68.02 sec: 7.48540E-02 ( -0.0136427  0.0136478 ) ph/cm2/s
Energy fluence (15-150 keV)             : 3.04264e-07 ( -7.04653e-08  7.43132e-08 ) ergs/cm2
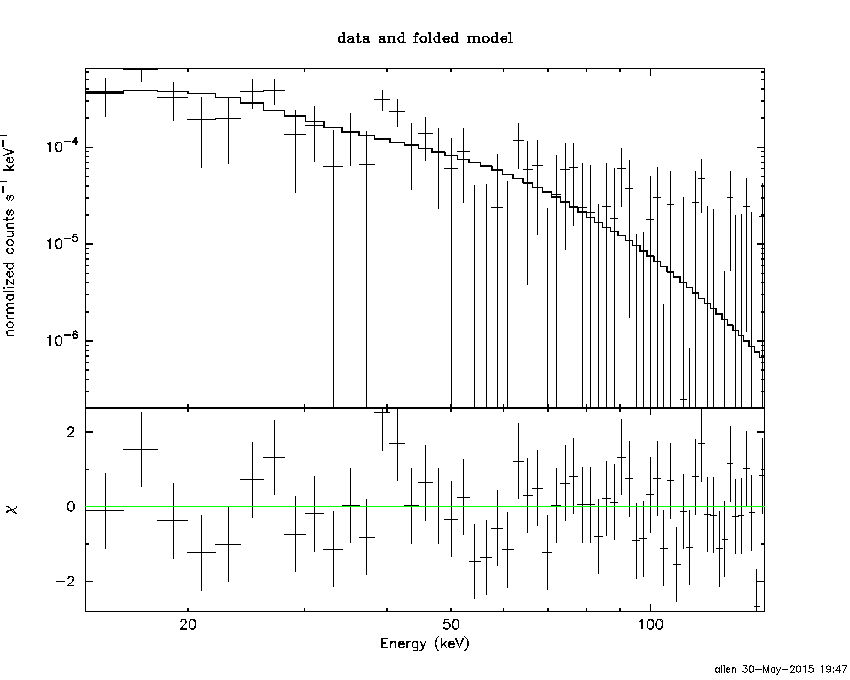
Cutoff power-law model

Spectral model in the cutoff power-law:
------------------------------------------------------------
Parameters  : value       lower 90%   higher 90%
Photon index: 1.15006     ( -2.20625   0.990989 )
Epeak [keV] : 36.0407      (   )
Norm@50keV  : 1.74101E-03    (     )
------------------------------------------------------------
#Fit statistic : Chi-Squared =          56.19 using 59 PHA bins.
# Reduced chi-squared =          1.003 for     56 degrees of freedom
# Null hypothesis probability =   4.679203e-01

Photon flux (15-150 keV)    in 68.02 sec: 7.30627E-02 ( -0.013778  0.013874 ) ph/cm2/s
Energy fluence (15-150 keV)             : 2.77793e-07 ( -7.05898e-08  8.42605e-08 ) ergs/cm2
Band function
Spectral model in the Band function:
------------------------------------------------------------
Parameters  : value       lower 90%   higher 90%
alpha       : -1.32829   ( -2.77941   2.42241 )
beta        : -9.37167    ( 9.37167   19.3717 )
Epeak [keV] : 36.5354      ( -23.5964 67.7624 )
Norm@50keV   : 1.33435E-03    ( -0.000727311   0 )
------------------------------------------------------------
#Fit statistic : Chi-Squared =          56.23 using 59 PHA bins.
# Reduced chi-squared =          1.022 for     55 degrees of freedom
# Null hypothesis probability =   4.286251e-01

Photon flux (15-150 keV)    in 68.02 sec:  (    ) ph/cm2/s
Energy fluence (15-150 keV)             : 0 ( 0  0 ) ergs/cm2
S(25-50 keV) vs. S(50-100 keV) plot
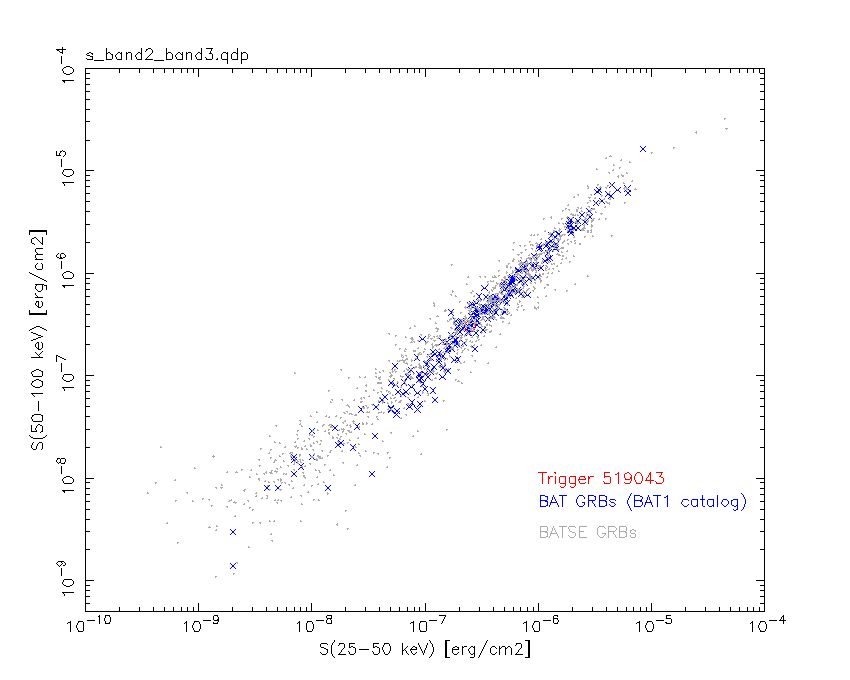
S(25-50 keV)  = 2.51e-07
S(50-100 keV) = 3.06e-07
T90 vs. Hardness ratio plot
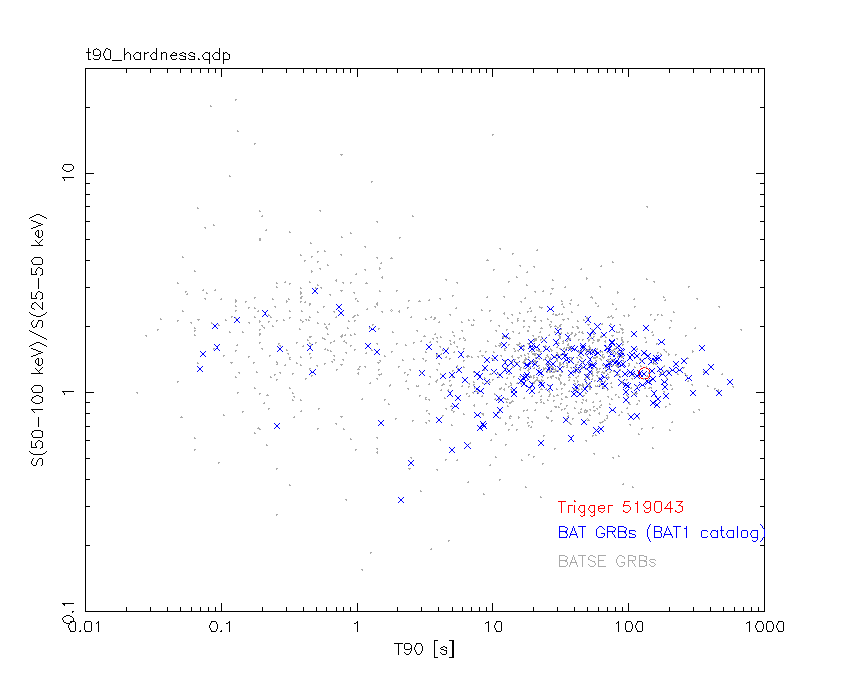
T90                                   = 130.271999955177 sec.
Hardness ratio (energy fluence ratio) = 1.21912
Color vs. Color plot
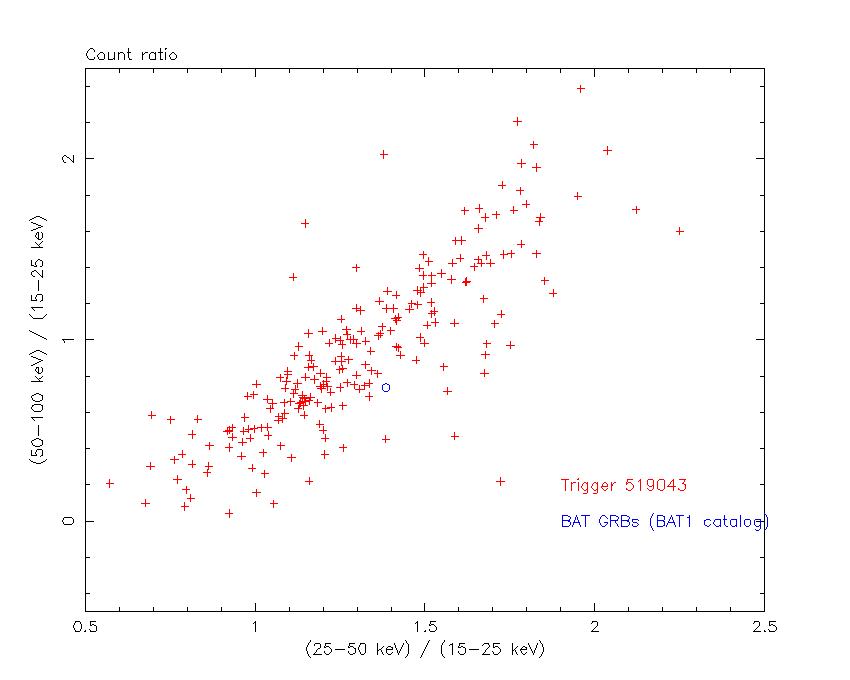
Count Ratio  (25-50 keV) / (15-25 keV) = 1.38538
Count Ratio (50-100 keV) / (15-25 keV) = 0.736948
Mask shadow pattern

IMX = -2.420806499027970E-02, IMY = -1.948067944755112E-02
TIME vs. PHA plot around the trigger time

Blue+Cyan dotted lines: Time interval of the scaled map
From 0.000000 to 64.000000
TIME vs. DetID plot around the trigger time

Blue+Cyan dotted lines: Time interval of the scaled map
From 0.000000 to 64.000000
100 us light curve (15-350 keV)
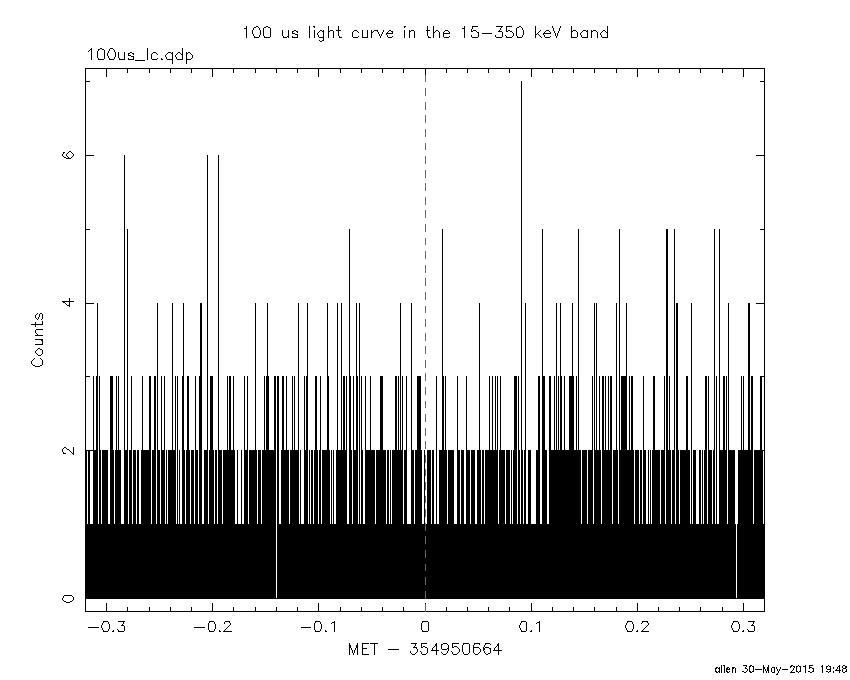
Blue+Cyan dotted lines: Time interval of the scaled map
From 0.000000 to 64.000000
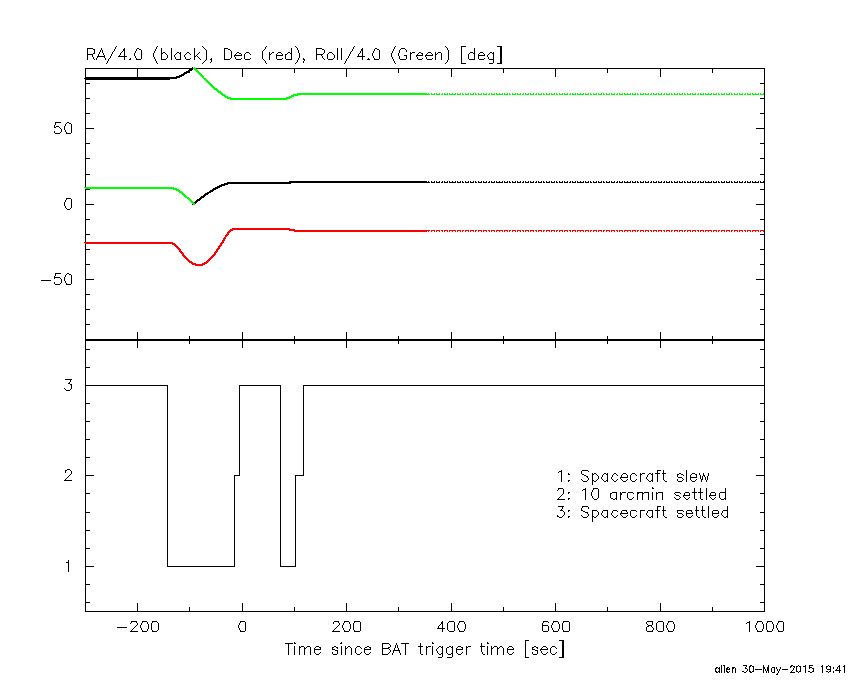
Spacecraft aspect plot
Bright source in the pre-burst/pre-slew/post-slew images
Pre-burst image of 15-350 keV band
Time interval of the image:
Pre-slew background subtracted image of 15-350 keV band
Time interval of the image:
-15.299400 52.716000

# RAcent  DECcent POSerr Theta    Phi  PeakCts   SNR AngSep     Name
#  [deg]    [deg]    ['] [deg]  [deg]                   [']
 83.6360  22.0039    0.9  46.1   26.7   2.7922  12.9    0.7	Crab
 58.0600 -17.6604    1.4   1.8  141.2   0.6702   8.4 ------	UNKNOWN
 40.0490  35.3535    2.3  54.0  -25.6   1.3322   5.1 ------	UNKNOWN
 26.8438  25.1421    2.9  50.7  -44.5   1.7078   4.0 ------	UNKNOWN
  9.0267 -29.3182    2.8  45.9 -123.8   1.5104   4.2 ------	UNKNOWN
Post-slew image of 15-350 keV band
Time interval of the image:
101.900600 963.155700

# RAcent  DECcent POSerr Theta    Phi  PeakCts   SNR AngSep     Name
#  [deg]    [deg]    ['] [deg]  [deg]                   [']
 83.6403  22.0256    0.4  46.9   12.2  32.6756  31.9    0.8	Crab
 98.8681 -20.8270    3.4  38.5   80.5   6.1195   3.4 ------	UNKNOWN
 68.4304  17.2293    2.5  36.3   -4.2   2.6854   4.7 ------	UNKNOWN
 60.8148  20.8883    3.0  38.6  -16.9   2.1749   3.8 ------	UNKNOWN
 19.7623 -19.6071    3.6  36.3 -120.3   2.8430   3.3 ------	UNKNOWN
358.7659 -37.8782    6.7  55.2 -145.3   7.0097   1.8 ------	UNKNOWN
 38.7043  31.0011    3.0  52.1  -42.2  10.3020   3.9 ------	UNKNOWN
  6.5258 -25.2263    2.5  48.3 -129.4   9.2561   4.5 ------	UNKNOWN
Plot creation:
Sat May 30 19:48:29 EDT 2015