Click here for the BAT GCN circular template
Image
Pre-slew 15-350 keV image (Event data; bkg subtracted)

#   RAcent  DECcent POSerr  Theta    Phi     Peak Cts     SNR  Name
  314.3622 +19.2961 0.0393   32.0 -112.1       0.1212     4.9  TRIG_00519207
------------------------------------------

Foreground time interval of the image:
  0.000   2.048 (delta_t =   2.048 [sec])
Background time interval of the image:
-120.743 -10.944 (delta_t = 109.799 [sec])
Lightcurves
Notes:
- 1) All plots contain as much data as has been downloaded to date.
- 2) The mask-weighted light curves are using the flight position.
- 3) Multiple plots of different time binning/intervals are shown to cover all scenarios of short/long GRBs, rate/image triggers, and real/false positives.
- 4) For all the mask-weighted lightcurves, the y-axis units are counts/sec/det where a det is 0.4 x 0.4 = 0.16 sq cm.
- 5) The verticle lines correspond to following: green dotted lines are T50 interval, black dotted lines are T90 interval, blue solid line(s) is a spacecraft slew start time, and orange solid line(s) is a spacecraft slew end time.
- 6) Time of each bin is in the middle of the bin.
1 s binning
From T0-310 s to T0+310 s

From T100_start - 20 s to T100_end + 30 s

Full time interval

64 ms binning
Full time interval

From T100_start to T100_end

From T0-5 sec to T0+5 sec

16 ms binning
From T100_start-5 s to T100_start+5 s

Blue+Cyan dotted lines: Time interval of the scaled map
From 0.000000 to 2.048000
8 ms binning
From T100_start-3 s to T100_start+3 s

Blue+Cyan dotted lines: Time interval of the scaled map
From 0.000000 to 2.048000
2 ms binning
From T100_start-1 s to T100_start+1 s

Blue+Cyan dotted lines: Time interval of the scaled map
From 0.000000 to 2.048000
SN=5 or 10 sec. binning (whichever binning is satisfied first)

SN=5 or 10 sec. binning (T < 200 sec)

Flight mask-tagged light curves
Caution: Mask-weight map is always using the same on-axis map


Quad-rate summed light curves (from T0-300 to T0+1000)

The mask-weighted light curves based on cleaned DPHs

Spectra
Notes:
- 1) The fitting includes the systematic errors.
- 2) For long bursts, a spectral fit of the pre-slew DRM will introduce some errors in both a spectral shape and a normalization if the PHA file contains a lot of the slew/post-slew time interval.
- 3) For fits to more complicated models (e.g. a power-law over a cutoff power-law), the BAT team has decided to require a chi-square improvement of more than 6 for each extra dof.
- 4) For short bursts (T90<1sec), the specrtum is also fit with Blackbody, OTTB, and Double Blackbody.
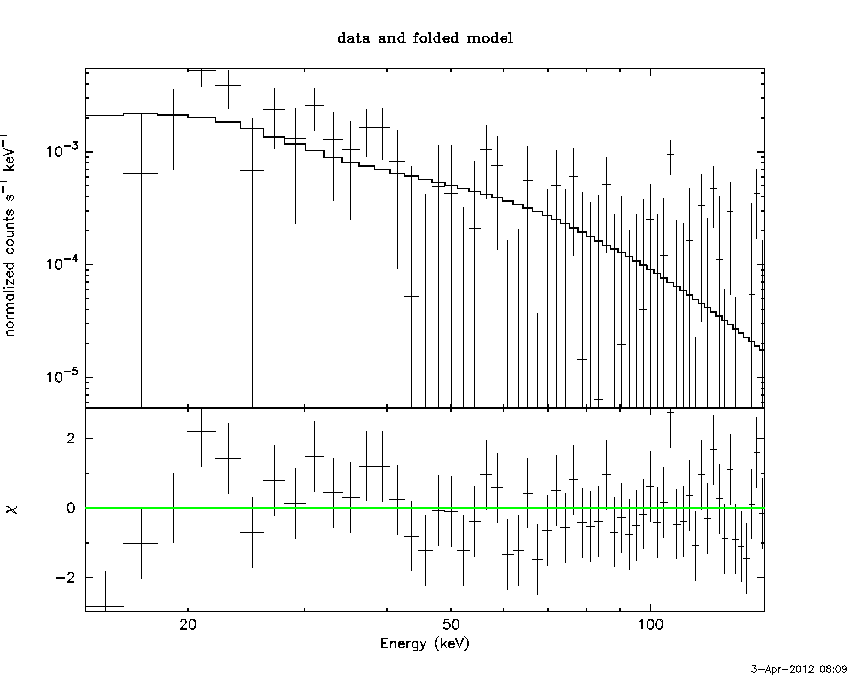
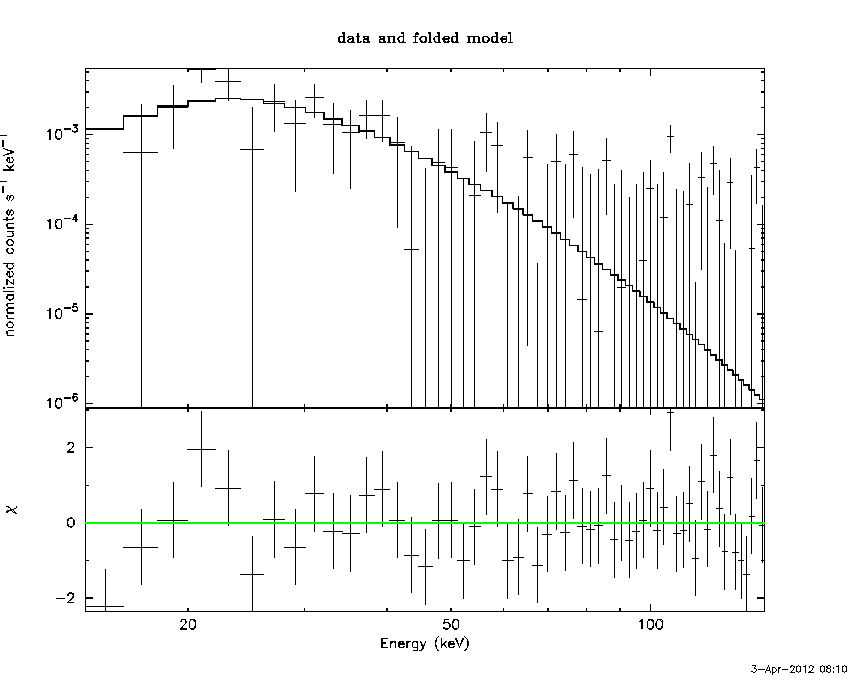
Time averaged spectrum fit using the pre-slew DRM
Power-law model

Time interval is from    0.000 sec. to    2.048 sec.

Spectral model in power-law:
------------------------------------------------------------
Parameters  : value       lower 90%   higher 90%
Photon index: 1.91684     ( -0.499018   0.533794 )
Norm@50keV  : 3.43416E-03    ( -0.00127284   0.00125075 )
------------------------------------------------------------
# Chi-Squared =          59.87 using 59 PHA bins.
# Reduced chi-squared =          1.050 for     57 degrees of freedom
# Null hypothesis probability =   3.721041e-01

Photon flux (15-150 keV)    in 2.048 sec: 0.496433 ( -0.156833  0.157142 ) ph/cm2/s
Energy fluence (15-150 keV)             : 6.4639e-08 ( -2.2759e-08  2.4072e-08 ) ergs/cm2
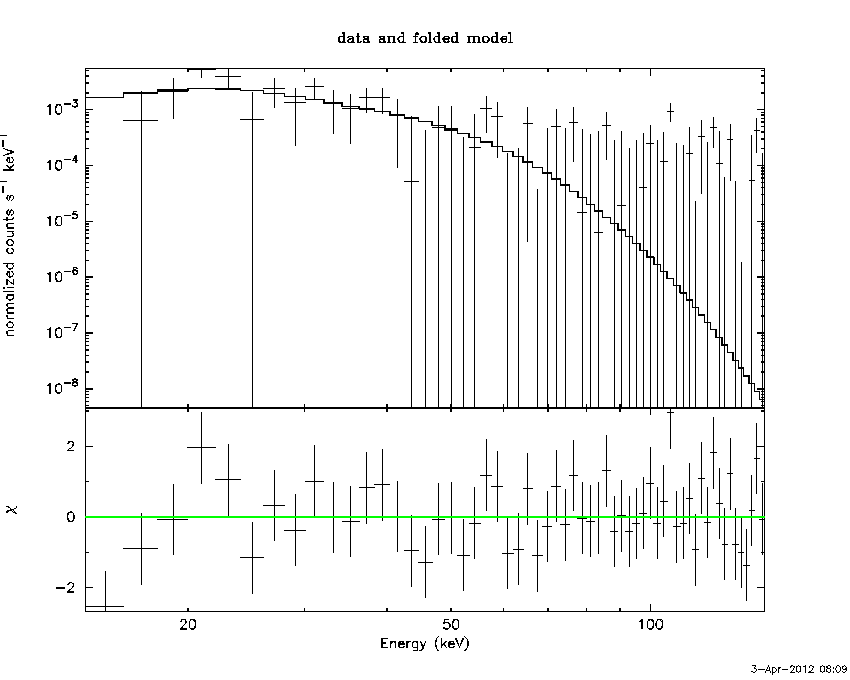
Cutoff power-law model

Time interval is from    0.000 sec. to    2.048 sec.
Spectral model in the cutoff power-law:
------------------------------------------------------------
Parameters  : value       lower 90%   higher 90%
Photon index: -7.79432     (     )
Epeak [keV] : 30.2983      ( -4.35833 5.98734 )
Norm@50keV  : 1.61342E+04    (     )
------------------------------------------------------------
# Chi-Squared =          51.81 using 59 PHA bins.
# Reduced chi-squared =         0.9253 for     56 degrees of freedom
# Null hypothesis probability =   6.339420e-01

Photon flux (15-150 keV)    in 2.048 sec: 0.463741 ( -0.137031  0.143022 ) ph/cm2/s
Energy fluence (15-150 keV)             : 4.30842e-08 ( -1.28166e-08  1.44763e-08 ) ergs/cm2
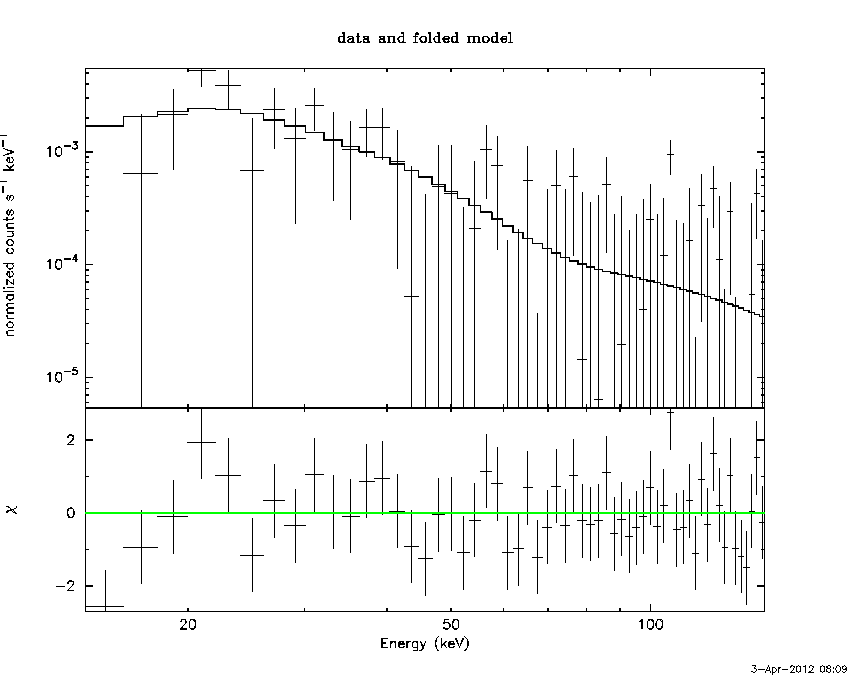
Band function

Time interval is from    0.000 sec. to    2.048 sec.

Spectral model in the Band function:
------------------------------------------------------------
Parameters  : value       lower 90%   higher 90%
alpha       : 4.99982   ( -10483.1   -10468.1 )
beta        : -4.14741    ( 4.16171   1.97486 )
Epeak [keV] : 30.7016      ( -6.75632 5.70786 )
Norm@50keV   : 198.882    ( -197.808   723.997 )
------------------------------------------------------------
# Chi-Squared =          51.67 using 59 PHA bins.
# Reduced chi-squared =         0.9395 for     55 degrees of freedom
# Null hypothesis probability =   6.024958e-01

Photon flux (15-150 keV)    in 2.048 sec:  (    ) ph/cm2/s
Energy fluence (15-150 keV)             : 0 ( 0  0 ) ergs/cm2
Single BB

Spectral model blackbody:
------------------------------------------------------------
Parameters  : value    Lower 90%  Upper 90%
kT [keV]    : 8.27935  (-1.74845  2.47612)
R^2/D10^2   : 0.546363  (-0.546365   0.86451)
(R is the radius in km and D10 is the distance to the source in units of 10 kpc)
------------------------------------------------------------
# Chi-Squared =          54.40 using 59 PHA bins.
# Reduced chi-squared =         0.9544 for     57 degrees of freedom
# Null hypothesis probability =   5.731084e-01

Energy  Fluence     90% Error
[keV]   [erg/cm2]   [erg/cm2]
15- 25  1.421e-08   8.471e-09
25- 50  2.638e-08   1.474e-08
50-150  7.744e-09   6.191e-09
15-150  4.833e-08   2.891e-08
Thermal bremsstrahlung (OTTB)

Spectral model: thermal bremsstrahlung
------------------------------------------------------------
Parameters  : value         Lower 90%    Upper 90%
kT [keV]    : 57.1247       (-30.0204      -57.1263)
Norm        : 2.75628       (-1.13176     1.86425)
------------------------------------------------------------
# Chi-Squared =          58.36 using 59 PHA bins.
# Reduced chi-squared =          1.024 for     57 degrees of freedom
# Null hypothesis probability =   4.252011e-01

Energy  Fluence     90% Error
[keV]   [erg/cm2]   [erg/cm2]
15- 25  1.407e-08   7.847e-09
25- 50  2.108e-08   1.272e-08
50-150  2.302e-08   1.822e-08
15-150  5.817e-08   3.808e-08
Double BB

------------------------------------------------------------
Parameters  : value         Lower 90%    Upper 90%
kT1 [keV]   : 199.984        (      )
R1^2/D10^2  : 3.23844E-05        (-3.24065e-05      4.73891e-05)
kT2 [keV]   : 7.91251        (-1.67816      2.33353)
R2^2/D10^2  : 0.628056    (-0.411129   1.00529)
------------------------------------------------------------
# Chi-Squared =          54.40 using 59 PHA bins.
# Chi-Squared =          53.16 using 59 PHA bins.
# Reduced chi-squared =         0.9892 for     55 degrees of freedom
# Reduced chi-squared =         0.9666 for     55 degrees of freedom
# Null hypothesis probability =   4.973256e-01
# Null hypothesis probability =   5.451585e-01

Energy  Fluence     90% Error
[keV]   [erg/cm2]   [erg/cm2]
15- 25  1.419e-08   7.806e-03
25- 50  2.639e-08   6.506e-02
50-150  7.791e-09   1.713e+00
15-150  4.837e-08   1.805e+00
Peak spectrum fit
Power-law model
Time interval is from    0.000 sec. to    2.048 sec.

Spectral model in power-law:
------------------------------------------------------------
Parameters  : value       lower 90%   higher 90%
Photon index: 1.91684     ( -0.499018   0.533794 )
Norm@50keV  : 3.43416E-03    ( -0.00127284   0.00125075 )
------------------------------------------------------------
# Chi-Squared =          59.87 using 59 PHA bins.
# Reduced chi-squared =          1.050 for     57 degrees of freedom
# Null hypothesis probability =   3.721041e-01

Photon flux (15-150 keV)    in 2.048 sec: 0.496433 ( -0.156833  0.157142 ) ph/cm2/s
Energy fluence (15-150 keV)             : 6.4639e-08 ( -2.2759e-08  2.4072e-08 ) ergs/cm2
Cutoff power-law model

Time interval is from    0.000 sec. to    2.048 sec.
Spectral model in the cutoff power-law:
------------------------------------------------------------
Parameters  : value       lower 90%   higher 90%
Photon index: -7.79432     (     )
Epeak [keV] : 30.2983      ( -4.35833 5.98734 )
Norm@50keV  : 1.61342E+04    (     )
------------------------------------------------------------
# Chi-Squared =          51.81 using 59 PHA bins.
# Reduced chi-squared =         0.9253 for     56 degrees of freedom
# Null hypothesis probability =   6.339420e-01

Photon flux (15-150 keV)    in 2.048 sec: 0.463741 ( -0.137031  0.143022 ) ph/cm2/s
Energy fluence (15-150 keV)             : 4.30842e-08 ( -1.28166e-08  1.44763e-08 ) ergs/cm2
Band function

Time interval is from    0.000 sec. to    2.048 sec.

Spectral model in the Band function:
------------------------------------------------------------
Parameters  : value       lower 90%   higher 90%
alpha       : 4.99982   ( -10483.1   -10468.1 )
beta        : -4.14741    ( 4.16171   1.97486 )
Epeak [keV] : 30.7016      ( -6.75632 5.70786 )
Norm@50keV   : 198.882    ( -197.808   723.997 )
------------------------------------------------------------
# Chi-Squared =          51.67 using 59 PHA bins.
# Reduced chi-squared =         0.9395 for     55 degrees of freedom
# Null hypothesis probability =   6.024958e-01

Photon flux (15-150 keV)    in 2.048 sec:  (    ) ph/cm2/s
Energy fluence (15-150 keV)             : 0 ( 0  0 ) ergs/cm2
Single BB
Spectral model blackbody:
------------------------------------------------------------
Parameters  : value    Lower 90%  Upper 90%
kT [keV]    : 8.27935  (-1.74845  2.47612)
R^2/D10^2   : 0.546363  (-0.546365   0.86451)
(R is the radius in km and D10 is the distance to the source in units of 10 kpc)
------------------------------------------------------------
# Chi-Squared =          54.40 using 59 PHA bins.
# Reduced chi-squared =         0.9544 for     57 degrees of freedom
# Null hypothesis probability =   5.731084e-01

Energy  Fluence     90% Error
[keV]   [erg/cm2]   [erg/cm2]
15- 25  1.421e-08   8.333e-09
25- 50  2.638e-08   1.616e-08
50-150  7.744e-09   5.843e-09
15-150  4.833e-08   3.033e-08
Thermal bremsstrahlung (OTTB)

Spectral model: thermal bremsstrahlung
------------------------------------------------------------
Parameters  : value         Lower 90%    Upper 90%
kT [keV]    : 57.1247       (-30.0204      -57.1263)
Norm        : 2.75628       (-1.13176     1.86425)
------------------------------------------------------------
# Chi-Squared =          58.36 using 59 PHA bins.
# Reduced chi-squared =          1.024 for     57 degrees of freedom
# Null hypothesis probability =   4.252011e-01

Energy  Fluence     90% Error
[keV]   [erg/cm2]   [erg/cm2]
15- 25  1.407e-08   8.501e-09
25- 50  2.108e-08   1.309e-08
50-150  2.302e-08   1.825e-08
15-150  5.817e-08   3.588e-08
Double BB
------------------------------------------------------------
Parameters  : value         Lower 90%    Upper 90%
kT1 [keV]   : 199.984        (      )
R1^2/D10^2  : 3.23844E-05        (-3.24065e-05      4.73891e-05)
kT2 [keV]   : 7.91251        (-1.67816      2.33353)
R2^2/D10^2  : 0.628056    (-0.411129   1.00529)
------------------------------------------------------------
# Chi-Squared =          54.40 using 59 PHA bins.
# Chi-Squared =          53.16 using 59 PHA bins.
# Reduced chi-squared =         0.9892 for     55 degrees of freedom
# Reduced chi-squared =         0.9666 for     55 degrees of freedom
# Null hypothesis probability =   4.973256e-01
# Null hypothesis probability =   5.451585e-01

Energy  Fluence     90% Error
[keV]   [erg/cm2]   [erg/cm2]
15- 25  1.419e-08   7.627e-03
25- 50  2.639e-08   6.835e-02
50-150  7.791e-09   1.592e+00
15-150  4.837e-08   1.519e+00
Pre-slew spectrum (Pre-slew PHA with pre-slew DRM)
Power-law model

Spectral model in power-law:
------------------------------------------------------------
Parameters  : value       lower 90%   higher 90%
Photon index: 1.91684     ( -0.499018   0.533794 )
Norm@50keV  : 3.43416E-03    ( -0.00127284   0.00125075 )
------------------------------------------------------------
# Chi-Squared =          59.87 using 59 PHA bins.
# Reduced chi-squared =          1.050 for     57 degrees of freedom
# Null hypothesis probability =   3.721041e-01

Photon flux (15-150 keV)    in 2.048 sec: 0.496433 ( -0.156833  0.157142 ) ph/cm2/s
Energy fluence (15-150 keV)             : 6.4639e-08 ( -2.2759e-08  2.4072e-08 ) ergs/cm2
Cutoff power-law model
Spectral model in the cutoff power-law:
------------------------------------------------------------
Parameters  : value       lower 90%   higher 90%
Photon index: -7.79432     (     )
Epeak [keV] : 30.2983      ( -4.35833 5.98734 )
Norm@50keV  : 1.61342E+04    (     )
------------------------------------------------------------
# Chi-Squared =          51.81 using 59 PHA bins.
# Reduced chi-squared =         0.9253 for     56 degrees of freedom
# Null hypothesis probability =   6.339420e-01

Photon flux (15-150 keV)    in 2.048 sec: 0.463741 ( -0.137031  0.143022 ) ph/cm2/s
Energy fluence (15-150 keV)             : 4.30842e-08 ( -1.28166e-08  1.44763e-08 ) ergs/cm2
Band function
Spectral model in the Band function:
------------------------------------------------------------
Parameters  : value       lower 90%   higher 90%
alpha       : 4.99982   ( -10483.1   -10468.1 )
beta        : -4.14741    ( 4.16171   1.97486 )
Epeak [keV] : 30.7016      ( -6.75632 5.70786 )
Norm@50keV   : 198.882    ( -197.808   723.997 )
------------------------------------------------------------
# Chi-Squared =          51.67 using 59 PHA bins.
# Reduced chi-squared =         0.9395 for     55 degrees of freedom
# Null hypothesis probability =   6.024958e-01

Photon flux (15-150 keV)    in 2.048 sec:  (    ) ph/cm2/s
Energy fluence (15-150 keV)             : 0 ( 0  0 ) ergs/cm2
S(25-50 keV) vs. S(50-100 keV) plot

S(25-50 keV)  = 1.89713e-08
S(50-100 keV) = 2.00766e-08
T90 vs. Hardness ratio plot

T90                                   = 2.04799997806549 sec.
Hardness ratio (energy fluence ratio) = 1.05826
Color vs. Color plot

Count Ratio  (25-50 keV) / (15-25 keV) = 1.15304
Count Ratio (50-100 keV) / (15-25 keV) = 0.251686
Mask shadow pattern

IMX = -2.357680772984377E-01, IMY = 5.796907805786634E-01
TIME vs. PHA plot around the trigger time

Blue+Cyan dotted lines: Time interval of the scaled map
From 0.000000 to 2.048000
TIME vs. DetID plot around the trigger time

Blue+Cyan dotted lines: Time interval of the scaled map
From 0.000000 to 2.048000
100 us light curve (15-350 keV)

Blue+Cyan dotted lines: Time interval of the scaled map
From 0.000000 to 2.048000
Spacecraft aspect plot

Bright source in the pre-burst/pre-slew/post-slew images
Pre-burst image of 15-350 keV band
Time interval of the image:
-120.743400 -10.944000

# RAcent  DECcent POSerr Theta    Phi  PeakCts   SNR AngSep     Name
#  [deg]    [deg]    ['] [deg]  [deg]                   [']
254.3877  35.2841   11.8  46.6  157.0   0.3049   1.0    4.9	Her X-1
262.8124 -24.6277    0.0  35.0   57.4   0.1416   0.6   12.8	GX 1+4
268.4005  -1.5905    3.7  19.6   98.9   0.4338   3.1    8.5	SW J1753.5-0127
270.1540 -25.0097    7.5  30.8   47.8   0.2810   1.5    8.2	GX 5-1
270.3619 -25.8440    6.3  31.3   46.6   0.3352   1.8    6.9	GRS 1758-258
274.0880 -14.0809    3.5  20.0   57.7   0.4204   3.3    5.5	GX 17+2
275.9446 -30.3634    3.5  32.9   34.4   0.5884   3.3    1.0	H1820-303
285.0075 -24.9065   16.1  25.6   21.2   0.0925   0.7    1.8	HT1900.1-2455
288.7989  10.9149    0.9  10.4 -159.5   1.5047  12.5    1.8	GRS 1915+105
299.5786  35.2167    1.0  36.3 -148.4   1.9965  11.5    1.1	Cyg X-1
308.0378  40.9353    2.3  44.3 -142.8   1.3308   5.0    3.4	Cyg X-3
262.9056 -33.8253    9.3  41.6   47.1  -0.4197  -1.2    4.2	GX 354-0
260.0611  25.2729    2.7  36.5  150.1   0.8953   4.3 ------	UNKNOWN
262.7258  35.1045    2.8  41.7  163.8   0.9112   4.1 ------	UNKNOWN
262.4036  53.4410    2.4  56.9  177.5   3.5120   4.9 ------	UNKNOWN
335.4139 -31.4724    2.4  55.2  -34.8   3.4517   4.8 ------	UNKNOWN
Pre-slew background subtracted image of 15-350 keV band
Time interval of the image:
0.000000 2.048000

# RAcent  DECcent POSerr Theta    Phi  PeakCts   SNR AngSep     Name
#  [deg]    [deg]    ['] [deg]  [deg]                   [']
254.3417  35.2722    4.5  46.6  157.0  -0.1068  -2.6    7.1	Her X-1
262.9720 -24.6163   37.6  34.8   57.3  -0.0094  -0.3    8.0	GX 1+4
268.4739  -1.4250   31.2  19.5   99.4   0.0064   0.4    6.6	SW J1753.5-0127
270.4659 -25.1447    4.9  30.7   47.2  -0.0521  -2.3   10.6	GX 5-1
270.2430 -25.7042    6.9  31.3   46.9  -0.0374  -1.7    4.0	GRS 1758-258
273.9672 -14.0515   10.4  20.1   58.0   0.0189   1.1    2.4	GX 17+2
276.0323 -30.2106  132.7  32.8   34.3   0.0020   0.1   10.9	H1820-303
285.1755 -25.0438    4.2  25.7   20.8  -0.0442  -2.7   10.6	HT1900.1-2455
288.7416  11.0856   11.2  10.6 -159.9   0.0151   1.0    9.0	GRS 1915+105
299.5996  35.1765    1.1  36.3 -148.4   0.2113  10.4    1.6	Cyg X-1
307.9922  40.8184    0.0  44.2 -142.8  -0.0673  -2.2    9.7	Cyg X-3
263.0915 -33.8922    7.8  41.6   46.9  -0.0637  -1.5    6.2	GX 354-0
268.9880  -8.2418    2.5  20.8   79.8   0.0842   4.6 ------	UNKNOWN
314.3622  19.2963    2.4  32.0 -112.1   0.1212   4.9 ------	UNKNOWN
Post-slew image of 15-350 keV band
Time interval of the image:
89.556600 962.149800

# RAcent  DECcent POSerr Theta    Phi  PeakCts   SNR AngSep     Name
#  [deg]    [deg]    ['] [deg]  [deg]                   [']
288.8060  10.9539    0.6  25.9   69.5  12.3130  19.3    0.7	GRS 1915+105
299.5912  35.1894    0.4  20.6  138.3  16.8350  30.5    0.7	Cyg X-1
308.1322  40.9533    0.8  22.3  162.1   7.2031  14.5    1.0	Cyg X-3
326.0500  38.3120    2.4  21.6 -159.8   2.5182   4.8    5.8	Cyg X-2
289.5588 -13.6681    3.0  41.0   32.8   3.5487   3.9 ------	UNKNOWN
 10.1532  48.3516    2.9  53.2 -142.2  12.7722   4.0 ------	UNKNOWN
345.1614 -23.1202    4.0  52.0  -42.3   9.8953   2.9 ------	UNKNOWN
  5.5290  37.3639    3.4  47.9 -128.9   8.4580   3.4 ------	UNKNOWN
Plot creation:
Tue Apr  3 08:10:49 EDT 2012