Special notes of this burst
Image
Pre-slew 15.0-350.0 keV image (Event data)
#   RAcent    DECcent   POSerr    Theta     Phi              Peak Cts       SNR   Name
   42.4667    40.4973   0.0212    33.2924   -48.6642         0.1754886      9.063 TRIG_00519211

Foreground time interval of the image:
 -0.052   1.540 (delta_t =   1.592 [sec])
Background time interval of the image:
-161.947  -0.052 (delta_t = 161.895 [sec])
Lightcurves
Notes:
- 1) The mask-weighted light curves are using the flight position.
- 2) Multiple plots of different time binning/intervals are shown to cover all scenarios of short/long GRBs, rate/image triggers, and real/false positives.
- 3) For all the mask-weighted lightcurves, the y-axis units are counts/sec/det where a det is 0.4 x 0.4 = 0.16 sq cm.
- 4) The verticle lines correspond to following: green dotted lines are T50 interval, black dotted lines are T90 interval, blue solid line(s) is a spacecraft slew start time, and orange solid line(s) is a spacecraft slew end time.
- 5) Time of each bin is in the middle of the bin.
1 s binning
From T0-310 s to T0+310 s
From T100_start - 20 s to T100_end + 30 s
Full time interval
64 ms binning
Full time interval
From T100_start to T100_end
From T0-5 sec to T0+5 sec
16 ms binning
From T100_start-5 s to T100_start+5 s
Blue+Cyan dotted lines: Time interval of the scaled map
From 0.000000 to 1.024000
8 ms binning
From T100_start-3 s to T100_start+3 s
Blue+Cyan dotted lines: Time interval of the scaled map
From 0.000000 to 1.024000
2 ms binning
From T100_start-1 s to T100_start+1 s
Blue+Cyan dotted lines: Time interval of the scaled map
From 0.000000 to 1.024000
SN=5 or 10 sec. binning (whichever binning is satisfied first)
SN=5 or 10 sec. binning (T < 200 sec)
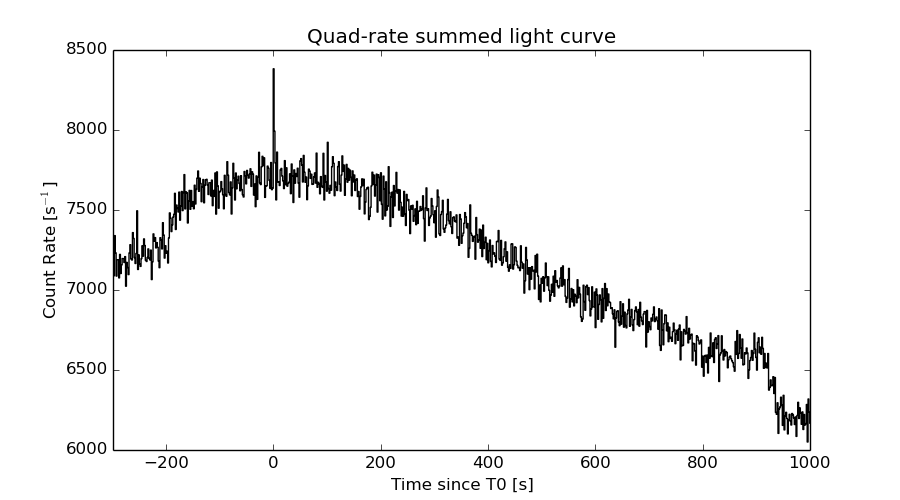
Quad-rate summed light curves (from T0-300s to T0+1000s)
Spectral Evolution

Spectra
Notes:
- 1) The fitting includes the systematic errors.
- 2) When the burst includes telescope slew time periods, the fitting uses an average response file made from multiple 5-s response files through out the slew time plus single time preiod for the non-slew times, and weighted by the total counts in the corresponding time period using addrmf. An average response file is needed becuase a spectral fit using the pre-slew DRM will introduce some errors in both a spectral shape and a normalization if the PHA file contains a lot of the slew/post-slew time interval.
- 3) For fits to more complicated models (e.g. a power-law over a cutoff power-law), the BAT team has decided to require a chi-square improvement of more than 6 for each extra dof.
Time averaged spectrum fit using the average DRM
Power-law model
Time interval is from   -0.052 sec. to    1.540 sec.

Spectral model in power-law:
------------------------------------------------------------
Parameters  : value       lower 90%   higher 90%
Photon index: 1.59253     ( -0.281868   0.290615 )
Norm@50keV  : 7.18894E-03    ( -0.001347   0.00133021 )
------------------------------------------------------------
#Fit statistic : Chi-Squared =          49.36 using 59 PHA bins.
# Reduced chi-squared =         0.8660 for     57 degrees of freedom
# Null hypothesis probability =   7.539888e-01

Photon flux (15-150 keV)    in 1.592 sec: 0.921679 ( -0.164343  0.164599 ) ph/cm2/s
Energy fluence (15-150 keV)             : 1.07133e-07 ( -2.11886e-08  2.15885e-08 ) ergs/cm2
Cutoff power-law model

Time interval is from   -0.052 sec. to    1.540 sec.
Spectral model in the cutoff power-law:
------------------------------------------------------------
Parameters  : value       lower 90%   higher 90%
Photon index: 0.419713     ( -1.51591   1.09075 )
Epeak [keV] : 64.8509      ( -17.6052 247.121 )
Norm@50keV  : 2.94530E-02    ( -0.0294542   0.145485 )
------------------------------------------------------------
#Fit statistic : Chi-Squared =          46.19 using 59 PHA bins.
# Reduced chi-squared =         0.8249 for     56 degrees of freedom
# Null hypothesis probability =   8.220177e-01

Photon flux (15-150 keV)    in 1.592 sec: 0.889198 ( -0.16509  0.167622 ) ph/cm2/s
Energy fluence (15-150 keV)             : 9.96896e-08 ( -2.16915e-08  2.26967e-08 ) ergs/cm2
Band function

Time interval is from   -0.052 sec. to    1.540 sec.

Spectral model in the Band function:
------------------------------------------------------------
Parameters  : value       lower 90%   higher 90%
alpha       : -0.418581   ( -1.29677   1.40744 )
beta        : -10.0000    ( 10   7.10543e-15 )
Epeak [keV] : 64.8179      ( -17.5849 252.25 )
Norm@50keV   : 2.94960E-02    ( -0.029496   0.145237 )
------------------------------------------------------------
#Fit statistic : Chi-Squared =          46.19 using 59 PHA bins.
# Reduced chi-squared =         0.8399 for     55 degrees of freedom
# Null hypothesis probability =   7.952463e-01

Photon flux (15-150 keV)    in 1.592 sec:  (    ) ph/cm2/s
Energy fluence (15-150 keV)             : 9.97487e-08 ( -9.97375e-08  -2.17967e-08 ) ergs/cm2
Single BB
Spectral model blackbody:
------------------------------------------------------------
Parameters  : value    Lower 90%  Upper 90%
kT [keV]    : 14.1464  (-2.7194  3.306)
R^2/D10^2   : 0.132159  (-0.069914   0.150192)
(R is the radius in km and D10 is the distance to the source in units of 10 kpc)
------------------------------------------------------------
#Fit statistic : Chi-Squared =          50.20 using 59 PHA bins.
# Reduced chi-squared =         0.8808 for     57 degrees of freedom
# Null hypothesis probability =   7.259662e-01

Energy  Fluence     90% Error
[keV]   [erg/cm2]   [erg/cm2]
15- 25  8.885e-09   3.344e-09
25- 50  3.339e-08   9.035e-09
50-150  4.423e-08   1.740e-08
15-150  8.650e-08   2.226e-08
Thermal bremsstrahlung (OTTB)
Spectral model: thermal bremsstrahlung
------------------------------------------------------------
Parameters  : value         Lower 90%    Upper 90%
kT [keV]    : 164.479       (-84.4136      -162.718)
Norm        : 3.83415       (-0.699798     0.915281)
------------------------------------------------------------
#Fit statistic : Chi-Squared =          47.65 using 59 PHA bins.
# Reduced chi-squared =         0.8360 for     57 degrees of freedom
# Null hypothesis probability =   8.064885e-01

Energy  Fluence     90% Error
[keV]   [erg/cm2]   [erg/cm2]
15- 25  1.554e-08   8.668e-09
25- 50  2.919e-08   1.611e-08
50-150  5.977e-08   3.532e-08
15-150  1.045e-07   5.886e-08
Double BB
Spectral model: bbodyrad<1> + bbodyrad<2>
------------------------------------------------------------
Parameters  : value         Lower 90%    Upper 90%
kT1 [keV]   : 6.18916        (-3.19829      20.7509)
R1^2/D10^2  : 1.21154        (-1.02905      17.966)
kT2 [keV]   : 19.3972        (-5.47447      18.4747)
R2^2/D10^2  : 3.43845E-02    (-0.0321244   0.0659169)
------------------------------------------------------------
#Fit statistic : Chi-Squared =          45.44 using 59 PHA bins.
# Reduced chi-squared =         0.8261 for     55 degrees of freedom
# Null hypothesis probability =   8.176194e-01

Energy  Fluence     90% Error
[keV]   [erg/cm2]   [erg/cm2]
15- 25  1.427e-08   8.302e-09
25- 50  3.053e-08   1.592e-08
50-150  5.555e-08   3.284e-08
15-150  1.004e-07   5.289e-08
Peak spectrum fit
Power-law model
Time interval is from    0.040 sec. to    1.040 sec.

Spectral model in power-law:
------------------------------------------------------------
Parameters  : value       lower 90%   higher 90%
Photon index: 1.73465     ( -0.310635   0.331947 )
Norm@50keV  : 8.12913E-03    ( -0.00177255   0.00173078 )
------------------------------------------------------------
#Fit statistic : Chi-Squared =          51.86 using 59 PHA bins.
# Reduced chi-squared =         0.9099 for     57 degrees of freedom
# Null hypothesis probability =   6.676295e-01

Photon flux (15-150 keV)    in 1 sec: 1.09304 ( -0.211573  0.211703 ) ph/cm2/s
Energy fluence (15-150 keV)             : 7.50827e-08 ( -1.66108e-08  1.70531e-08 ) ergs/cm2
Cutoff power-law model
Time interval is from    0.040 sec. to    1.040 sec.
Spectral model in the cutoff power-law:
------------------------------------------------------------
Parameters  : value       lower 90%   higher 90%
Photon index: 0.724554     ( -1.46751   1.11493 )
Epeak [keV] : 59.3033      ( -15.9939 -59.371 )
Norm@50keV  : 2.81938E-02    ( -0.0280599   0.142187 )
------------------------------------------------------------
#Fit statistic : Chi-Squared =          49.49 using 59 PHA bins.
# Reduced chi-squared =         0.8837 for     56 degrees of freedom
# Null hypothesis probability =   7.181007e-01

Photon flux (15-150 keV)    in 1 sec: 1.06380 ( -0.212692  0.21359 ) ph/cm2/s
Energy fluence (15-150 keV)             : 7.08414e-08 ( -1.68569e-08  1.76445e-08 ) ergs/cm2
Band function

Time interval is from    0.040 sec. to    1.040 sec.

Spectral model in the Band function:
------------------------------------------------------------
Parameters  : value       lower 90%   higher 90%
alpha       : -0.719246   ( -0.868718   1.7558 )
beta        : -10.0000    ( 10   1.42109e-14 )
Epeak [keV] : 59.1930      ( -19.5253 8574.02 )
Norm@50keV   : 2.83951E-02    ( -0.0283931   0.141986 )
------------------------------------------------------------
#Fit statistic : Chi-Squared =          49.49 using 59 PHA bins.
# Reduced chi-squared =         0.8998 for     55 degrees of freedom
# Null hypothesis probability =   6.843752e-01

Photon flux (15-150 keV)    in 1 sec: 1.07103 ( 5.92897  -0.203977 ) ph/cm2/s
Energy fluence (15-150 keV)             : 7.10154e-08 ( -7.10084e-08  -1.66988e-08 ) ergs/cm2
Single BB
Spectral model blackbody:
------------------------------------------------------------
Parameters  : value    Lower 90%  Upper 90%
kT [keV]    : 12.8997  (-3.17503  3.87668)
R^2/D10^2   : 0.209863  (-0.127469   0.370652)
(R is the radius in km and D10 is the distance to the source in units of 10 kpc)
------------------------------------------------------------
#Fit statistic : Chi-Squared =          54.94 using 59 PHA bins.
# Reduced chi-squared =         0.9639 for     57 degrees of freedom
# Null hypothesis probability =   5.525918e-01

Energy  Fluence     90% Error
[keV]   [erg/cm2]   [erg/cm2]
15- 25  7.407e-09   2.694e-09
25- 50  2.530e-08   7.970e-09
50-150  2.649e-08   1.120e-08
15-150  5.920e-08   1.859e-08
Thermal bremsstrahlung (OTTB)
Spectral model: thermal bremsstrahlung
------------------------------------------------------------
Parameters  : value         Lower 90%    Upper 90%
kT [keV]    : 99.4696       (-41.7076      -100.035)
Norm        : 4.92969       (-1.14141     1.31789)
------------------------------------------------------------
#Fit statistic : Chi-Squared =          50.17 using 59 PHA bins.
# Reduced chi-squared =         0.8801 for     57 degrees of freedom
# Null hypothesis probability =   7.271643e-01

Energy  Fluence     90% Error
[keV]   [erg/cm2]   [erg/cm2]
15- 25  1.288e-08   3.705e-09
25- 50  2.226e-08   8.641e-09
50-150  3.596e-08   2.617e-08
15-150  7.110e-08   3.571e-08
Double BB
Spectral model: bbodyrad<1> + bbodyrad<2>
------------------------------------------------------------
Parameters  : value         Lower 90%    Upper 90%
kT1 [keV]   : 6.02504        (-2.37785      3.3113)
R1^2/D10^2  : 2.01540        (-1.61573      12.1843)
kT2 [keV]   : 20.2471        (-5.99428      12.2059)
R2^2/D10^2  : 3.13872E-02    (-0.027461   0.0626927)
------------------------------------------------------------
#Fit statistic : Chi-Squared =          47.92 using 59 PHA bins.
# Reduced chi-squared =         0.8712 for     55 degrees of freedom
# Null hypothesis probability =   7.396627e-01

Energy  Fluence     90% Error
[keV]   [erg/cm2]   [erg/cm2]
15- 25  1.225e-08   7.410e-09
25- 50  2.224e-08   1.150e-08
50-150  3.864e-08   2.225e-08
15-150  7.313e-08   4.023e-08
Pre-slew spectrum (Pre-slew PHA with pre-slew DRM)
Power-law model

Spectral model in power-law:
------------------------------------------------------------
Parameters  : value       lower 90%   higher 90%
Photon index: 1.59253     ( -0.281868   0.290615 )
Norm@50keV  : 7.18894E-03    ( -0.001347   0.00133021 )
------------------------------------------------------------
#Fit statistic : Chi-Squared =          49.36 using 59 PHA bins.
# Reduced chi-squared =         0.8660 for     57 degrees of freedom
# Null hypothesis probability =   7.539888e-01

Photon flux (15-150 keV)    in 1.592 sec: 0.921679 ( -0.164343  0.164599 ) ph/cm2/s
Energy fluence (15-150 keV)             : 1.07133e-07 ( -2.11886e-08  2.15885e-08 ) ergs/cm2
Cutoff power-law model
Spectral model in the cutoff power-law:
------------------------------------------------------------
Parameters  : value       lower 90%   higher 90%
Photon index: 0.419713     ( -1.51591   1.09075 )
Epeak [keV] : 64.8509      ( -17.6052 247.121 )
Norm@50keV  : 2.94530E-02    ( -0.0294542   0.145485 )
------------------------------------------------------------
#Fit statistic : Chi-Squared =          46.19 using 59 PHA bins.
# Reduced chi-squared =         0.8249 for     56 degrees of freedom
# Null hypothesis probability =   8.220177e-01

Photon flux (15-150 keV)    in 1.592 sec: 0.889198 ( -0.16509  0.167622 ) ph/cm2/s
Energy fluence (15-150 keV)             : 9.96896e-08 ( -2.16915e-08  2.26967e-08 ) ergs/cm2
Band function

Spectral model in the Band function:
------------------------------------------------------------
Parameters  : value       lower 90%   higher 90%
alpha       : -0.418581   ( -1.29677   1.40744 )
beta        : -10.0000    ( 10   7.10543e-15 )
Epeak [keV] : 64.8179      ( -17.5849 244.551 )
Norm@50keV   : 2.94960E-02    ( -0.029496   0.145237 )
------------------------------------------------------------
#Fit statistic : Chi-Squared =          46.19 using 59 PHA bins.
# Reduced chi-squared =         0.8399 for     55 degrees of freedom
# Null hypothesis probability =   7.952463e-01

Photon flux (15-150 keV)    in 1.592 sec:  (    ) ph/cm2/s
Energy fluence (15-150 keV)             : 9.97487e-08 ( -9.97375e-08  -2.17967e-08 ) ergs/cm2
S(25-50 keV) vs. S(50-100 keV) plot
S(25-50 keV)  = 2.77e-08
S(50-100 keV) = 3.67e-08
T90 vs. Hardness ratio plot
T90                                   = 1.39599996805191 sec.
Hardness ratio (energy fluence ratio) = 1.32491
Color vs. Color plot
Count Ratio  (25-50 keV) / (15-25 keV) = 1.1886
Count Ratio (50-100 keV) / (15-25 keV) = 1.1022
Mask shadow pattern
IMX = 4.337226059683312E-01, IMY = 4.930748108105984E-01
TIME vs. PHA plot around the trigger time
Blue+Cyan dotted lines: Time interval of the scaled map
From 0.000000 to 1.024000
TIME vs. DetID plot around the trigger time
Blue+Cyan dotted lines: Time interval of the scaled map
From 0.000000 to 1.024000
100 us light curve (15-350 keV)
Blue+Cyan dotted lines: Time interval of the scaled map
From 0.000000 to 1.024000
Spacecraft aspect plot
Bright source in the pre-burst/pre-slew/post-slew images
Pre-burst image of 15-350 keV band
Time interval of the image:
-161.947400 -0.052000

# RAcent  DECcent POSerr Theta    Phi  PeakCts   SNR AngSep     Name
#  [deg]    [deg]    ['] [deg]  [deg]                   [']
 83.6380  22.0134    0.3   6.1  144.4   6.7593  45.4    0.3	Crab
 91.3334   5.8555    2.7  23.8  155.8   0.7798   4.4 ------	UNKNOWN
 69.4163  55.0442    2.9  29.3   -4.2   0.6994   4.0 ------	UNKNOWN
 54.6206 -23.2694    9.9  55.2 -145.1   1.1896   1.2 ------	UNKNOWN
Pre-slew background subtracted image of 15-350 keV band
Time interval of the image:
-0.052000 1.540000

# RAcent  DECcent POSerr Theta    Phi  PeakCts   SNR AngSep     Name
#  [deg]    [deg]    ['] [deg]  [deg]                   [']
 83.7295  21.8776    3.7   6.3  144.7   0.0378   3.1    9.8	Crab
112.2932  49.1206    1.9  34.1   46.9   0.1335   6.2 ------	UNKNOWN
 87.0282  -8.7987    2.5  36.2  174.0   0.0857   4.6 ------	UNKNOWN
 71.9899  12.5922    2.7  15.5 -145.7   0.0537   4.3 ------	UNKNOWN
 56.9245  34.6259    2.2  20.7  -54.5   0.0757   5.3 ------	UNKNOWN
 42.4667  40.4973    1.3  33.3  -48.7   0.1755   9.1 ------	UNKNOWN
Post-slew image of 15-350 keV band
Time interval of the image:
952.852600 962.360800

# RAcent  DECcent POSerr Theta    Phi  PeakCts   SNR AngSep     Name
#  [deg]    [deg]    ['] [deg]  [deg]                   [']
 83.6297  22.0684    2.4  54.9 -153.5   0.5287   4.8    3.2	Crab
207.8815  51.7674    2.8  37.6   41.6   0.2118   4.1 ------	UNKNOWN
 96.6873  16.0286    3.0  56.6 -170.0   0.4749   3.8 ------	UNKNOWN
Plot creation:
Sat May 30 19:41:26 EDT 2015