Click here for the BAT GCN circular template
Image
Pre-slew 15.0-350.0 keV image (Event data)
#   RAcent    DECcent   POSerr    Theta     Phi              Peak Cts       SNR   Name
  235.0014    12.8824   0.0086    41.6928  -175.8384         2.7893551     22.458 TRIG_00519380

Foreground time interval of the image:
 -7.308  35.637 (delta_t =  42.945 [sec])
Background time interval of the image:
-239.464 -177.424 (delta_t =  62.040 [sec])
-119.464  -7.308 (delta_t = 112.156 [sec])
Lightcurves
Notes:
- 1) The mask-weighted light curves are using the flight position.
- 2) Multiple plots of different time binning/intervals are shown to cover all scenarios of short/long GRBs, rate/image triggers, and real/false positives.
- 3) For all the mask-weighted lightcurves, the y-axis units are counts/sec/det where a det is 0.4 x 0.4 = 0.16 sq cm.
- 4) The verticle lines correspond to following: green dotted lines are T50 interval, black dotted lines are T90 interval, blue solid line(s) is a spacecraft slew start time, and orange solid line(s) is a spacecraft slew end time.
- 5) Time of each bin is in the middle of the bin.
1 s binning
From T0-310 s to T0+310 s
From T100_start - 20 s to T100_end + 30 s

Full time interval
64 ms binning
Full time interval
From T100_start to T100_end

From T0-5 sec to T0+5 sec

16 ms binning
From T100_start-5 s to T100_start+5 s
Blue+Cyan dotted lines: Time interval of the scaled map
From 0.000000 to 4.096000
8 ms binning
From T100_start-3 s to T100_start+3 s
Blue+Cyan dotted lines: Time interval of the scaled map
From 0.000000 to 4.096000
2 ms binning
From T100_start-1 s to T100_start+1 s

Blue+Cyan dotted lines: Time interval of the scaled map
From 0.000000 to 4.096000
SN=5 or 10 sec. binning (whichever binning is satisfied first)

SN=5 or 10 sec. binning (T < 200 sec)
Quad-rate summed light curves (from T0-300s to T0+1000s)
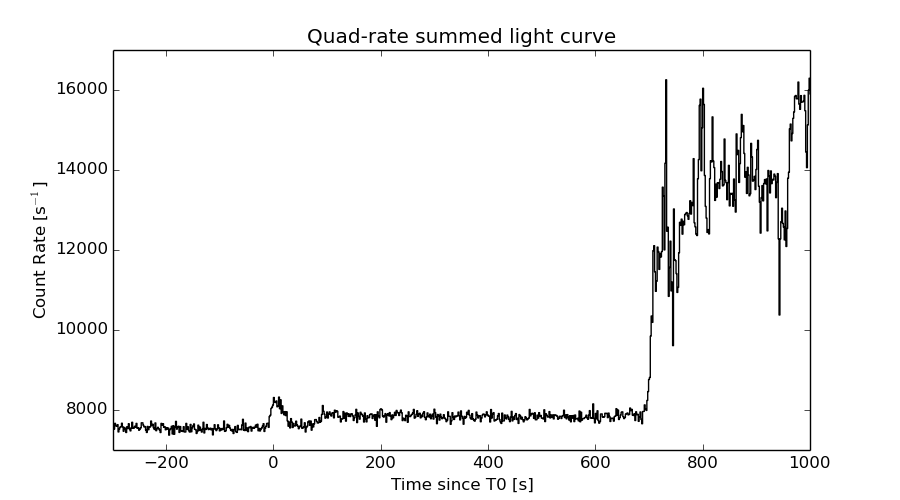
The mask-weighted light curves based on cleaned DPHs

Spectral Evolution

Spectra
Notes:
- 1) The fitting includes the systematic errors.
- 2) When the burst includes telescope slew time periods, the fitting uses an average response file made from multiple 5-s response files through out the slew time plus single time preiod for the non-slew times, and weighted by the total counts in the corresponding time period using addrmf. An average response file is needed becuase a spectral fit using the pre-slew DRM will introduce some errors in both a spectral shape and a normalization if the PHA file contains a lot of the slew/post-slew time interval.
- 3) For fits to more complicated models (e.g. a power-law over a cutoff power-law), the BAT team has decided to require a chi-square improvement of more than 6 for each extra dof.
Time averaged spectrum fit using the average DRM
Power-law model
Time interval is from   -7.308 sec. to   38.452 sec.

Spectral model in power-law:
------------------------------------------------------------
Parameters  : value       lower 90%   higher 90%
Photon index: 1.85266     ( -0.128624   0.131618 )
Norm@50keV  : 3.74612E-03    ( -0.000285902   0.000282385 )
------------------------------------------------------------
#Fit statistic : Chi-Squared =          72.83 using 59 PHA bins.
# Reduced chi-squared =          1.278 for     57 degrees of freedom
# Null hypothesis probability =   7.709865e-02

Photon flux (15-150 keV)    in 45.76 sec: 0.527125 ( -0.0370451  0.0371543 ) ph/cm2/s
Energy fluence (15-150 keV)             : 1.57614e-06 ( -1.20128e-07  1.21088e-07 ) ergs/cm2
Cutoff power-law model

Time interval is from   -7.308 sec. to   38.452 sec.
Spectral model in the cutoff power-law:
------------------------------------------------------------
Parameters  : value       lower 90%   higher 90%
Photon index: 1.81283     ( -0.50045   0.633642 )
Epeak [keV] : 213.665      ( -218.61 -227.492 )
Norm@50keV  : 3.93309E-03    ( -0.00187908   0.00321485 )
------------------------------------------------------------
#Fit statistic : Chi-Squared =          72.81 using 59 PHA bins.
# Reduced chi-squared =          1.300 for     56 degrees of freedom
# Null hypothesis probability =   6.501918e-02

Photon flux (15-150 keV)    in 45.76 sec: 0.525703 ( -0.038989  0.038179 ) ph/cm2/s
Energy fluence (15-150 keV)             : 1.57029e-06 ( -1.35797e-07  1.26243e-07 ) ergs/cm2
Band function

Time interval is from   -7.308 sec. to   38.452 sec.

Spectral model in the Band function:
------------------------------------------------------------
Parameters  : value       lower 90%   higher 90%
alpha       : -1.54543   ( 1.3256   1.3256 )
beta        : -1.91312    ( 1.89129   0.161412 )
Epeak [keV] : 53.8721      ( -38.2512 -38.2512 )
Norm@50keV   : 5.76401E-03    ( -0.00222437   1294.48 )
------------------------------------------------------------
#Fit statistic : Chi-Squared =          72.57 using 59 PHA bins.
# Reduced chi-squared =          1.320 for     55 degrees of freedom
# Null hypothesis probability =   5.632075e-02

Photon flux (15-150 keV)    in 45.76 sec:  (    ) ph/cm2/s
Energy fluence (15-150 keV)             : 0 ( 0  0 ) ergs/cm2
Single BB
Spectral model blackbody:
------------------------------------------------------------
Parameters  : value    Lower 90%  Upper 90%
kT [keV]    : 11.5420  (  )
R^2/D10^2   : 0.138929  (   )
(R is the radius in km and D10 is the distance to the source in units of 10 kpc)
------------------------------------------------------------
#Fit statistic : Chi-Squared =         132.47 using 59 PHA bins.
# Reduced chi-squared =         2.3241 for     57 degrees of freedom
# Null hypothesis probability =   6.043963e-08

Energy  Fluence     90% Error
[keV]   [erg/cm2]   [erg/cm2]
15- 25  1.784e-07   2.256e-08
25- 50  5.358e-07   4.530e-08
50-150  4.178e-07   6.795e-08
15-150  1.132e-06   9.404e-08
Thermal bremsstrahlung (OTTB)

Spectral model: thermal bremsstrahlung
------------------------------------------------------------
Parameters  : value         Lower 90%    Upper 90%
kT [keV]    : 97.3196       (-22.3264      34.7881)
Norm        : 2.30814       (-0.231742     0.270301)
------------------------------------------------------------
#Fit statistic : Chi-Squared =          75.65 using 59 PHA bins.
# Reduced chi-squared =          1.327 for     57 degrees of freedom
# Null hypothesis probability =   4.977156e-02

Energy  Fluence     90% Error
[keV]   [erg/cm2]   [erg/cm2]
15- 25  2.760e-07   3.059e-08
25- 50  4.747e-07   3.720e-08
50-150  7.573e-07   2.533e-07
15-150  1.508e-06   2.750e-07
Double BB

R1^2/D10^2  : 0.765121        (      )
kT2 [keV]   : 27.0841        (-6.6491      12.9162)
R2^2/D10^2  : 4.35955E-03    (-0.00311651   0.00820719)
------------------------------------------------------------
#Fit statistic : Chi-Squared =          81.40 using 59 PHA bins.
#Fit statistic : Chi-Squared =          75.51 using 59 PHA bins.
#Fit statistic : Chi-Squared =          75.08 using 59 PHA bins.
# Reduced chi-squared =          1.480 for     55 degrees of freedom
# Reduced chi-squared =          1.373 for     55 degrees of freedom
# Reduced chi-squared =          1.365 for     55 degrees of freedom
# Null hypothesis probability =   1.187846e-02
# Null hypothesis probability =   3.467013e-02
# Null hypothesis probability =   3.724947e-02

Energy  Fluence     90% Error
[keV]   [erg/cm2]   [erg/cm2]
15- 25  2.803e-07   1.566e-07
25- 50  4.189e-07   1.766e-07
50-150  6.930e-07   3.736e-07
15-150  1.392e-06   5.256e-07
Peak spectrum fit
Power-law model

Time interval is from    3.288 sec. to    4.288 sec.

Spectral model in power-law:
------------------------------------------------------------
Parameters  : value       lower 90%   higher 90%
Photon index: 1.83909     ( -0.366896   0.39146 )
Norm@50keV  : 8.28486E-03    ( -0.00197214   0.00189532 )
------------------------------------------------------------
#Fit statistic : Chi-Squared =          70.04 using 59 PHA bins.
# Reduced chi-squared =          1.229 for     57 degrees of freedom
# Null hypothesis probability =   1.149513e-01

Photon flux (15-150 keV)    in 1 sec: 1.15940 ( -0.237248  0.237723 ) ph/cm2/s
Energy fluence (15-150 keV)             : 7.61911e-08 ( -1.76845e-08  1.81825e-08 ) ergs/cm2
Cutoff power-law model
Time interval is from    3.288 sec. to    4.288 sec.
Spectral model in the cutoff power-law:
------------------------------------------------------------
Parameters  : value       lower 90%   higher 90%
Photon index: 1.82866     ( -1.79037   1.46835 )
Epeak [keV] : 477.103      (   )
Norm@50keV  : 8.40100E-03    (     )
------------------------------------------------------------
#Fit statistic : Chi-Squared =          70.04 using 59 PHA bins.
# Reduced chi-squared =          1.251 for     56 degrees of freedom
# Null hypothesis probability =   9.820824e-02

Photon flux (15-150 keV)    in 1 sec: 1.15912 ( -0.236846  0.2369 ) ph/cm2/s
Energy fluence (15-150 keV)             : 7.61303e-08 ( -2.08215e-08  1.80668e-08 ) ergs/cm2
Band function
Time interval is from    3.288 sec. to    4.288 sec.

Spectral model in the Band function:
------------------------------------------------------------
Parameters  : value       lower 90%   higher 90%
alpha       : 4.75926   ( -4.75926   -4.75926 )
beta        : -2.08329    ( -0.664244   0.484829 )
Epeak [keV] : 26.6564      ( -26.6564 7.69216 )
Norm@50keV   : 539.690    ( -108.497   1.08229e+07 )
------------------------------------------------------------
#Fit statistic : Chi-Squared =          69.44 using 59 PHA bins.
# Reduced chi-squared =          1.263 for     55 degrees of freedom
# Null hypothesis probability =   9.106542e-02

Photon flux (15-150 keV)    in 1 sec:  (    ) ph/cm2/s
Energy fluence (15-150 keV)             : 0 ( 0  0 ) ergs/cm2
Single BB

Spectral model blackbody:
------------------------------------------------------------
Parameters  : value    Lower 90%  Upper 90%
kT [keV]    : 9.81635  (-2.16889  3.1332)
R^2/D10^2   : 0.578993  (-0.379311   0.940941)
(R is the radius in km and D10 is the distance to the source in units of 10 kpc)
------------------------------------------------------------
#Fit statistic : Chi-Squared =          75.98 using 59 PHA bins.
# Reduced chi-squared =          1.333 for     57 degrees of freedom
# Null hypothesis probability =   4.720034e-02

Energy  Fluence     90% Error
[keV]   [erg/cm2]   [erg/cm2]
15- 25  1.129e-08   5.060e-09
25- 50  2.733e-08   1.025e-08
50-150  1.352e-08   7.538e-09
15-150  5.214e-08   1.990e-08
Thermal bremsstrahlung (OTTB)
Spectral model: thermal bremsstrahlung
------------------------------------------------------------
Parameters  : value         Lower 90%    Upper 90%
kT [keV]    : 91.8168       (-46.5429      -91.8168)
Norm        : 5.21182       (-1.34006     2.0914)
------------------------------------------------------------
#Fit statistic : Chi-Squared =          70.40 using 59 PHA bins.
# Reduced chi-squared =          1.235 for     57 degrees of freedom
# Null hypothesis probability =   1.094040e-01

Energy  Fluence     90% Error
[keV]   [erg/cm2]   [erg/cm2]
15- 25  1.361e-08   4.553e-09
25- 50  2.311e-08   9.041e-09
50-150  3.563e-08   2.646e-08
15-150  7.235e-08   3.344e-08
Double BB
Spectral model: bbodyrad<1> + bbodyrad<2>
------------------------------------------------------------
Parameters  : value         Lower 90%    Upper 90%
kT1 [keV]   : 7.41239        (-2.20995      2.60255)
R1^2/D10^2  : 1.43892        (-0.967294      1.60854)
kT2 [keV]   : 42.3736        (-24.7702      -42.3734)
R2^2/D10^2  : 2.36316E-03    (-0.00222266   0.0413402)
------------------------------------------------------------
#Fit statistic : Chi-Squared =          68.03 using 59 PHA bins.
# Reduced chi-squared =          1.237 for     55 degrees of freedom
# Null hypothesis probability =   1.114666e-01

Energy  Fluence     90% Error
[keV]   [erg/cm2]   [erg/cm2]
15- 25  1.395e-08   8.190e-09
25- 50  2.414e-08   1.394e-08
50-150  4.144e-08   2.451e-08
15-150  7.953e-08   4.001e-08
Pre-slew spectrum (Pre-slew PHA with pre-slew DRM)
Power-law model
Spectral model in power-law:
------------------------------------------------------------
Parameters  : value       lower 90%   higher 90%
Photon index: 1.85244     ( -0.128898   0.131898 )
Norm@50keV  : 3.88117E-03    ( -0.000295947   0.000292265 )
------------------------------------------------------------
#Fit statistic : Chi-Squared =          74.90 using 59 PHA bins.
# Reduced chi-squared =          1.314 for     57 degrees of freedom
# Null hypothesis probability =   5.606970e-02

Photon flux (15-150 keV)    in 42.94 sec: 0.546081 ( -0.0383509  0.0384647 ) ph/cm2/s
Energy fluence (15-150 keV)             : 1.53234e-06 ( -1.16691e-07  1.17621e-07 ) ergs/cm2
Cutoff power-law model
Spectral model in the cutoff power-law:
------------------------------------------------------------
Parameters  : value       lower 90%   higher 90%
Photon index: 1.85573     (     )
Epeak [keV] : 9988.45      (   )
Norm@50keV  : 3.86604E-03    (     )
------------------------------------------------------------
#Fit statistic : Chi-Squared =          74.91 using 59 PHA bins.
# Reduced chi-squared =          1.338 for     56 degrees of freedom
# Null hypothesis probability =   4.651657e-02

Photon flux (15-150 keV)    in 42.94 sec: 0.545947 ( -0.040403  0.038118 ) ph/cm2/s
Energy fluence (15-150 keV)             : 1.53222e-06 ( -6.7871e-08  1.16651e-07 ) ergs/cm2
Band function
Spectral model in the Band function:
------------------------------------------------------------
Parameters  : value       lower 90%   higher 90%
alpha       : -1.33628   ( 1.33628   1.33628 )
beta        : -1.89485    ( 1.89485   0.165096 )
Epeak [keV] : 39.4072      ( -39.4072 -39.4072 )
Norm@50keV   : 8.58892E-03    ( -0.00497745   0 )
------------------------------------------------------------
#Fit statistic : Chi-Squared =          74.65 using 59 PHA bins.
# Reduced chi-squared =          1.357 for     55 degrees of freedom
# Null hypothesis probability =   4.008260e-02

Photon flux (15-150 keV)    in 42.94 sec:  (    ) ph/cm2/s
Energy fluence (15-150 keV)             : 0 ( 0  0 ) ergs/cm2
S(25-50 keV) vs. S(50-100 keV) plot
S(25-50 keV)  = 4.52e-07
S(50-100 keV) = 5.01e-07
T90 vs. Hardness ratio plot
T90                                   = 38.7239999175072 sec.
Hardness ratio (energy fluence ratio) = 1.10841
Color vs. Color plot

Count Ratio  (25-50 keV) / (15-25 keV) = 1.26093
Count Ratio (50-100 keV) / (15-25 keV) = 0.749685
Mask shadow pattern
IMX = -8.883938367066269E-01, IMY = 6.464168030272782E-02
TIME vs. PHA plot around the trigger time
Blue+Cyan dotted lines: Time interval of the scaled map
From 0.000000 to 4.096000
TIME vs. DetID plot around the trigger time
Blue+Cyan dotted lines: Time interval of the scaled map
From 0.000000 to 4.096000
100 us light curve (15-350 keV)

Blue+Cyan dotted lines: Time interval of the scaled map
From 0.000000 to 4.096000
Spacecraft aspect plot

Bright source in the pre-burst/pre-slew/post-slew images
Pre-burst image of 15-350 keV band
Time interval of the image:
-239.464000 -177.423600
-119.464000 -7.308000

# RAcent  DECcent POSerr Theta    Phi  PeakCts   SNR AngSep     Name
#  [deg]    [deg]    ['] [deg]  [deg]                   [']
170.2736 -60.5507   12.9  50.1  -19.0   0.3526   0.9    4.5	Cen X-3
186.6687 -62.7966    3.9  47.3  -29.1   1.0874   2.9    1.6	GX 301-2
244.9715 -15.6364    0.3  37.3 -128.0  11.0429  36.4    0.5	Sco X-1
247.9035  22.4770    2.6  57.2 -173.9   4.0891   4.5 ------	UNKNOWN
220.0899 -21.0310    2.5  13.7 -113.7   0.7875   4.7 ------	UNKNOWN
Pre-slew background subtracted image of 15-350 keV band
Time interval of the image:
-7.308000 35.636600

# RAcent  DECcent POSerr Theta    Phi  PeakCts   SNR AngSep     Name
#  [deg]    [deg]    ['] [deg]  [deg]                   [']
170.4776 -60.6587    7.2  50.1  -19.2   0.2774   1.6    5.2	Cen X-3
186.3170 -62.7789    4.9  47.3  -28.9  -0.3893  -2.3    9.3	GX 301-2
244.9477 -15.5207    3.9  37.3 -128.2   0.3830   3.0    7.4	Sco X-1
177.3688  -7.3766    2.6  29.7   65.2   0.5514   4.5 ------	UNKNOWN
235.0014  12.8824    0.5  41.7 -175.8   2.7891  22.5 ------	UNKNOWN
237.5339 -43.4317    2.6  37.2  -79.9   0.8639   4.4 ------	UNKNOWN
214.2763 -67.3817    2.7  50.2  -45.1   1.5608   4.3 ------	UNKNOWN
241.6313 -46.2916    3.2  41.1  -78.7   1.1087   3.5 ------	UNKNOWN
Post-slew image of 15-350 keV band
Time interval of the image:
117.836600 962.610900

# RAcent  DECcent POSerr Theta    Phi  PeakCts   SNR AngSep     Name
#  [deg]    [deg]    ['] [deg]  [deg]                   [']
244.9706 -15.6411    0.1  30.1    3.2  54.6340  79.4    0.5	Sco X-1
254.4888  35.2964    1.3  28.5 -122.7   8.0306   9.2    3.2	Her X-1
256.0595 -37.8349    8.4  54.4    2.2   3.3680   1.4    3.5	4U 1700-377
256.5530 -36.4098    6.4  53.3    0.9   3.4134   1.8    5.7	GX 349+2
262.9196 -24.8333    9.8  46.5  -13.3   1.3106   1.2    7.2	GX 1+4
268.2701  -1.4241    4.1  35.9  -46.5   2.8160   2.8    6.1	SW J1753.5-0127
270.1953 -25.1654   16.1  51.2  -19.4  -1.0429  -0.7    7.1	GX 5-1
270.3946 -25.7172   22.6  51.7  -19.1  -0.7659  -0.5    5.2	GRS 1758-258
274.0848 -13.8263    0.0  47.0  -34.2   2.3569   1.8   13.4	GX 17+2
275.9249 -30.3671  108.5  58.4  -19.0   0.3595   0.1    0.0	H1820-303
262.8275 -33.7534    6.2  53.6   -6.2   3.0922   1.9    9.4	GX 354-0
250.5470 -31.5728    2.1  46.8    4.4   6.1882   5.5 ------	UNKNOWN
255.4572 -27.6126    2.5  45.0   -3.3   5.0088   4.6 ------	UNKNOWN
250.5416  28.1659    2.6  21.1 -116.5   3.0454   4.4 ------	UNKNOWN
251.8492  42.2852    3.3  32.8 -134.2   3.3419   3.5 ------	UNKNOWN
Plot creation:
Sat May 30 19:37:18 EDT 2015