Click here for the BAT GCN circular template
Image
Pre-slew 15-350 keV image (Event data; bkg subtracted)

#   RAcent  DECcent POSerr  Theta    Phi     Peak Cts     SNR  Name
   35.4756 +59.7044 0.0624   29.9 -164.0       0.0089     3.1  TRIG_00519874
------------------------------------------

Foreground time interval of the image:
  0.000   0.064 (delta_t =   0.064 [sec])
Background time interval of the image:
-60.124  -7.124 (delta_t =  53.000 [sec])
Lightcurves
Notes:
- 1) All plots contain as much data as has been downloaded to date.
- 2) The mask-weighted light curves are using the flight position.
- 3) Multiple plots of different time binning/intervals are shown to cover all scenarios of short/long GRBs, rate/image triggers, and real/false positives.
- 4) For all the mask-weighted lightcurves, the y-axis units are counts/sec/det where a det is 0.4 x 0.4 = 0.16 sq cm.
- 5) The verticle lines correspond to following: green dotted lines are T50 interval, black dotted lines are T90 interval, blue solid line(s) is a spacecraft slew start time, and orange solid line(s) is a spacecraft slew end time.
- 6) Time of each bin is in the middle of the bin.
1 s binning
From T0-310 s to T0+310 s

From T100_start - 20 s to T100_end + 30 s

Full time interval

64 ms binning
Full time interval

From T100_start to T100_end

From T0-5 sec to T0+5 sec

16 ms binning
From T100_start-5 s to T100_start+5 s

Blue+Cyan dotted lines: Time interval of the scaled map
From 0.000000 to 0.064000
8 ms binning
From T100_start-3 s to T100_start+3 s

Blue+Cyan dotted lines: Time interval of the scaled map
From 0.000000 to 0.064000
2 ms binning
From T100_start-1 s to T100_start+1 s

Blue+Cyan dotted lines: Time interval of the scaled map
From 0.000000 to 0.064000
SN=5 or 10 sec. binning (whichever binning is satisfied first)

SN=5 or 10 sec. binning (T < 200 sec)

Flight mask-tagged light curves
Caution: Mask-weight map is always using the same on-axis map


Quad-rate summed light curves (from T0-300 to T0+1000)

The mask-weighted light curves based on cleaned DPHs

Spectra
Notes:
- 1) The fitting includes the systematic errors.
- 2) For long bursts, a spectral fit of the pre-slew DRM will introduce some errors in both a spectral shape and a normalization if the PHA file contains a lot of the slew/post-slew time interval.
- 3) For fits to more complicated models (e.g. a power-law over a cutoff power-law), the BAT team has decided to require a chi-square improvement of more than 6 for each extra dof.
- 4) For short bursts (T90<1sec), the specrtum is also fit with Blackbody, OTTB, and Double Blackbody.
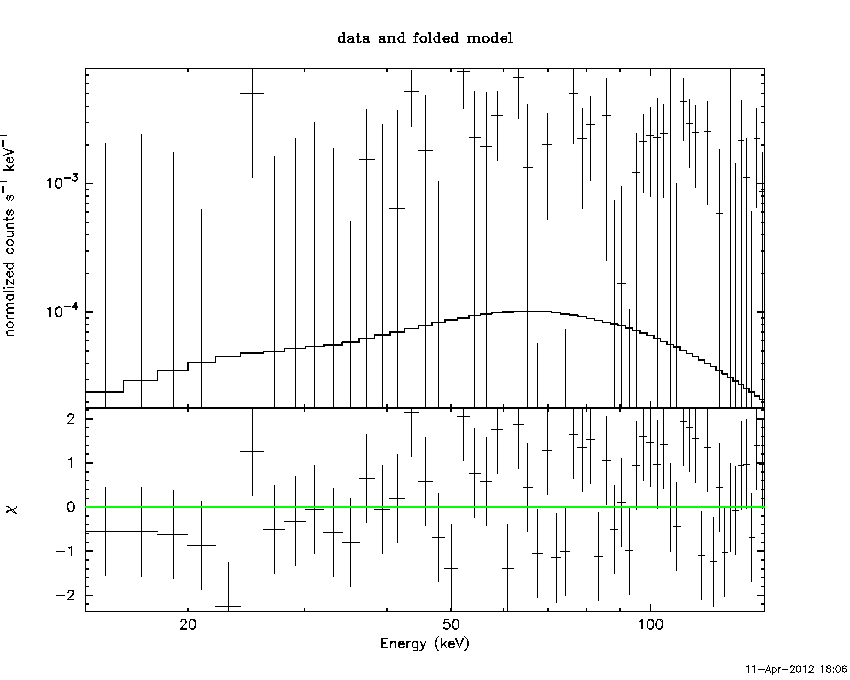
Time averaged spectrum fit using the pre-slew DRM
Power-law model

Time interval is from    0.000 sec. to    0.064 sec.

Spectral model in power-law:
------------------------------------------------------------
Parameters  : value       lower 90%   higher 90%
Photon index: 1.50000     ( -1.5   -1.5 )
Norm@50keV  : 0.0    ( 0   0.003229 )
------------------------------------------------------------
# Chi-Squared =          76.89 using 59 PHA bins.
# Reduced chi-squared =          1.349 for     57 degrees of freedom
# Null hypothesis probability =   4.069973e-02

Photon flux (15-150 keV)    in 0.064 sec: 5.07886E-02 ( -0.0508131  0.309733 ) ph/cm2/s
Energy fluence (15-150 keV)             : 4.9918e-10 ( -4.9918e-10  2.19772e-09 ) ergs/cm2
Cutoff power-law model

Time interval is from    0.000 sec. to    0.064 sec.
Spectral model in the cutoff power-law:
------------------------------------------------------------
Parameters  : value       lower 90%   higher 90%
Photon index: 2.64499     (     )
Epeak [keV] : 50.1615      (   )
Norm@50keV  : 2.97788E-34    (     )
------------------------------------------------------------
# Chi-Squared =          76.87 using 59 PHA bins.
# Reduced chi-squared =          1.373 for     56 degrees of freedom
# Null hypothesis probability =   3.357714e-02

Photon flux (15-150 keV)    in 0.064 sec: 0.0 ( 0  0.372335 ) ph/cm2/s
Energy fluence (15-150 keV)             : 0 ( 0  0 ) ergs/cm2
Band function

Time interval is from    0.000 sec. to    0.064 sec.

Spectral model in the Band function:
------------------------------------------------------------
Parameters  : value       lower 90%   higher 90%
alpha       : 4.38491   ( -1.18275   -1.18275 )
beta        : -9.31756    ( 9.88904   9.88904 )
Epeak [keV] : 131.707      ( -132.002 -132.002 )
Norm@50keV   : 5.03619E-03    ( -0.00496413   0.0719927 )
------------------------------------------------------------
# Chi-Squared =          76.62 using 59 PHA bins.
# Reduced chi-squared =          1.393 for     55 degrees of freedom
# Null hypothesis probability =   2.861244e-02

Photon flux (15-150 keV)    in 0.064 sec:  (    ) ph/cm2/s
Energy fluence (15-150 keV)             : 0 ( 0  0 ) ergs/cm2
Single BB

Spectral model blackbody:
------------------------------------------------------------
Parameters  : value    Lower 90%  Upper 90%
kT [keV]    : 5.00000  (-5  -5)
R^2/D10^2   : 0.0  (0   0)
(R is the radius in km and D10 is the distance to the source in units of 10 kpc)
------------------------------------------------------------
# Chi-Squared =          76.89 using 59 PHA bins.
# Reduced chi-squared =          1.349 for     57 degrees of freedom
# Null hypothesis probability =   4.069973e-02

Energy  Fluence     90% Error
[keV]   [erg/cm2]   [erg/cm2]
15- 25  0.000e+00   0.000e+00
25- 50  0.000e+00   0.000e+00
50-150  0.000e+00   0.000e+00
15-150  0.000e+00   0.000e+00
Thermal bremsstrahlung (OTTB)

Spectral model: thermal bremsstrahlung
------------------------------------------------------------
Parameters  : value         Lower 90%    Upper 90%
kT [keV]    : 7.00000       (-7      -7)
Norm        : 0.0       (0     0)
------------------------------------------------------------
# Chi-Squared =          76.89 using 59 PHA bins.
# Reduced chi-squared =          1.349 for     57 degrees of freedom
# Null hypothesis probability =   4.069973e-02

Energy  Fluence     90% Error
[keV]   [erg/cm2]   [erg/cm2]
15- 25  0.000e+00   0.000e+00
25- 50  0.000e+00   0.000e+00
50-150  0.000e+00   0.000e+00
15-150  0.000e+00   0.000e+00
Double BB

------------------------------------------------------------
# Chi-Squared =          76.89 using 59 PHA bins.
# Chi-Squared =          76.78 using 59 PHA bins.
# Chi-Squared =          76.75 using 59 PHA bins.
# Chi-Squared =          76.71 using 59 PHA bins.
# Reduced chi-squared =          1.398 for     55 degrees of freedom
# Reduced chi-squared =          1.396 for     55 degrees of freedom
# Reduced chi-squared =          1.395 for     55 degrees of freedom
# Reduced chi-squared =          1.395 for     55 degrees of freedom
# Null hypothesis probability =   2.727034e-02
# Null hypothesis probability =   2.782391e-02
# Null hypothesis probability =   2.796792e-02
# Null hypothesis probability =   2.815070e-02

Energy  Fluence     90% Error
[keV]   [erg/cm2]   [erg/cm2]
15- 25  0.000e+00   0.000e+00
25- 50  0.000e+00   0.000e+00
50-150  0.000e+00   0.000e+00
15-150  0.000e+00   0.000e+00
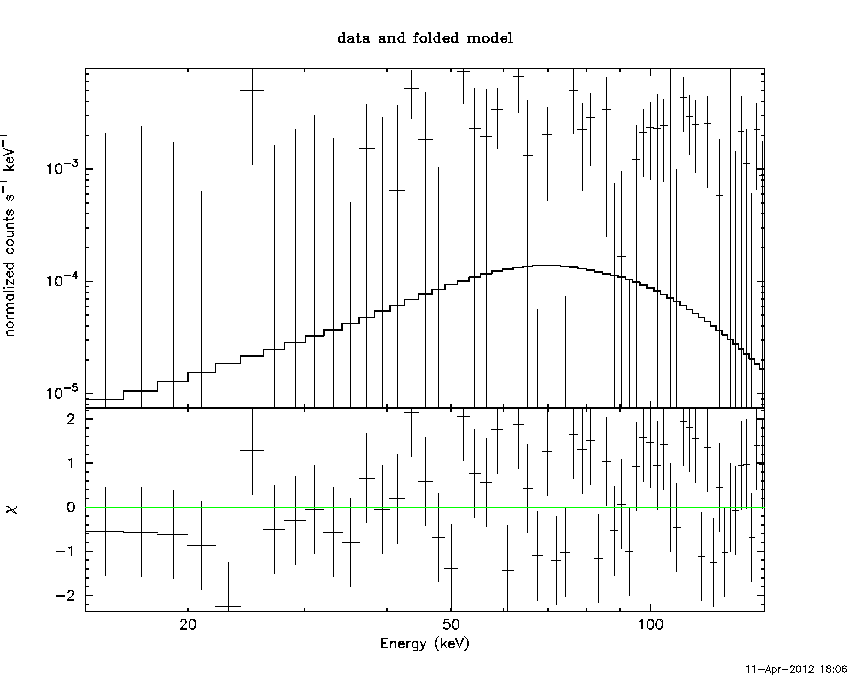
Peak spectrum fit
Power-law model

Time interval is from    0.000 sec. to    0.064 sec.

Spectral model in power-law:
------------------------------------------------------------
Parameters  : value       lower 90%   higher 90%
Photon index: 1.50000     ( -1.5   -1.5 )
Norm@50keV  : 0.0    ( 0   0.003229 )
------------------------------------------------------------
# Chi-Squared =          76.89 using 59 PHA bins.
# Reduced chi-squared =          1.349 for     57 degrees of freedom
# Null hypothesis probability =   4.069973e-02

Photon flux (15-150 keV)    in 0.064 sec: 5.07886E-02 ( -0.0508131  0.309733 ) ph/cm2/s
Energy fluence (15-150 keV)             : 4.9918e-10 ( -4.9918e-10  2.19772e-09 ) ergs/cm2
Cutoff power-law model

Time interval is from    0.000 sec. to    0.064 sec.
Spectral model in the cutoff power-law:
------------------------------------------------------------
Parameters  : value       lower 90%   higher 90%
Photon index: 2.64499     (     )
Epeak [keV] : 50.1615      (   )
Norm@50keV  : 2.97788E-34    (     )
------------------------------------------------------------
# Chi-Squared =          76.87 using 59 PHA bins.
# Reduced chi-squared =          1.373 for     56 degrees of freedom
# Null hypothesis probability =   3.357714e-02

Photon flux (15-150 keV)    in 0.064 sec: 0.0 ( 0  0.372335 ) ph/cm2/s
Energy fluence (15-150 keV)             : 0 ( 0  0 ) ergs/cm2
Band function

Time interval is from    0.000 sec. to    0.064 sec.

Spectral model in the Band function:
------------------------------------------------------------
Parameters  : value       lower 90%   higher 90%
alpha       : 4.38491   ( -1.18275   -1.18275 )
beta        : -9.31756    ( 9.88904   9.88904 )
Epeak [keV] : 131.707      ( -132.002 -132.002 )
Norm@50keV   : 5.03619E-03    ( -0.00496413   0.0719927 )
------------------------------------------------------------
# Chi-Squared =          76.62 using 59 PHA bins.
# Reduced chi-squared =          1.393 for     55 degrees of freedom
# Null hypothesis probability =   2.861244e-02

Photon flux (15-150 keV)    in 0.064 sec:  (    ) ph/cm2/s
Energy fluence (15-150 keV)             : 0 ( 0  0 ) ergs/cm2
Single BB

Spectral model blackbody:
------------------------------------------------------------
Parameters  : value    Lower 90%  Upper 90%
kT [keV]    : 5.00000  (-5  -5)
R^2/D10^2   : 0.0  (0   0)
(R is the radius in km and D10 is the distance to the source in units of 10 kpc)
------------------------------------------------------------
# Chi-Squared =          76.89 using 59 PHA bins.
# Reduced chi-squared =          1.349 for     57 degrees of freedom
# Null hypothesis probability =   4.069973e-02

Energy  Fluence     90% Error
[keV]   [erg/cm2]   [erg/cm2]
15- 25  0.000e+00   0.000e+00
25- 50  0.000e+00   0.000e+00
50-150  0.000e+00   0.000e+00
15-150  0.000e+00   0.000e+00
Thermal bremsstrahlung (OTTB)

Spectral model: thermal bremsstrahlung
------------------------------------------------------------
Parameters  : value         Lower 90%    Upper 90%
kT [keV]    : 7.00000       (-7      -7)
Norm        : 0.0       (0     0)
------------------------------------------------------------
# Chi-Squared =          76.89 using 59 PHA bins.
# Reduced chi-squared =          1.349 for     57 degrees of freedom
# Null hypothesis probability =   4.069973e-02

Energy  Fluence     90% Error
[keV]   [erg/cm2]   [erg/cm2]
15- 25  0.000e+00   0.000e+00
25- 50  0.000e+00   0.000e+00
50-150  0.000e+00   0.000e+00
15-150  0.000e+00   0.000e+00
Double BB
------------------------------------------------------------
# Chi-Squared =          76.89 using 59 PHA bins.
# Chi-Squared =          76.78 using 59 PHA bins.
# Chi-Squared =          76.75 using 59 PHA bins.
# Chi-Squared =          76.71 using 59 PHA bins.
# Reduced chi-squared =          1.398 for     55 degrees of freedom
# Reduced chi-squared =          1.396 for     55 degrees of freedom
# Reduced chi-squared =          1.395 for     55 degrees of freedom
# Reduced chi-squared =          1.395 for     55 degrees of freedom
# Null hypothesis probability =   2.727034e-02
# Null hypothesis probability =   2.782391e-02
# Null hypothesis probability =   2.796792e-02
# Null hypothesis probability =   2.815070e-02

Energy  Fluence     90% Error
[keV]   [erg/cm2]   [erg/cm2]
15- 25  0.000e+00   0.000e+00
25- 50  0.000e+00   0.000e+00
50-150  0.000e+00   0.000e+00
15-150  0.000e+00   0.000e+00
Pre-slew spectrum (Pre-slew PHA with pre-slew DRM)
Power-law model
Spectral model in power-law:
------------------------------------------------------------
Parameters  : value       lower 90%   higher 90%
Photon index: 1.50000     ( -1.5   -1.5 )
Norm@50keV  : 0.0    ( 0   0.003229 )
------------------------------------------------------------
# Chi-Squared =          76.89 using 59 PHA bins.
# Reduced chi-squared =          1.349 for     57 degrees of freedom
# Null hypothesis probability =   4.069973e-02

Photon flux (15-150 keV)    in 0.064 sec: 5.07886E-02 ( -0.0508131  0.309733 ) ph/cm2/s
Energy fluence (15-150 keV)             : 4.9918e-10 ( -4.9918e-10  2.19772e-09 ) ergs/cm2
Cutoff power-law model

Spectral model in the cutoff power-law:
------------------------------------------------------------
Parameters  : value       lower 90%   higher 90%
Photon index: 2.64499     (     )
Epeak [keV] : 50.1615      (   )
Norm@50keV  : 2.97788E-34    (     )
------------------------------------------------------------
# Chi-Squared =          76.87 using 59 PHA bins.
# Reduced chi-squared =          1.373 for     56 degrees of freedom
# Null hypothesis probability =   3.357714e-02

Photon flux (15-150 keV)    in 0.064 sec: 0.0 ( 0  0.372335 ) ph/cm2/s
Energy fluence (15-150 keV)             : 0 ( 0  0 ) ergs/cm2
Band function
Spectral model in the Band function:
------------------------------------------------------------
Parameters  : value       lower 90%   higher 90%
alpha       : 4.38491   ( -1.18275   -1.18275 )
beta        : -9.31756    ( 9.88904   9.88904 )
Epeak [keV] : 131.707      ( -132.002 -132.002 )
Norm@50keV   : 5.03619E-03    ( -0.00496413   0.0719927 )
------------------------------------------------------------
# Chi-Squared =          76.62 using 59 PHA bins.
# Reduced chi-squared =          1.393 for     55 degrees of freedom
# Null hypothesis probability =   2.861244e-02

Photon flux (15-150 keV)    in 0.064 sec:  (    ) ph/cm2/s
Energy fluence (15-150 keV)             : 0 ( 0  0 ) ergs/cm2
S(25-50 keV) vs. S(50-100 keV) plot

S(25-50 keV)  = 2.23025e-11
S(50-100 keV) = 1.42429e-10
T90 vs. Hardness ratio plot

T90                                   = 0.0640000104904175 sec.
Hardness ratio (energy fluence ratio) = 6.38623
Color vs. Color plot

Count Ratio  (25-50 keV) / (15-25 keV) = -0.147145
Count Ratio (50-100 keV) / (15-25 keV) = -1.61958
Mask shadow pattern

IMX = -5.522798559676596E-01, IMY = 1.585538223826882E-01
TIME vs. PHA plot around the trigger time

Blue+Cyan dotted lines: Time interval of the scaled map
From 0.000000 to 0.064000
TIME vs. DetID plot around the trigger time

Blue+Cyan dotted lines: Time interval of the scaled map
From 0.000000 to 0.064000
100 us light curve (15-350 keV)

Blue+Cyan dotted lines: Time interval of the scaled map
From 0.000000 to 0.064000
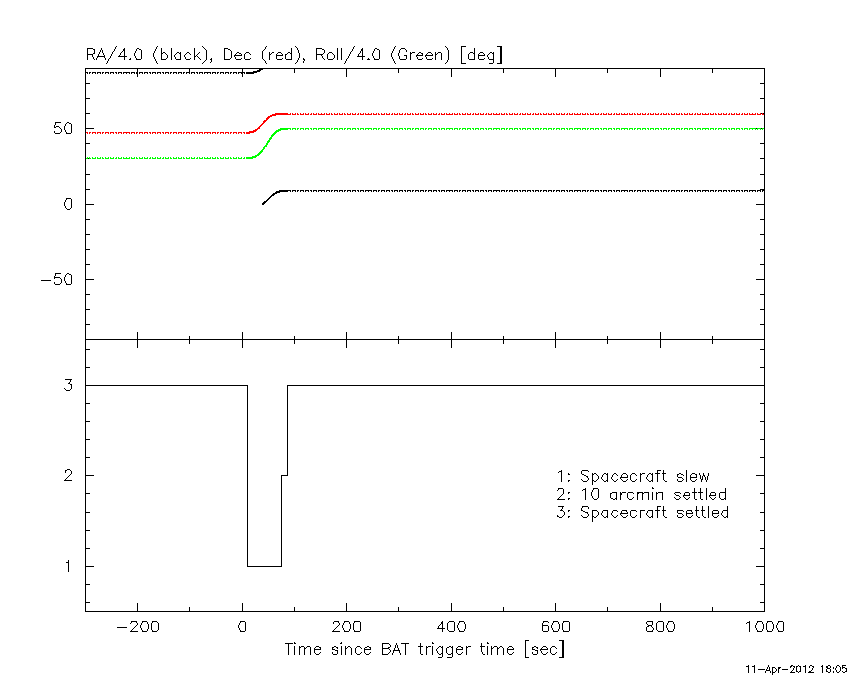
Spacecraft aspect plot
Bright source in the pre-burst/pre-slew/post-slew images
Pre-burst image of 15-350 keV band
Time interval of the image:
-60.124000 -7.124000

# RAcent  DECcent POSerr Theta    Phi  PeakCts   SNR AngSep     Name
#  [deg]    [deg]    ['] [deg]  [deg]                   [']
299.5929  35.1740    2.2  37.7   56.8   0.9705   5.3    1.7	Cyg X-1
307.9399  41.0728    6.4  29.1   60.0   0.2001   1.8   10.6	Cyg X-3
326.2266  38.4627    5.6  18.2   36.1   0.1406   2.1    8.8	Cyg X-2
326.4631   3.2069    2.2  48.0   -2.6   0.7282   5.3 ------	UNKNOWN
 28.9025  22.1499    3.4  41.3  -98.9   1.1038   3.4 ------	UNKNOWN
Pre-slew background subtracted image of 15-350 keV band
Time interval of the image:
0.000000 0.064000

# RAcent  DECcent POSerr Theta    Phi  PeakCts   SNR AngSep     Name
#  [deg]    [deg]    ['] [deg]  [deg]                   [']
299.4069  35.2613   17.2  37.8   57.1   0.0045   0.7    9.7	Cyg X-1
307.9189  41.1077    0.0  29.1   60.1  -0.0043  -1.0   12.7	Cyg X-3
325.9892  38.3482    5.3  18.5   36.2   0.0060   2.2    8.7	Cyg X-2
Post-slew image of 15-350 keV band
Time interval of the image:
75.776600 302.951300

# RAcent  DECcent POSerr Theta    Phi  PeakCts   SNR AngSep     Name
#  [deg]    [deg]    ['] [deg]  [deg]                   [']
 83.6228  22.0004    0.6  50.6 -172.7   8.0566  18.8    1.0	Crab
308.0908  40.9547    3.8  54.3    2.4   1.8734   3.1    0.9	Cyg X-3
326.3626  38.3743   14.1  47.4  -13.8   0.2632   0.8    9.5	Cyg X-2
110.3805  46.0046    2.2  44.5  143.6   2.8700   5.3 ------	UNKNOWN
353.5595  78.1526    2.5  22.7   49.8   0.9233   4.7 ------	UNKNOWN
320.5498  59.5119    2.8  35.8   13.8   0.9966   4.2 ------	UNKNOWN
359.4119  69.4238    2.5  17.8   28.1   0.7817   4.6 ------	UNKNOWN
 50.3178  13.0821    2.5  48.0 -128.9   3.5527   4.5 ------	UNKNOWN
Plot creation:
Wed Apr 11 18:07:25 EDT 2012