Special notes of this burst
Image
Pre-slew 25.0-100.0 keV image (Event data)
#RAcent DECcent POSerr Theta  Phi  Peak_Cts  SNR Name
136.929 14.006 0.000 23.543 -110.991 0.177 10.202 TRIG_00520658

Image time interval: 0.000 to 4.096 [sec]
Lightcurves
Notes:
- 1) The mask-weighted light curves are using the flight position.
- 2) Multiple plots of different time binning/intervals are shown to cover all scenarios of short/long GRBs, rate/image triggers, and real/false positives.
- 3) For all the mask-weighted lightcurves, the y-axis units are counts/sec/det where a det is 0.4 x 0.4 = 0.16 sq cm.
- 4) The verticle lines correspond to following: green dotted lines are T50 interval, black dotted lines are T90 interval, blue solid line(s) is a spacecraft slew start time, and orange solid line(s) is a spacecraft slew end time.
- 5) Time of each bin is in the middle of the bin.
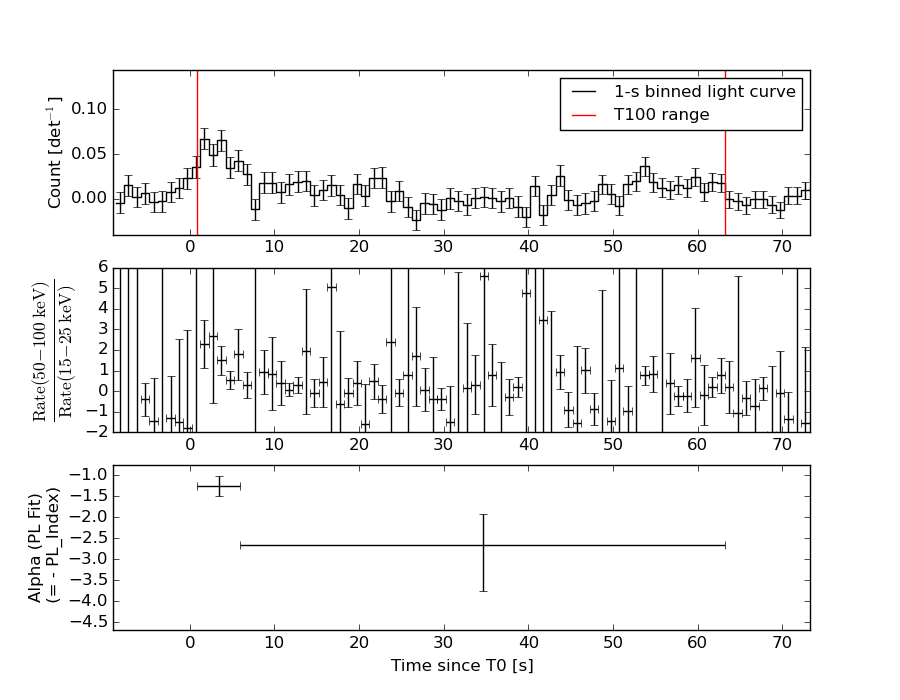
1 s binning
From T0-310 s to T0+310 s
From T100_start - 20 s to T100_end + 30 s
Full time interval
64 ms binning
Full time interval
From T100_start to T100_end
From T0-5 sec to T0+5 sec

16 ms binning
From T100_start-5 s to T100_start+5 s

Blue+Cyan dotted lines: Time interval of the scaled map
From 0.000000 to 4.096000
8 ms binning
From T100_start-3 s to T100_start+3 s
Blue+Cyan dotted lines: Time interval of the scaled map
From 0.000000 to 4.096000
2 ms binning
From T100_start-1 s to T100_start+1 s
Blue+Cyan dotted lines: Time interval of the scaled map
From 0.000000 to 4.096000
SN=5 or 10 sec. binning (whichever binning is satisfied first)
SN=5 or 10 sec. binning (T < 200 sec)
Quad-rate summed light curves (from T0-300s to T0+1000s)
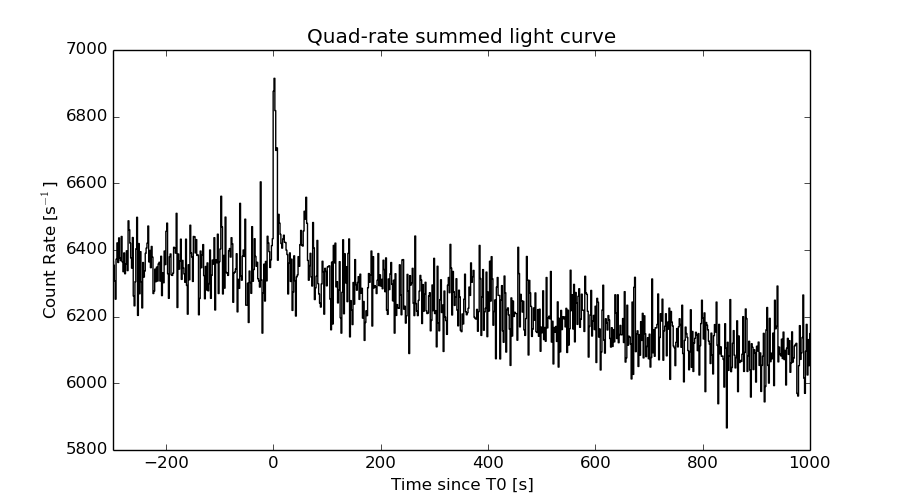
The mask-weighted light curves based on cleaned DPHs

Spectral Evolution
Spectra
Notes:
- 1) The fitting includes the systematic errors.
- 2) When the burst includes telescope slew time periods, the fitting uses an average response file made from multiple 5-s response files through out the slew time plus single time preiod for the non-slew times, and weighted by the total counts in the corresponding time period using addrmf. An average response file is needed becuase a spectral fit using the pre-slew DRM will introduce some errors in both a spectral shape and a normalization if the PHA file contains a lot of the slew/post-slew time interval.
- 3) For fits to more complicated models (e.g. a power-law over a cutoff power-law), the BAT team has decided to require a chi-square improvement of more than 6 for each extra dof.
Time averaged spectrum fit using the average DRM
Power-law model
Time interval is from    0.864 sec. to   63.264 sec.

Spectral model in power-law:
------------------------------------------------------------
Parameters  : value       lower 90%   higher 90%
Photon index: 1.98649     ( -0.416196   0.474842 )
Norm@50keV  : 5.60596E-04    ( -0.00017508   0.000165992 )
------------------------------------------------------------
#Fit statistic : Chi-Squared =          50.36 using 59 PHA bins.
# Reduced chi-squared =         0.8836 for     57 degrees of freedom
# Null hypothesis probability =   7.205352e-01

Photon flux (15-150 keV)    in 62.4 sec: 8.35714E-02 ( -0.0181214  0.0181281 ) ph/cm2/s
Energy fluence (15-150 keV)             : 3.22375e-07 ( -9.00101e-08  9.62114e-08 ) ergs/cm2
Cutoff power-law model
Time interval is from    0.864 sec. to   63.264 sec.
Spectral model in the cutoff power-law:
------------------------------------------------------------
Parameters  : value       lower 90%   higher 90%
Photon index: 2.09839     (     )
Epeak [keV] : 44.6638      (   )
Norm@50keV  : 4.76705E-04    (     )
------------------------------------------------------------
#Fit statistic : Chi-Squared =          50.31 using 59 PHA bins.
# Reduced chi-squared =         0.8983 for     56 degrees of freedom
# Null hypothesis probability =   6.892539e-01

Photon flux (15-150 keV)    in 62.4 sec: 8.35222E-02 ( -0.0180895  0.0180258 ) ph/cm2/s
Energy fluence (15-150 keV)             : 3.22635e-07 ( -1.09973e-07  9.45185e-08 ) ergs/cm2
Band function
Time interval is from    0.864 sec. to   63.264 sec.

Spectral model in the Band function:
------------------------------------------------------------
Parameters  : value       lower 90%   higher 90%
alpha       : -1.11557   ( 1.03212   1.03212 )
beta        : -2.09388    ( 2.10678   0.523826 )
Epeak [keV] : 28.2931      ( -28.3804 147.865 )
Norm@50keV   : 2.34711E-03    ( -0.00311077   201.936 )
------------------------------------------------------------
#Fit statistic : Chi-Squared =          50.20 using 59 PHA bins.
# Reduced chi-squared =         0.9128 for     55 degrees of freedom
# Null hypothesis probability =   6.581706e-01

Photon flux (15-150 keV)    in 62.4 sec:  (    ) ph/cm2/s
Energy fluence (15-150 keV)             : 0 ( 0  0 ) ergs/cm2
Single BB
Spectral model blackbody:
------------------------------------------------------------
Parameters  : value    Lower 90%  Upper 90%
kT [keV]    : 8.25364  (-1.91459  2.63871)
R^2/D10^2   : 8.05036E-02  (-0.0529775   0.145441)
(R is the radius in km and D10 is the distance to the source in units of 10 kpc)
------------------------------------------------------------
#Fit statistic : Chi-Squared =          54.87 using 59 PHA bins.
# Reduced chi-squared =         0.9626 for     57 degrees of freedom
# Null hypothesis probability =   5.554151e-01

Energy  Fluence     90% Error
[keV]   [erg/cm2]   [erg/cm2]
15- 25  6.327e-08   2.914e-08
25- 50  1.168e-07   5.150e-08
50-150  3.396e-08   2.257e-08
15-150  2.140e-07   1.004e-07
Thermal bremsstrahlung (OTTB)
Spectral model: thermal bremsstrahlung
------------------------------------------------------------
Parameters  : value         Lower 90%    Upper 90%
kT [keV]    : 62.2371       (-31.8718      120.975)
Norm        : 0.429752       (-0.134147     0.226979)
------------------------------------------------------------
#Fit statistic : Chi-Squared =          50.95 using 59 PHA bins.
# Reduced chi-squared =         0.8938 for     57 degrees of freedom
# Null hypothesis probability =   7.002717e-01

Energy  Fluence     90% Error
[keV]   [erg/cm2]   [erg/cm2]
15- 25  6.778e-08   2.289e-08
25- 50  1.043e-07   3.698e-08
50-150  1.223e-07   9.221e-08
15-150  2.944e-07   1.680e-07
Double BB
Spectral model: bbodyrad<1> + bbodyrad<2>
------------------------------------------------------------
Parameters  : value         Lower 90%    Upper 90%
kT1 [keV]   : 6.49017        (-2.83001      2.56022)
R1^2/D10^2  : 0.177010        (-0.106648      0.163163)
kT2 [keV]   : 37.3083        (-41.6097      -54.2464)
R2^2/D10^2  : 2.17016E-04    (-8.65857e-05   0.0109113)
------------------------------------------------------------
#Fit statistic : Chi-Squared =          49.58 using 59 PHA bins.
# Reduced chi-squared =         0.9015 for     55 degrees of freedom
# Null hypothesis probability =   6.808856e-01

Energy  Fluence     90% Error
[keV]   [erg/cm2]   [erg/cm2]
15- 25  7.118e-08   4.103e-08
25- 50  9.786e-08   5.451e-08
50-150  1.593e-07   9.744e-08
15-150  3.283e-07   1.803e-07
Peak spectrum fit
Power-law model
Time interval is from    0.844 sec. to    1.844 sec.

Spectral model in power-law:
------------------------------------------------------------
Parameters  : value       lower 90%   higher 90%
Photon index: 1.00229     ( -0.508608   0.471181 )
Norm@50keV  : 4.96750E-03    ( -0.00129734   0.00128291 )
------------------------------------------------------------
#Fit statistic : Chi-Squared =          58.22 using 59 PHA bins.
# Reduced chi-squared =          1.021 for     57 degrees of freedom
# Null hypothesis probability =   4.302537e-01

Photon flux (15-150 keV)    in 1 sec: 0.571942 ( -0.150528  0.151616 ) ph/cm2/s
Energy fluence (15-150 keV)             : 5.3672e-08 ( -1.5039e-08  1.53442e-08 ) ergs/cm2
Cutoff power-law model
Time interval is from    0.844 sec. to    1.844 sec.
Spectral model in the cutoff power-law:
------------------------------------------------------------
Parameters  : value       lower 90%   higher 90%
Photon index: 0.866635     ( -2.39793   -0.86663 )
Epeak [keV] : 481.688      ( -481.675 -481.675 )
Norm@50keV  : 5.70313E-03    (     )
------------------------------------------------------------
#Fit statistic : Chi-Squared =          58.20 using 59 PHA bins.
# Reduced chi-squared =          1.039 for     56 degrees of freedom
# Null hypothesis probability =   3.943064e-01

Photon flux (15-150 keV)    in 1 sec: 0.568108 ( -0.159174  0.154274 ) ph/cm2/s
Energy fluence (15-150 keV)             : 5.32953e-08 ( -1.62822e-08  1.56443e-08 ) ergs/cm2
Band function

Time interval is from    0.844 sec. to    1.844 sec.

Spectral model in the Band function:
------------------------------------------------------------
Parameters  : value       lower 90%   higher 90%
alpha       : -1.98776   ( 1.98776   1.98776 )
beta        : -1.00212    ( -0.471861   0.508486 )
Epeak [keV] : 9999.16      ( -9999.31 -9999.31 )
Norm@50keV   : 4.96677E-03    ( -0.00126841   0.00253748 )
------------------------------------------------------------
#Fit statistic : Chi-Squared =          58.22 using 59 PHA bins.
# Reduced chi-squared =          1.059 for     55 degrees of freedom
# Null hypothesis probability =   3.577700e-01

Photon flux (15-150 keV)    in 1 sec:  (    ) ph/cm2/s
Energy fluence (15-150 keV)             : 0 ( 0  0 ) ergs/cm2
Single BB
Spectral model blackbody:
------------------------------------------------------------
Parameters  : value    Lower 90%  Upper 90%
kT [keV]    : 22.5657  (-6.95863  12.6391)
R^2/D10^2   : 1.85746E-02  (-0.0185502   0.0412184)
(R is the radius in km and D10 is the distance to the source in units of 10 kpc)
------------------------------------------------------------
#Fit statistic : Chi-Squared =          60.65 using 59 PHA bins.
# Reduced chi-squared =          1.064 for     57 degrees of freedom
# Null hypothesis probability =   3.456914e-01

Energy  Fluence     90% Error
[keV]   [erg/cm2]   [erg/cm2]
15- 25  1.730e-09   1.093e-09
25- 50  9.284e-09   5.590e-09
50-150  3.533e-08   2.019e-08
15-150  4.634e-08   2.790e-08
Thermal bremsstrahlung (OTTB)
Spectral model: thermal bremsstrahlung
------------------------------------------------------------
Parameters  : value         Lower 90%    Upper 90%
kT [keV]    : 200.000       (-86.2117      -200)
Norm        : 2.33339       (-0.624322     0.624322)
------------------------------------------------------------
#Fit statistic : Chi-Squared =          61.91 using 59 PHA bins.
# Reduced chi-squared =          1.086 for     57 degrees of freedom
# Null hypothesis probability =   3.052586e-01

Energy  Fluence     90% Error
[keV]   [erg/cm2]   [erg/cm2]
15- 25  5.813e-09   3.503e-09
25- 50  1.118e-08   6.705e-09
50-150  2.453e-08   1.477e-08
15-150  4.152e-08   2.459e-08
Double BB
Spectral model: bbodyrad<1> + bbodyrad<2>
------------------------------------------------------------
Parameters  : value         Lower 90%    Upper 90%
kT1 [keV]   : 6.77853        (-6.77888      -6.77888)
R1^2/D10^2  : 0.441225        (-0.44115      1.6605)
kT2 [keV]   : 31.8680        (-31.8688      -31.8688)
R2^2/D10^2  : 5.80710E-03    (-0.0058066   0.0293512)
------------------------------------------------------------
#Fit statistic : Chi-Squared =          58.15 using 59 PHA bins.
# Reduced chi-squared =          1.057 for     55 degrees of freedom
# Null hypothesis probability =   3.600115e-01

Energy  Fluence     90% Error
[keV]   [erg/cm2]   [erg/cm2]
15- 25  4.034e-09   2.498e-09
25- 50  9.658e-09   5.040e-09
50-150  3.983e-08   2.252e-08
15-150  5.352e-08   3.009e-08
Pre-slew spectrum (Pre-slew PHA with pre-slew DRM)
Power-law model

Spectral model in power-law:
------------------------------------------------------------
Parameters  : value       lower 90%   higher 90%
Photon index: 1.77470     ( -0.461334   0.512736 )
Norm@50keV  : 7.10450E-04    ( -0.000225576   0.000211708 )
------------------------------------------------------------
#Fit statistic : Chi-Squared =          58.73 using 59 PHA bins.
# Reduced chi-squared =          1.030 for     57 degrees of freedom
# Null hypothesis probability =   4.118688e-01

Photon flux (15-150 keV)    in 37.26 sec: 9.69547E-02 ( -0.0241207  0.0241207 ) ph/cm2/s
Energy fluence (15-150 keV)             : 2.43948e-07 ( -7.52674e-08  7.9587e-08 ) ergs/cm2
Cutoff power-law model

Spectral model in the cutoff power-law:
------------------------------------------------------------
Parameters  : value       lower 90%   higher 90%
Photon index: 1.70911     ( -1.65304   1.05437 )
Epeak [keV] : 193.348      (   )
Norm@50keV  : 7.73287E-04    (     )
------------------------------------------------------------
#Fit statistic : Chi-Squared =          58.75 using 59 PHA bins.
# Reduced chi-squared =          1.049 for     56 degrees of freedom
# Null hypothesis probability =   3.751498e-01

Photon flux (15-150 keV)    in 37.26 sec: 9.69238E-02 ( -0.0241134  0.0241132 ) ph/cm2/s
Energy fluence (15-150 keV)             : 2.44128e-07 ( -8.2633e-08  7.8499e-08 ) ergs/cm2
Band function
Spectral model in the Band function:
------------------------------------------------------------
Parameters  : value       lower 90%   higher 90%
alpha       : 3.53501   ( 1.07096   1.07096 )
beta        : -1.86394    ( 1.82503   0.503276 )
Epeak [keV] : 21.7534      ( -32.0128 -32.0128 )
Norm@50keV   : 16.0672    ( -17.3087   91.8513 )
------------------------------------------------------------
#Fit statistic : Chi-Squared =          58.43 using 59 PHA bins.
# Reduced chi-squared =          1.062 for     55 degrees of freedom
# Null hypothesis probability =   3.506751e-01

Photon flux (15-150 keV)    in 37.26 sec:  (    ) ph/cm2/s
Energy fluence (15-150 keV)             : 0 ( 0  0 ) ergs/cm2
S(25-50 keV) vs. S(50-100 keV) plot

S(25-50 keV)  = 9.67e-08
S(50-100 keV) = 9.76e-08
T90 vs. Hardness ratio plot
T90                                   = 60.3520000576973 sec.
Hardness ratio (energy fluence ratio) = 1.00931
Color vs. Color plot
Count Ratio  (25-50 keV) / (15-25 keV) = 0.973617
Count Ratio (50-100 keV) / (15-25 keV) = 0.609078
Mask shadow pattern
IMX = -0.156082287016, IMY = 0.406797878943
TIME vs. PHA plot around the trigger time
Blue+Cyan dotted lines: Time interval of the scaled map
From 0.000000 to 4.096000
TIME vs. DetID plot around the trigger time

Blue+Cyan dotted lines: Time interval of the scaled map
From 0.000000 to 4.096000
100 us light curve (15-350 keV)
Blue+Cyan dotted lines: Time interval of the scaled map
From 0.000000 to 4.096000
Spacecraft aspect plot
Bright source in the pre-burst/pre-slew/post-slew images
Pre-burst image of 15-350 keV band
Time interval of the image:
-239.776000 0.864000

# RAcent  DECcent POSerr Theta    Phi  PeakCts   SNR AngSep     Name
#  [deg]    [deg]    ['] [deg]  [deg]                   [']
204.1511  14.9349    2.5  42.1   51.2   2.7104   4.6 ------	UNKNOWN
118.0222 -30.3914    3.7  58.9 -166.0   3.9058   3.1 ------	UNKNOWN
126.7742   6.6039    2.8  34.1 -124.8   1.1414   4.1 ------	UNKNOWN
Pre-slew background subtracted image of 15-350 keV band
Time interval of the image:
0.864000 38.124600

# RAcent  DECcent POSerr Theta    Phi  PeakCts   SNR AngSep     Name
#  [deg]    [deg]    ['] [deg]  [deg]                   [']
136.9113  14.0138    1.7  23.6 -111.0   0.5267   6.8 ------	UNKNOWN
Post-slew image of 15-350 keV band
Time interval of the image:
84.324590 962.238300

# RAcent  DECcent POSerr Theta    Phi  PeakCts   SNR AngSep     Name
#  [deg]    [deg]    ['] [deg]  [deg]                   [']
135.3829 -40.5700   21.7  54.6  165.3   1.4476   0.5    6.7	Vela X-1
176.0434  61.7297    2.4  55.2    5.1   9.6069   4.8 ------	UNKNOWN
142.5127  39.7415    2.8  26.2   -6.5   1.9477   4.1 ------	UNKNOWN
112.4325  55.4360    3.2  45.6  -35.5   3.6084   3.7 ------	UNKNOWN
 93.6995 -21.3549    4.1  55.3 -145.3  11.2192   2.9 ------	UNKNOWN
Plot creation:
Thu Oct  8 20:21:40 EDT 2015