Click here for the BAT GCN circular template
Image
Pre-slew 15.0-350.0 keV image (Event data)
#   RAcent    DECcent   POSerr    Theta     Phi              Peak Cts       SNR   Name
  283.0009    -4.2576   0.0074    35.8019   178.0274         2.1497282     25.900 TRIG_00522197

Foreground time interval of the image:
 -8.752  17.789 (delta_t =  26.541 [sec])
Background time interval of the image:
-239.112  -8.752 (delta_t = 230.360 [sec])
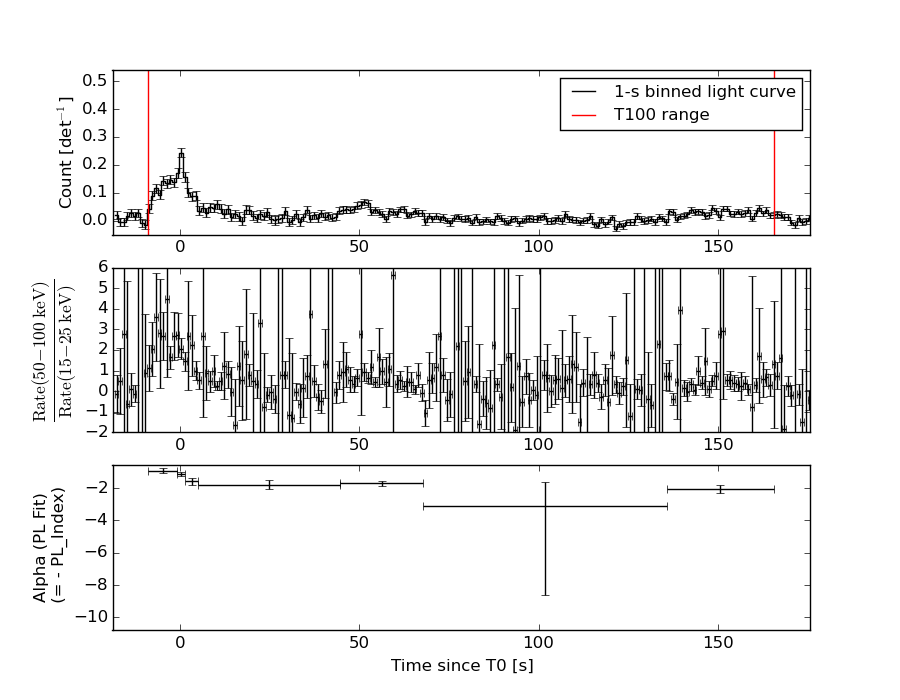
Lightcurves
Notes:
- 1) The mask-weighted light curves are using the flight position.
- 2) Multiple plots of different time binning/intervals are shown to cover all scenarios of short/long GRBs, rate/image triggers, and real/false positives.
- 3) For all the mask-weighted lightcurves, the y-axis units are counts/sec/det where a det is 0.4 x 0.4 = 0.16 sq cm.
- 4) The verticle lines correspond to following: green dotted lines are T50 interval, black dotted lines are T90 interval, blue solid line(s) is a spacecraft slew start time, and orange solid line(s) is a spacecraft slew end time.
- 5) Time of each bin is in the middle of the bin.
1 s binning
From T0-310 s to T0+310 s
From T100_start - 20 s to T100_end + 30 s

Full time interval
64 ms binning
Full time interval
From T100_start to T100_end
From T0-5 sec to T0+5 sec

16 ms binning
From T100_start-5 s to T100_start+5 s
Blue+Cyan dotted lines: Time interval of the scaled map
From 0.000000 to 1.024000
8 ms binning
From T100_start-3 s to T100_start+3 s
Blue+Cyan dotted lines: Time interval of the scaled map
From 0.000000 to 1.024000
2 ms binning
From T100_start-1 s to T100_start+1 s
Blue+Cyan dotted lines: Time interval of the scaled map
From 0.000000 to 1.024000
SN=5 or 10 sec. binning (whichever binning is satisfied first)
SN=5 or 10 sec. binning (T < 200 sec)

Quad-rate summed light curves (from T0-300s to T0+1000s)

The mask-weighted light curves based on cleaned DPHs

Spectral Evolution
Spectra
Notes:
- 1) The fitting includes the systematic errors.
- 2) When the burst includes telescope slew time periods, the fitting uses an average response file made from multiple 5-s response files through out the slew time plus single time preiod for the non-slew times, and weighted by the total counts in the corresponding time period using addrmf. An average response file is needed becuase a spectral fit using the pre-slew DRM will introduce some errors in both a spectral shape and a normalization if the PHA file contains a lot of the slew/post-slew time interval.
- 3) For fits to more complicated models (e.g. a power-law over a cutoff power-law), the BAT team has decided to require a chi-square improvement of more than 6 for each extra dof.
Time averaged spectrum fit using the average DRM
Power-law model
Time interval is from   -8.752 sec. to  165.552 sec.

Spectral model in power-law:
------------------------------------------------------------
Parameters  : value       lower 90%   higher 90%
Photon index: 1.56899     ( -0.102926   0.103266 )
Norm@50keV  : 1.71013E-03    ( -9.62951e-05   9.60499e-05 )
------------------------------------------------------------
#Fit statistic : Chi-Squared =          42.83 using 59 PHA bins.
# Reduced chi-squared =         0.7515 for     57 degrees of freedom
# Null hypothesis probability =   9.180779e-01

Photon flux (15-150 keV)    in 174.3 sec: 0.217702 ( -0.0129525  0.0130168 ) ph/cm2/s
Energy fluence (15-150 keV)             : 2.79872e-06 ( -1.67518e-07  1.68454e-07 ) ergs/cm2
Cutoff power-law model

Time interval is from   -8.752 sec. to  165.552 sec.
Spectral model in the cutoff power-law:
------------------------------------------------------------
Parameters  : value       lower 90%   higher 90%
Photon index: 1.42630     ( -0.409506   0.232262 )
Epeak [keV] : 209.758      ( -209.758 -209.758 )
Norm@50keV  : 2.00504E-03    ( -0.000378964   0.00111746 )
------------------------------------------------------------
#Fit statistic : Chi-Squared =          42.43 using 59 PHA bins.
# Reduced chi-squared =         0.7576 for     56 degrees of freedom
# Null hypothesis probability =   9.097567e-01

Photon flux (15-150 keV)    in 174.3 sec: 0.215738 ( -0.013905  0.013914 ) ph/cm2/s
Energy fluence (15-150 keV)             : 2.77134e-06 ( -1.84985e-07  1.83625e-07 ) ergs/cm2
Band function

Time interval is from   -8.752 sec. to  165.552 sec.

Spectral model in the Band function:
------------------------------------------------------------
Parameters  : value       lower 90%   higher 90%
alpha       : -1.42672   ( 1.31442   1.31442 )
beta        : -8.40360    ( 6.25161   16.2239 )
Epeak [keV] : 210.274      ( -90.3206 -210.274 )
Norm@50keV   : 2.00377E-03    ( -0.00011118   0.000384068 )
------------------------------------------------------------
#Fit statistic : Chi-Squared =          42.43 using 59 PHA bins.
# Reduced chi-squared =         0.7714 for     55 degrees of freedom
# Null hypothesis probability =   8.924333e-01

Photon flux (15-150 keV)    in 174.3 sec:  (    ) ph/cm2/s
Energy fluence (15-150 keV)             : 0 ( 0  0 ) ergs/cm2
Single BB
Spectral model blackbody:
------------------------------------------------------------
Parameters  : value    Lower 90%  Upper 90%
kT [keV]    : 15.4739  (  )
R^2/D10^2   : 2.10466E-02  (   )
(R is the radius in km and D10 is the distance to the source in units of 10 kpc)
------------------------------------------------------------
#Fit statistic : Chi-Squared =         120.02 using 59 PHA bins.
# Reduced chi-squared =         2.1056 for     57 degrees of freedom
# Null hypothesis probability =   2.172889e-06

Energy  Fluence     90% Error
[keV]   [erg/cm2]   [erg/cm2]
15- 25  1.829e-07   1.955e-08
25- 50  7.474e-07   5.830e-08
50-150  1.234e-06   1.326e-07
15-150  2.165e-06   1.534e-07
Thermal bremsstrahlung (OTTB)
Spectral model: thermal bremsstrahlung
------------------------------------------------------------
Parameters  : value         Lower 90%    Upper 90%
kT [keV]    : 199.278       (-47.4919      -199.287)
Norm        : 0.880335       (-0.0488638     0.0528682)
------------------------------------------------------------
#Fit statistic : Chi-Squared =          43.00 using 59 PHA bins.
# Reduced chi-squared =         0.7544 for     57 degrees of freedom
# Null hypothesis probability =   9.151549e-01

Energy  Fluence     90% Error
[keV]   [erg/cm2]   [erg/cm2]
15- 25  3.821e-07   2.527e-08
25- 50  7.350e-07   5.700e-08
50-150  1.612e-06   3.071e-07
15-150  2.729e-06   3.591e-07
Double BB
Spectral model: bbodyrad<1> + bbodyrad<2>
------------------------------------------------------------
Parameters  : value         Lower 90%    Upper 90%
kT1 [keV]   : 6.77020        (-1.39461      1.57737)
R1^2/D10^2  : 0.256904        (-0.130086      0.346707)
kT2 [keV]   : 25.9885        (-4.30184      7.18814)
R2^2/D10^2  : 2.75102E-03    (-0.00159355   0.00265994)
------------------------------------------------------------
#Fit statistic : Chi-Squared =          45.73 using 59 PHA bins.
# Reduced chi-squared =         0.8314 for     55 degrees of freedom
# Null hypothesis probability =   8.092149e-01

Energy  Fluence     90% Error
[keV]   [erg/cm2]   [erg/cm2]
15- 25  3.732e-07   8.950e-08
25- 50  7.266e-07   1.288e-07
50-150  1.645e-06   3.175e-07
15-150  2.745e-06   5.124e-07
Peak spectrum fit
Power-law model
Time interval is from    0.220 sec. to    1.220 sec.

Spectral model in power-law:
------------------------------------------------------------
Parameters  : value       lower 90%   higher 90%
Photon index: 1.17889     ( -0.194741   0.188327 )
Norm@50keV  : 1.66312E-02    ( -0.00185211   0.00184041 )
------------------------------------------------------------
#Fit statistic : Chi-Squared =          67.59 using 59 PHA bins.
# Reduced chi-squared =          1.186 for     57 degrees of freedom
# Null hypothesis probability =   1.592105e-01

Photon flux (15-150 keV)    in 1 sec: 1.94656 ( -0.231376  0.233057 ) ph/cm2/s
Energy fluence (15-150 keV)             : 1.69753e-07 ( -1.89458e-08  1.89855e-08 ) ergs/cm2
Cutoff power-law model
Time interval is from    0.220 sec. to    1.220 sec.
Spectral model in the cutoff power-law:
------------------------------------------------------------
Parameters  : value       lower 90%   higher 90%
Photon index: 0.932817     ( -0.834577   0.411365 )
Epeak [keV] : 254.531      ( -254.531 -254.531 )
Norm@50keV  : 2.13101E-02    ( -0.00791177   0.0259825 )
------------------------------------------------------------
#Fit statistic : Chi-Squared =          67.26 using 59 PHA bins.
# Reduced chi-squared =          1.201 for     56 degrees of freedom
# Null hypothesis probability =   1.441080e-01

Photon flux (15-150 keV)    in 1 sec: 1.92384 ( -0.24057  0.24175 ) ph/cm2/s
Energy fluence (15-150 keV)             : 1.6838e-07 ( -1.9664e-08  1.9508e-08 ) ergs/cm2
Band function
Time interval is from    0.220 sec. to    1.220 sec.

Spectral model in the Band function:
------------------------------------------------------------
Parameters  : value       lower 90%   higher 90%
alpha       : 0.734337   ( 0.180128   0.180128 )
beta        : -1.26389    ( 1.24   0.229443 )
Epeak [keV] : 45.9479      ( -45.9012 180.276 )
Norm@50keV   : 0.282137    ( -0.313729   113.528 )
------------------------------------------------------------
#Fit statistic : Chi-Squared =          66.67 using 59 PHA bins.
# Reduced chi-squared =          1.212 for     55 degrees of freedom
# Null hypothesis probability =   1.345755e-01

Photon flux (15-150 keV)    in 1 sec:  (    ) ph/cm2/s
Energy fluence (15-150 keV)             : 0 ( 0  0 ) ergs/cm2
Single BB
Spectral model blackbody:
------------------------------------------------------------
Parameters  : value    Lower 90%  Upper 90%
kT [keV]    : 21.3992  (-2.82637  3.47393)
R^2/D10^2   : 7.20241E-02  (-0.028364   0.0439741)
(R is the radius in km and D10 is the distance to the source in units of 10 kpc)
------------------------------------------------------------
#Fit statistic : Chi-Squared =          82.20 using 59 PHA bins.
# Reduced chi-squared =          1.442 for     57 degrees of freedom
# Null hypothesis probability =   1.611002e-02

Energy  Fluence     90% Error
[keV]   [erg/cm2]   [erg/cm2]
15- 25  6.180e-09   1.473e-09
25- 50  3.214e-08   5.895e-09
50-150  1.098e-07   1.997e-08
15-150  1.482e-07   2.125e-08
Thermal bremsstrahlung (OTTB)
Spectral model: thermal bremsstrahlung
------------------------------------------------------------
Parameters  : value         Lower 90%    Upper 90%
kT [keV]    : 200.000       (      )
Norm        : 8.40430       (-0.930649     0.930424)
------------------------------------------------------------
#Fit statistic : Chi-Squared =          79.33 using 59 PHA bins.
# Reduced chi-squared =          1.392 for     57 degrees of freedom
# Null hypothesis probability =   2.690696e-02

Energy  Fluence     90% Error
[keV]   [erg/cm2]   [erg/cm2]
15- 25  2.094e-08   1.168e-08
25- 50  4.027e-08   2.215e-08
50-150  8.833e-08   4.798e-08
15-150  1.495e-07   8.180e-08
Double BB

Spectral model: bbodyrad<1> + bbodyrad<2>
------------------------------------------------------------
Parameters  : value         Lower 90%    Upper 90%
kT1 [keV]   : 7.68904        (-2.5806      4.74595)
R1^2/D10^2  : 1.15647        (-0.877424      3.77245)
kT2 [keV]   : 31.3915        (-7.48704      31.2678)
R2^2/D10^2  : 1.77153E-02    (-0.0154694   0.0277606)
------------------------------------------------------------
#Fit statistic : Chi-Squared =          66.92 using 59 PHA bins.
# Reduced chi-squared =          1.217 for     55 degrees of freedom
# Null hypothesis probability =   1.300372e-01

Energy  Fluence     90% Error
[keV]   [erg/cm2]   [erg/cm2]
15- 25  1.464e-08   8.077e-09
25- 50  3.624e-08   1.685e-08
50-150  1.184e-07   5.845e-08
15-150  1.693e-07   7.284e-08
Pre-slew spectrum (Pre-slew PHA with pre-slew DRM)
Power-law model
Spectral model in power-law:
------------------------------------------------------------
Parameters  : value       lower 90%   higher 90%
Photon index: 1.23858     ( -0.101643   0.100144 )
Norm@50keV  : 5.80596E-03    ( -0.000332102   0.000331237 )
------------------------------------------------------------
#Fit statistic : Chi-Squared =          44.48 using 59 PHA bins.
# Reduced chi-squared =         0.7803 for     57 degrees of freedom
# Null hypothesis probability =   8.864377e-01

Photon flux (15-150 keV)    in 26.54 sec: 0.685433 ( -0.0427151  0.042951 ) ph/cm2/s
Energy fluence (15-150 keV)             : 1.54681e-06 ( -8.91245e-08  8.92423e-08 ) ergs/cm2
Cutoff power-law model
Spectral model in the cutoff power-law:
------------------------------------------------------------
Parameters  : value       lower 90%   higher 90%
Photon index: 0.802338     ( -0.440648   0.398858 )
Epeak [keV] : 162.508      ( -52.9219 785.956 )
Norm@50keV  : 8.92056E-03    ( -0.00283869   0.00458135 )
------------------------------------------------------------
#Fit statistic : Chi-Squared =          40.96 using 59 PHA bins.
# Reduced chi-squared =         0.7315 for     56 degrees of freedom
# Null hypothesis probability =   9.342212e-01

Photon flux (15-150 keV)    in 26.54 sec: 0.667065 ( -0.045611  0.045853 ) ph/cm2/s
Energy fluence (15-150 keV)             : 1.519e-06 ( -9.39569e-08  9.35296e-08 ) ergs/cm2
Band function

Spectral model in the Band function:
------------------------------------------------------------
Parameters  : value       lower 90%   higher 90%
alpha       : -0.802562   ( -0.326052   0.439427 )
beta        : -10.0000    ( 10   1.77636e-15 )
Epeak [keV] : 162.539      ( -50.32 784.871 )
Norm@50keV   : 8.91816E-03    ( -0.00283356   0.00458545 )
------------------------------------------------------------
#Fit statistic : Chi-Squared =          40.96 using 59 PHA bins.
# Reduced chi-squared =         0.7448 for     55 degrees of freedom
# Null hypothesis probability =   9.203983e-01

Photon flux (15-150 keV)    in 26.54 sec:  (    ) ph/cm2/s
Energy fluence (15-150 keV)             : 0 ( 0  0 ) ergs/cm2
S(25-50 keV) vs. S(50-100 keV) plot
S(25-50 keV)  = 7.15e-07
S(50-100 keV) = 9.64e-07
T90 vs. Hardness ratio plot
T90                                   = 164.343999922276 sec.
Hardness ratio (energy fluence ratio) = 1.34825
Color vs. Color plot
Count Ratio  (25-50 keV) / (15-25 keV) = 1.26026
Count Ratio (50-100 keV) / (15-25 keV) = 0.965091
Mask shadow pattern
IMX = -7.208451500834410E-01, IMY = -2.482760794484370E-02
TIME vs. PHA plot around the trigger time
Blue+Cyan dotted lines: Time interval of the scaled map
From 0.000000 to 1.024000
TIME vs. DetID plot around the trigger time
Blue+Cyan dotted lines: Time interval of the scaled map
From 0.000000 to 1.024000
100 us light curve (15-350 keV)
Blue+Cyan dotted lines: Time interval of the scaled map
From 0.000000 to 1.024000
Spacecraft aspect plot
Bright source in the pre-burst/pre-slew/post-slew images
Pre-burst image of 15-350 keV band
Time interval of the image:
-239.112000 -8.752000

# RAcent  DECcent POSerr Theta    Phi  PeakCts   SNR AngSep     Name
#  [deg]    [deg]    ['] [deg]  [deg]                   [']
186.6599 -62.7748    0.9  53.4    1.7  11.0447  12.3    0.3	GX 301-2
244.9752 -15.6435    0.3  27.8  100.5  18.7592  43.6    0.3	Sco X-1
255.9871 -37.8480    1.1   7.9   43.9   2.7467  10.8    0.2	4U 1700-377
256.4585 -36.4681    4.1   7.5   54.1   0.6896   2.8    2.9	GX 349+2
262.8383 -24.7094    8.3  11.9  134.7   0.3451   1.4    9.6	GX 1+4
264.4923 -44.4514    6.1   8.2  -25.9   0.4406   1.9   10.7	4U 1735-44
268.3704  -1.4587   22.5  35.0  152.2   0.2290   0.5    0.4	SW J1753.5-0127
270.2600 -24.9910    2.9  12.0  167.7   0.9451   3.9    5.5	GX 5-1
270.2286 -25.7325    4.4  11.3  168.7   0.6397   2.6    4.0	GRS 1758-258
273.9861 -14.1953    8.4  23.4  168.2   0.3510   1.4    9.6	GX 17+2
275.9359 -30.2456    4.8  10.5 -155.1   0.6117   2.4    7.3	H1820-303
285.0482 -24.9167    3.5  20.1 -151.6   0.8230   3.3    0.7	HT1900.1-2455
288.7744  10.9877    4.2  52.1  176.8   2.1608   2.7    2.9	GRS 1915+105
262.9128 -33.8688    5.2   3.4  103.7  -0.4880  -2.2    4.3	GX 354-0
248.4980 -47.3751    0.8  16.9   11.5   3.7855  14.9 ------	UNKNOWN
303.8122 -14.8485    3.6  40.1 -144.7   1.1972   3.2 ------	UNKNOWN
313.3851 -14.2450    4.2  47.8 -137.1   2.1924   2.8 ------	UNKNOWN
315.0062 -50.7487    4.2  37.7  -84.0   2.1232   2.8 ------	UNKNOWN
323.1573 -64.3985    4.3  43.8  -64.1   3.5256   2.7 ------	UNKNOWN
317.0733 -19.0599    3.2  48.0 -129.1   4.2553   3.6 ------	UNKNOWN
317.9627 -29.1741    4.5  43.9 -116.1   3.3808   2.6 ------	UNKNOWN
Pre-slew background subtracted image of 15-350 keV band
Time interval of the image:
-8.752000 17.788600

# RAcent  DECcent POSerr Theta    Phi  PeakCts   SNR AngSep     Name
#  [deg]    [deg]    ['] [deg]  [deg]                   [']
186.6304 -62.8068    3.8  53.4    1.7  -0.6305  -3.1    2.3	GX 301-2
244.9806 -15.6738    4.6  27.7  100.5   0.2644   2.5    2.0	Sco X-1
256.1851 -37.8858    9.9   7.8   43.5   0.0699   1.2    9.7	4U 1700-377
256.2104 -36.4129    6.4   7.7   54.4   0.1122   1.8   10.9	GX 349+2
263.1990 -24.7558    8.0  11.8  136.2   0.0880   1.4   10.4	GX 1+4
264.5432 -44.3961   12.3   8.1  -26.1  -0.0565  -0.9    9.1	4U 1735-44
268.3182  -1.5895    3.4  34.8  152.2  -0.3473  -3.4    8.7	SW J1753.5-0127
270.2096 -24.9037   13.8  12.1  167.3  -0.0523  -0.8   11.3	GX 5-1
270.2444 -25.5405    0.0  11.5  168.4   0.0567   0.9   12.6	GRS 1758-258
273.9349 -13.9677   19.9  23.6  167.9  -0.0384  -0.6    5.8	GX 17+2
276.0344 -30.5102    7.9  10.4 -153.7   0.0867   1.4   10.3	H1820-303
285.0315 -24.9223   13.0  20.1 -151.6  -0.0512  -0.9    0.3	HT1900.1-2455
288.6746  10.9168    6.2  52.0  176.7  -0.3736  -1.9    7.5	GRS 1915+105
262.9135 -33.9729    7.4   3.3  102.5  -0.0954  -1.6    9.1	GX 354-0
263.4266  13.8357    2.2  50.2  144.7   1.7190   5.2 ------	UNKNOWN
283.0009  -4.2576    0.4  35.8  178.0   2.1499  25.9 ------	UNKNOWN
Post-slew image of 15-350 keV band
Time interval of the image:
88.988600 962.946300

# RAcent  DECcent POSerr Theta    Phi  PeakCts   SNR AngSep     Name
#  [deg]    [deg]    ['] [deg]  [deg]                   [']
244.9902 -15.6422    0.6  39.1   90.9  62.2163  20.0    0.6	Sco X-1
254.6130  35.3101    4.6  47.7  168.9  -4.0187  -2.5    7.9	Her X-1
255.9469 -37.7882    5.2  41.6   53.3   4.8908   2.2    3.8	4U 1700-377
256.5101 -36.3936    3.8  40.3   54.3   6.4059   3.0    4.0	GX 349+2
263.0065 -24.8193    4.1  28.1   61.7   2.6042   2.8    4.4	GX 1+4
264.8835 -44.3575    5.4  43.1   39.6   4.0519   2.1    8.2	4U 1735-44
268.4231  -1.4525    3.1  14.8  121.1   2.2514   3.8    3.3	SW J1753.5-0127
270.2144 -25.1285    4.1  24.2   49.8   2.0967   2.8    4.8	GX 5-1
270.3377 -25.6821    3.2  24.6   48.9   2.8811   3.9    4.1	GRS 1758-258
274.0456 -14.1461    3.5  13.3   61.8   1.9032   3.3    7.0	GX 17+2
276.0309 -30.3741    3.8  26.9   34.0   2.1585   3.0    5.5	H1820-303
284.9224 -25.0415    8.5  20.9   15.7   0.8217   1.4    9.5	HT1900.1-2455
288.8135  10.9318    0.6  16.3 -138.7  11.7450  19.6    1.2	GRS 1915+105
299.5758  35.2054    0.8  42.4 -139.2  18.2812  14.6    0.7	Cyg X-1
263.1061 -33.6903 2171.5  34.8   50.4  -0.0059  -0.0   10.4	GX 354-0
286.7575  53.5928    3.9  57.9 -156.8  12.7890   3.0 ------	UNKNOWN
300.7652  48.7532    5.8  55.2 -145.3  10.3581   2.0 ------	UNKNOWN
310.8451  36.0527    3.8  48.0 -128.9   8.9128   3.0 ------	UNKNOWN
Plot creation:
Sat May 30 19:33:17 EDT 2015