Special notes of this burst
Image
Pre-slew 15.0-350.0 keV image (Event data)
#   RAcent    DECcent   POSerr    Theta     Phi              Peak Cts       SNR   Name
  148.6869   -49.4244   0.0140    13.1385   -32.7837         0.1131131     13.636 TRIG_00522578

Foreground time interval of the image:
 -0.008   0.568 (delta_t =   0.576 [sec])
Background time interval of the image:
-597.067 -578.595 (delta_t =  18.472 [sec])
-239.168  -0.008 (delta_t = 239.160 [sec])
Lightcurves
Notes:
- 1) The mask-weighted light curves are using the flight position.
- 2) Multiple plots of different time binning/intervals are shown to cover all scenarios of short/long GRBs, rate/image triggers, and real/false positives.
- 3) For all the mask-weighted lightcurves, the y-axis units are counts/sec/det where a det is 0.4 x 0.4 = 0.16 sq cm.
- 4) The verticle lines correspond to following: green dotted lines are T50 interval, black dotted lines are T90 interval, blue solid line(s) is a spacecraft slew start time, and orange solid line(s) is a spacecraft slew end time.
- 5) Time of each bin is in the middle of the bin.
1 s binning
From T0-310 s to T0+310 s
From T100_start - 20 s to T100_end + 30 s
Full time interval

64 ms binning
Full time interval
From T100_start to T100_end
From T0-5 sec to T0+5 sec
16 ms binning
From T100_start-5 s to T100_start+5 s
Blue+Cyan dotted lines: Time interval of the scaled map
From 0.000000 to 0.512000
8 ms binning
From T100_start-3 s to T100_start+3 s
Blue+Cyan dotted lines: Time interval of the scaled map
From 0.000000 to 0.512000
2 ms binning
From T100_start-1 s to T100_start+1 s

Blue+Cyan dotted lines: Time interval of the scaled map
From 0.000000 to 0.512000
SN=5 or 10 sec. binning (whichever binning is satisfied first)
SN=5 or 10 sec. binning (T < 200 sec)
Quad-rate summed light curves (from T0-300s to T0+1000s)
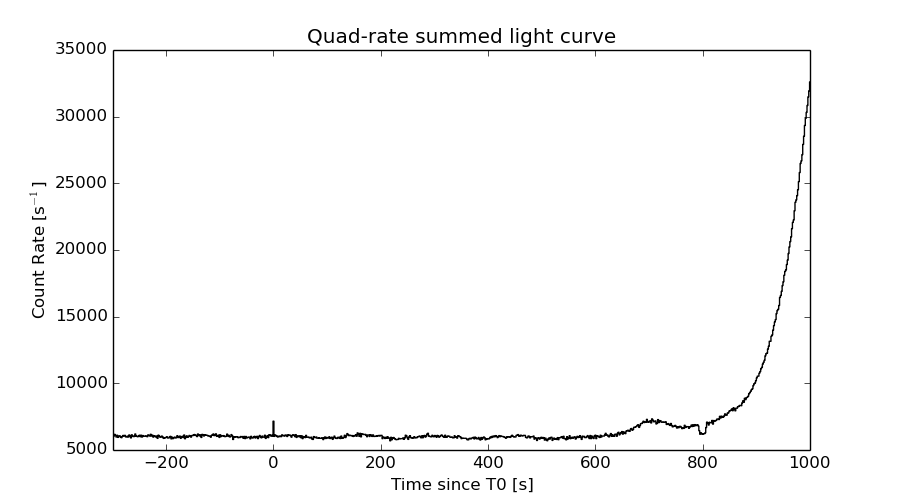
The mask-weighted light curves based on cleaned DPHs

Spectral Evolution

Spectra
Notes:
- 1) The fitting includes the systematic errors.
- 2) When the burst includes telescope slew time periods, the fitting uses an average response file made from multiple 5-s response files through out the slew time plus single time preiod for the non-slew times, and weighted by the total counts in the corresponding time period using addrmf. An average response file is needed becuase a spectral fit using the pre-slew DRM will introduce some errors in both a spectral shape and a normalization if the PHA file contains a lot of the slew/post-slew time interval.
- 3) For fits to more complicated models (e.g. a power-law over a cutoff power-law), the BAT team has decided to require a chi-square improvement of more than 6 for each extra dof.
Time averaged spectrum fit using the average DRM
Power-law model

Time interval is from   -0.008 sec. to    0.568 sec.

Spectral model in power-law:
------------------------------------------------------------
Parameters  : value       lower 90%   higher 90%
Photon index: 1.00943     ( -0.224853   0.218693 )
Norm@50keV  : 1.26532E-02    ( -0.0015916   0.00158927 )
------------------------------------------------------------
#Fit statistic : Chi-Squared =          47.10 using 59 PHA bins.
# Reduced chi-squared =         0.8264 for     57 degrees of freedom
# Null hypothesis probability =   8.220801e-01

Photon flux (15-150 keV)    in 0.576 sec: 1.45733 ( -0.184996  0.185613 ) ph/cm2/s
Energy fluence (15-150 keV)             : 7.85111e-08 ( -1.11058e-08  1.12894e-08 ) ergs/cm2
Cutoff power-law model

Time interval is from   -0.008 sec. to    0.568 sec.
Spectral model in the cutoff power-law:
------------------------------------------------------------
Parameters  : value       lower 90%   higher 90%
Photon index: 0.391049     ( -1.01425   0.713982 )
Epeak [keV] : 142.865      (   )
Norm@50keV  : 2.44153E-02    (     )
------------------------------------------------------------
#Fit statistic : Chi-Squared =          45.47 using 59 PHA bins.
# Reduced chi-squared =         0.8120 for     56 degrees of freedom
# Null hypothesis probability =   8.415114e-01

Photon flux (15-150 keV)    in 0.576 sec: 1.41598 ( -0.19052  0.19352 ) ph/cm2/s
Energy fluence (15-150 keV)             : 7.52187e-08 ( -1.23016e-08  1.22498e-08 ) ergs/cm2
Band function

Time interval is from   -0.008 sec. to    0.568 sec.

Spectral model in the Band function:
------------------------------------------------------------
Parameters  : value       lower 90%   higher 90%
alpha       : -0.391047   ( -0.575859   1.00363 )
beta        : -10.0000    ( 10   0 )
Epeak [keV] : 142.849      ( -58.56 202.733 )
Norm@50keV   : 2.44152E-02    ( -0.0127103   0.0437672 )
------------------------------------------------------------
#Fit statistic : Chi-Squared =          45.47 using 59 PHA bins.
# Reduced chi-squared =         0.8268 for     55 degrees of freedom
# Null hypothesis probability =   8.165054e-01

Photon flux (15-150 keV)    in 0.576 sec: 1.43354 (    ) ph/cm2/s
Energy fluence (15-150 keV)             : 0 ( 0  0 ) ergs/cm2
Single BB
Spectral model blackbody:
------------------------------------------------------------
Parameters  : value    Lower 90%  Upper 90%
kT [keV]    : 20.9234  (-3.43921  4.34867)
R^2/D10^2   : 6.05653E-02  (-0.0267199   0.0461882)
(R is the radius in km and D10 is the distance to the source in units of 10 kpc)
------------------------------------------------------------
#Fit statistic : Chi-Squared =          52.47 using 59 PHA bins.
# Reduced chi-squared =         0.9206 for     57 degrees of freedom
# Null hypothesis probability =   6.453399e-01

Energy  Fluence     90% Error
[keV]   [erg/cm2]   [erg/cm2]
15- 25  2.890e-09   7.468e-10
25- 50  1.482e-08   2.863e-09
50-150  4.834e-08   1.175e-08
15-150  6.606e-08   1.208e-08
Thermal bremsstrahlung (OTTB)

Spectral model: thermal bremsstrahlung
------------------------------------------------------------
Parameters  : value         Lower 90%    Upper 90%
kT [keV]    : 200.000       (      )
Norm        : 5.81069       (-0.761057     0.761043)
------------------------------------------------------------
#Fit statistic : Chi-Squared =          61.64 using 59 PHA bins.
# Reduced chi-squared =          1.081 for     57 degrees of freedom
# Null hypothesis probability =   3.138190e-01

Energy  Fluence     90% Error
[keV]   [erg/cm2]   [erg/cm2]
15- 25  8.335e-09   4.674e-09
25- 50  1.603e-08   8.893e-09
50-150  3.517e-08   1.962e-08
15-150  5.954e-08   3.318e-08
Double BB

Spectral model: bbodyrad<1> + bbodyrad<2>
------------------------------------------------------------
Parameters  : value         Lower 90%    Upper 90%
kT1 [keV]   : 0.102194        (0.822496      -0.102194)
R1^2/D10^2  : 1.25365E+18        (-1.25366e+18      -1.25366e+18)
kT2 [keV]   : 20.9342        (-3.44228      4.3456)
R2^2/D10^2  : 6.04704E-02    (-0.0266958   0.0462154)
------------------------------------------------------------
#Fit statistic : Chi-Squared =          52.47 using 59 PHA bins.
# Reduced chi-squared =         0.9541 for     55 degrees of freedom
# Null hypothesis probability =   5.717304e-01

Energy  Fluence     90% Error
[keV]   [erg/cm2]   [erg/cm2]
15- 25  0.000e+00   0.000e+00
25- 50  0.000e+00   0.000e+00
50-150  0.000e+00   0.000e+00
15-150  0.000e+00   0.000e+00
Peak spectrum fit
Power-law model
Time interval is from   -0.188 sec. to    0.812 sec.

Spectral model in power-law:
------------------------------------------------------------
Parameters  : value       lower 90%   higher 90%
Photon index: 0.863632     ( -0.256454   0.244189 )
Norm@50keV  : 7.74876E-03    ( -0.0011408   0.00113154 )
------------------------------------------------------------
#Fit statistic : Chi-Squared =          42.38 using 59 PHA bins.
# Reduced chi-squared =         0.7435 for     57 degrees of freedom
# Null hypothesis probability =   9.255783e-01

Photon flux (15-150 keV)    in 1 sec: 0.889374 ( -0.129586  0.130094 ) ph/cm2/s
Energy fluence (15-150 keV)             : 8.8216e-08 ( -1.35646e-08  1.37085e-08 ) ergs/cm2
Cutoff power-law model

Time interval is from   -0.188 sec. to    0.812 sec.
Spectral model in the cutoff power-law:
------------------------------------------------------------
Parameters  : value       lower 90%   higher 90%
Photon index: -9.77873E-02     ( -1.28316   0.972507 )
Epeak [keV] : 127.854      ( -43.0824 5353.09 )
Norm@50keV  : 2.00406E-02    ( -0.0121298   0.0445453 )
------------------------------------------------------------
#Fit statistic : Chi-Squared =          39.57 using 59 PHA bins.
# Reduced chi-squared =         0.7065 for     56 degrees of freedom
# Null hypothesis probability =   9.528179e-01

Photon flux (15-150 keV)    in 1 sec: 0.851636 ( -0.134801  0.135475 ) ph/cm2/s
Energy fluence (15-150 keV)             : 8.38431e-08 ( -1.47512e-08  1.4711e-08 ) ergs/cm2
Band function

Time interval is from   -0.188 sec. to    0.812 sec.

Spectral model in the Band function:
------------------------------------------------------------
Parameters  : value       lower 90%   higher 90%
alpha       : 9.51423E-02   ( -0.780444   1.39256 )
beta        : -10.0000    ( 10   8.88178e-15 )
Epeak [keV] : 128.022      ( -41.8345 284.339 )
Norm@50keV   : 1.99930E-02    ( -0.0120479   0.044522 )
------------------------------------------------------------
#Fit statistic : Chi-Squared =          39.57 using 59 PHA bins.
# Reduced chi-squared =         0.7194 for     55 degrees of freedom
# Null hypothesis probability =   9.420289e-01

Photon flux (15-150 keV)    in 1 sec: 0.868777 (    ) ph/cm2/s
Energy fluence (15-150 keV)             : 0 ( 0  0 ) ergs/cm2
Single BB
Spectral model blackbody:
------------------------------------------------------------
Parameters  : value    Lower 90%  Upper 90%
kT [keV]    : 23.7830  (-4.17814  5.51039)
R^2/D10^2   : 2.60165E-02  (-0.0120559   0.0211234)
(R is the radius in km and D10 is the distance to the source in units of 10 kpc)
------------------------------------------------------------
#Fit statistic : Chi-Squared =          42.19 using 59 PHA bins.
# Reduced chi-squared =         0.7402 for     57 degrees of freedom
# Null hypothesis probability =   9.286308e-01

Energy  Fluence     90% Error
[keV]   [erg/cm2]   [erg/cm2]
15- 25  2.623e-09   8.215e-10
25- 50  1.450e-08   3.676e-09
50-150  6.114e-08   1.667e-08
15-150  7.826e-08   1.869e-08
Thermal bremsstrahlung (OTTB)
Spectral model: thermal bremsstrahlung
------------------------------------------------------------
Parameters  : value         Lower 90%    Upper 90%
kT [keV]    : 200.000       (      )
Norm        : 3.53029       (-0.540367     0.540347)
------------------------------------------------------------
#Fit statistic : Chi-Squared =          61.62 using 59 PHA bins.
# Reduced chi-squared =          1.081 for     57 degrees of freedom
# Null hypothesis probability =   3.144132e-01

Energy  Fluence     90% Error
[keV]   [erg/cm2]   [erg/cm2]
15- 25  8.792e-09   5.085e-09
25- 50  1.691e-08   9.490e-09
50-150  3.709e-08   2.092e-08
15-150  6.280e-08   3.563e-08
Double BB

R1^2/D10^2  : 9.87372E+08        (      )
kT2 [keV]   : 24.2154        (-4.35174      5.80095)
R2^2/D10^2  : 2.44968E-02    (-0.00707847   0.0105493)
------------------------------------------------------------
#Fit statistic : Chi-Squared =          42.19 using 59 PHA bins.
#Fit statistic : Chi-Squared =          40.42 using 59 PHA bins.
#Fit statistic : Chi-Squared =          40.16 using 59 PHA bins.
# Reduced chi-squared =         0.7671 for     55 degrees of freedom
# Reduced chi-squared =         0.7349 for     55 degrees of freedom
# Reduced chi-squared =         0.7302 for     55 degrees of freedom
# Null hypothesis probability =   8.973831e-01
# Null hypothesis probability =   9.294318e-01
# Null hypothesis probability =   9.334416e-01

Energy  Fluence     90% Error
[keV]   [erg/cm2]   [erg/cm2]
15- 25  0.000e+00   0.000e+00
25- 50  0.000e+00   0.000e+00
50-150  0.000e+00   0.000e+00
15-150  0.000e+00   0.000e+00
Pre-slew spectrum (Pre-slew PHA with pre-slew DRM)
Power-law model

Spectral model in power-law:
------------------------------------------------------------
Parameters  : value       lower 90%   higher 90%
Photon index: 1.00943     ( -0.224853   0.218693 )
Norm@50keV  : 1.26532E-02    ( -0.0015916   0.00158927 )
------------------------------------------------------------
#Fit statistic : Chi-Squared =          47.10 using 59 PHA bins.
# Reduced chi-squared =         0.8264 for     57 degrees of freedom
# Null hypothesis probability =   8.220801e-01

Photon flux (15-150 keV)    in 0.576 sec: 1.45733 ( -0.184996  0.185613 ) ph/cm2/s
Energy fluence (15-150 keV)             : 7.85111e-08 ( -1.11058e-08  1.12894e-08 ) ergs/cm2
Cutoff power-law model
Spectral model in the cutoff power-law:
------------------------------------------------------------
Parameters  : value       lower 90%   higher 90%
Photon index: 0.391049     ( -1.01425   0.713982 )
Epeak [keV] : 142.865      (   )
Norm@50keV  : 2.44153E-02    (     )
------------------------------------------------------------
#Fit statistic : Chi-Squared =          45.47 using 59 PHA bins.
# Reduced chi-squared =         0.8120 for     56 degrees of freedom
# Null hypothesis probability =   8.415114e-01

Photon flux (15-150 keV)    in 0.576 sec: 1.41598 ( -0.19051  0.19352 ) ph/cm2/s
Energy fluence (15-150 keV)             : 7.52187e-08 ( -1.23016e-08  1.22498e-08 ) ergs/cm2
Band function

Spectral model in the Band function:
------------------------------------------------------------
Parameters  : value       lower 90%   higher 90%
alpha       : -0.391086   ( -0.575399   1.00655 )
beta        : -10.0000    ( 10   2.91323e-13 )
Epeak [keV] : 142.855      ( -58.5663 202.765 )
Norm@50keV   : 2.44142E-02    ( -0.0127092   0.0437682 )
------------------------------------------------------------
#Fit statistic : Chi-Squared =          45.47 using 59 PHA bins.
# Reduced chi-squared =         0.8268 for     55 degrees of freedom
# Null hypothesis probability =   8.165054e-01

Photon flux (15-150 keV)    in 0.576 sec: 1.43354 (    ) ph/cm2/s
Energy fluence (15-150 keV)             : 0 ( 0  0 ) ergs/cm2
S(25-50 keV) vs. S(50-100 keV) plot
S(25-50 keV)  = 1.46e-08
S(50-100 keV) = 2.91e-08
T90 vs. Hardness ratio plot
T90                                   = 0.51199996471405 sec.
Hardness ratio (energy fluence ratio) = 1.99315
Color vs. Color plot
Count Ratio  (25-50 keV) / (15-25 keV) = 2.3425
Count Ratio (50-100 keV) / (15-25 keV) = 2.26487
Mask shadow pattern
IMX = 1.962374582997249E-01, IMY = 1.263874497532329E-01
TIME vs. PHA plot around the trigger time
Blue+Cyan dotted lines: Time interval of the scaled map
From 0.000000 to 0.512000
TIME vs. DetID plot around the trigger time
Blue+Cyan dotted lines: Time interval of the scaled map
From 0.000000 to 0.512000
100 us light curve (15-350 keV)
Blue+Cyan dotted lines: Time interval of the scaled map
From 0.000000 to 0.512000
Spacecraft aspect plot

Bright source in the pre-burst/pre-slew/post-slew images
Pre-burst image of 15-350 keV band
Time interval of the image:
-597.067410 -578.595400
-239.168000 -0.008000

# RAcent  DECcent POSerr Theta    Phi  PeakCts   SNR AngSep     Name
#  [deg]    [deg]    ['] [deg]  [deg]                   [']
135.5277 -40.5514    1.0  25.6  -42.5   2.5028  11.3    0.2	Vela X-1
170.4156 -60.6790    1.4   4.0  115.7   1.4754   8.3    4.5	Cen X-3
186.7592 -62.6451    6.8  11.9  124.5   0.3270   1.7    8.0	GX 301-2
167.4864 -34.4646    2.5  25.6   20.0   0.9599   4.6 ------	UNKNOWN
147.5821  -5.8994    2.3  55.2   -7.6   3.2874   5.0 ------	UNKNOWN
140.2208  -4.7615    3.0  57.7  -16.0   3.5497   3.9 ------	UNKNOWN
  4.9577 -61.0240    3.7  57.9 -156.7   4.4599   3.1 ------	UNKNOWN
Pre-slew background subtracted image of 15-350 keV band
Time interval of the image:
-0.008000 0.568000

# RAcent  DECcent POSerr Theta    Phi  PeakCts   SNR AngSep     Name
#  [deg]    [deg]    ['] [deg]  [deg]                   [']
135.5011 -40.5285 1689.7  25.6  -42.5  -0.0001  -0.0    2.0	Vela X-1
170.1877 -60.5702    6.3   3.8  114.4   0.0174   1.8    4.9	Cen X-3
186.6296 -62.9368  189.5  11.8  126.0   0.0006   0.1   10.0	GX 301-2
148.6869 -49.4244    0.8  13.1  -32.8   0.1131  13.6 ------	UNKNOWN
134.4507  -5.0158    2.4  58.9  -22.6   0.2787   4.8 ------	UNKNOWN
 82.0477 -61.8363    2.2  36.7 -118.2   0.0897   5.2 ------	UNKNOWN
124.1715 -15.2011    2.2  52.7  -38.3   0.2162   5.2 ------	UNKNOWN
Post-slew image of 15-350 keV band
Time interval of the image:
56.732610 594.832600

# RAcent  DECcent POSerr Theta    Phi  PeakCts   SNR AngSep     Name
#  [deg]    [deg]    ['] [deg]  [deg]                   [']
135.5129 -40.5572    0.5  12.8  -64.5   8.1953  23.6    0.7	Vela X-1
170.2281 -60.6152    1.8  16.5  127.7   2.2579   6.3    2.6	Cen X-3
186.5374 -62.6991    4.6  24.4  124.0   1.0219   2.5    5.4	GX 301-2
 39.2723 -61.6824    2.7  55.5 -160.3   5.7018   4.3 ------	UNKNOWN
132.4172   3.0568    4.1  54.3  -33.3   6.0986   2.8 ------	UNKNOWN
 86.2622 -40.5752    3.6  43.7 -116.2   5.5674   3.2 ------	UNKNOWN
Plot creation:
Sat May 30 19:31:26 EDT 2015