Click here for the BAT GCN circular template
Image
Pre-slew 15.0-350.0 keV image (Event data)

#   RAcent    DECcent   POSerr    Theta     Phi              Peak Cts       SNR   Name
  197.0118   -52.7572   0.0117    29.9717   102.0933         2.4844132     16.436 TRIG_00522586

Foreground time interval of the image:
  0.352  57.645 (delta_t =  57.293 [sec])
Background time interval of the image:
-239.056 -40.898 (delta_t = 198.158 [sec])
-40.056   0.352 (delta_t =  40.408 [sec])
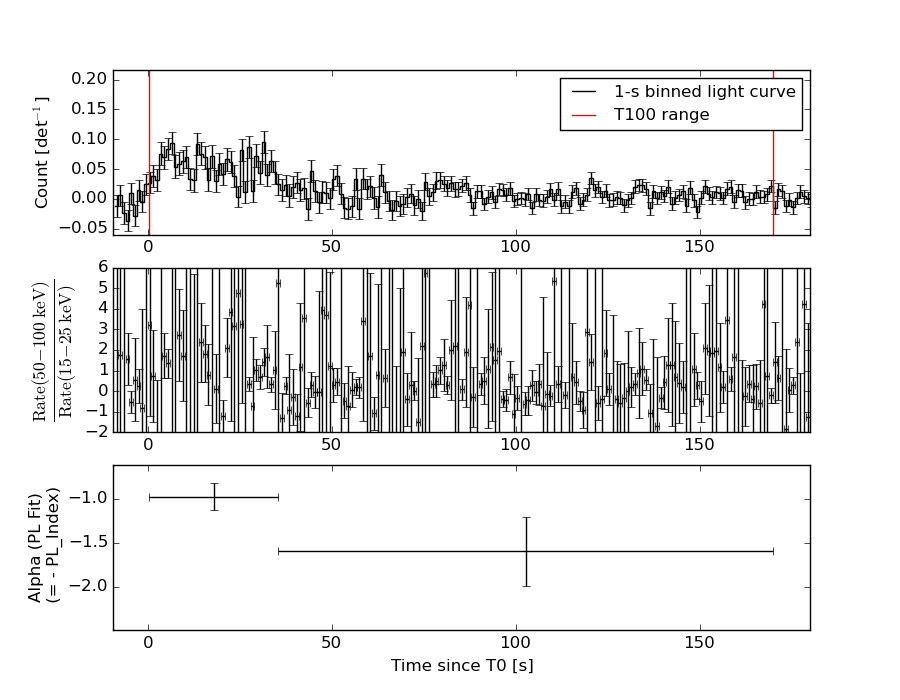
Lightcurves
Notes:
- 1) The mask-weighted light curves are using the flight position.
- 2) Multiple plots of different time binning/intervals are shown to cover all scenarios of short/long GRBs, rate/image triggers, and real/false positives.
- 3) For all the mask-weighted lightcurves, the y-axis units are counts/sec/det where a det is 0.4 x 0.4 = 0.16 sq cm.
- 4) The verticle lines correspond to following: green dotted lines are T50 interval, black dotted lines are T90 interval, blue solid line(s) is a spacecraft slew start time, and orange solid line(s) is a spacecraft slew end time.
- 5) Time of each bin is in the middle of the bin.
1 s binning
From T0-310 s to T0+310 s

From T100_start - 20 s to T100_end + 30 s
Full time interval

64 ms binning
Full time interval
From T100_start to T100_end

From T0-5 sec to T0+5 sec

16 ms binning
From T100_start-5 s to T100_start+5 s

Blue+Cyan dotted lines: Time interval of the scaled map
From 0.000000 to 12.160000
8 ms binning
From T100_start-3 s to T100_start+3 s

Blue+Cyan dotted lines: Time interval of the scaled map
From 0.000000 to 12.160000
2 ms binning
From T100_start-1 s to T100_start+1 s

Blue+Cyan dotted lines: Time interval of the scaled map
From 0.000000 to 12.160000
SN=5 or 10 sec. binning (whichever binning is satisfied first)

SN=5 or 10 sec. binning (T < 200 sec)
Quad-rate summed light curves (from T0-300s to T0+1000s)

The mask-weighted light curves based on cleaned DPHs

Spectral Evolution
Spectra
Notes:
- 1) The fitting includes the systematic errors.
- 2) When the burst includes telescope slew time periods, the fitting uses an average response file made from multiple 5-s response files through out the slew time plus single time preiod for the non-slew times, and weighted by the total counts in the corresponding time period using addrmf. An average response file is needed becuase a spectral fit using the pre-slew DRM will introduce some errors in both a spectral shape and a normalization if the PHA file contains a lot of the slew/post-slew time interval.
- 3) For fits to more complicated models (e.g. a power-law over a cutoff power-law), the BAT team has decided to require a chi-square improvement of more than 6 for each extra dof.
Time averaged spectrum fit using the average DRM
Power-law model

Time interval is from    0.352 sec. to  170.048 sec.

Spectral model in power-law:
------------------------------------------------------------
Parameters  : value       lower 90%   higher 90%
Photon index: 1.20984     ( -0.166819   0.164698 )
Norm@50keV  : 1.20715E-03    ( -0.000116202   0.000116202 )
------------------------------------------------------------
#Fit statistic : Chi-Squared =          62.87 using 59 PHA bins.
# Reduced chi-squared =          1.103 for     57 degrees of freedom
# Null hypothesis probability =   2.762008e-01

Photon flux (15-150 keV)    in 169.7 sec: 0.141894 ( -0.0140707  0.0141044 ) ph/cm2/s
Energy fluence (15-150 keV)             : 2.07258e-06 ( -2.19738e-07  2.21543e-07 ) ergs/cm2
Cutoff power-law model

Time interval is from    0.352 sec. to  170.048 sec.
Spectral model in the cutoff power-law:
------------------------------------------------------------
Parameters  : value       lower 90%   higher 90%
Photon index: 0.228555     ( -0.892295   0.728011 )
Epeak [keV] : 99.0035      ( -23.5986 116.722 )
Norm@50keV  : 3.40925E-03    ( -0.00179739   0.00487008 )
------------------------------------------------------------
#Fit statistic : Chi-Squared =          57.26 using 59 PHA bins.
# Reduced chi-squared =          1.023 for     56 degrees of freedom
# Null hypothesis probability =   4.280169e-01

Photon flux (15-150 keV)    in 169.7 sec: 0.135099 ( -0.015089  0.015007 ) ph/cm2/s
Energy fluence (15-150 keV)             : 1.95406e-06 ( -2.37173e-07  2.39599e-07 ) ergs/cm2
Band function

Time interval is from    0.352 sec. to  170.048 sec.

Spectral model in the Band function:
------------------------------------------------------------
Parameters  : value       lower 90%   higher 90%
alpha       : -0.228175   ( -0.664393   0.984815 )
beta        : -10.0000    ( 10   7.10543e-15 )
Epeak [keV] : 98.9530      ( -23.5758 117.019 )
Norm@50keV   : 3.41142E-03    ( -0.00179989   0.00488015 )
------------------------------------------------------------
#Fit statistic : Chi-Squared =          57.26 using 59 PHA bins.
# Reduced chi-squared =          1.041 for     55 degrees of freedom
# Null hypothesis probability =   3.911418e-01

Photon flux (15-150 keV)    in 169.7 sec: 0.137225 (    ) ph/cm2/s
Energy fluence (15-150 keV)             : 0 ( 0  0 ) ergs/cm2
Single BB

Spectral model blackbody:
------------------------------------------------------------
Parameters  : value    Lower 90%  Upper 90%
kT [keV]    : 18.9918  (-2.06589  2.40672)
R^2/D10^2   : 7.85069E-03  (-0.00256685   0.0036782)
(R is the radius in km and D10 is the distance to the source in units of 10 kpc)
------------------------------------------------------------
#Fit statistic : Chi-Squared =          64.63 using 59 PHA bins.
# Reduced chi-squared =          1.134 for     57 degrees of freedom
# Null hypothesis probability =   2.275647e-01

Energy  Fluence     90% Error
[keV]   [erg/cm2]   [erg/cm2]
15- 25  9.447e-08   1.894e-08
25- 50  4.542e-07   6.686e-08
50-150  1.204e-06   2.201e-07
15-150  1.753e-06   2.277e-07
Thermal bremsstrahlung (OTTB)
Spectral model: thermal bremsstrahlung
------------------------------------------------------------
Parameters  : value         Lower 90%    Upper 90%
kT [keV]    : 200.000       (      )
Norm        : 0.589697       (-0.0576941     0.0576892)
------------------------------------------------------------
#Fit statistic : Chi-Squared =          72.04 using 59 PHA bins.
# Reduced chi-squared =          1.264 for     57 degrees of freedom
# Null hypothesis probability =   8.660467e-02

Energy  Fluence     90% Error
[keV]   [erg/cm2]   [erg/cm2]
15- 25  2.493e-07   1.232e-07
25- 50  4.795e-07   1.790e-07
50-150  1.052e-06   5.707e-07
15-150  1.780e-06   9.011e-07
Double BB
Spectral model: bbodyrad<1> + bbodyrad<2>
------------------------------------------------------------
Parameters  : value         Lower 90%    Upper 90%
kT1 [keV]   : 4.66522        (-1.95024      3.83013)
R1^2/D10^2  : 0.359249        (-0.319955      4.57475)
kT2 [keV]   : 21.7828        (-3.00585      4.86552)
R2^2/D10^2  : 4.67267E-03    (-0.00246647   0.0027655)
------------------------------------------------------------
#Fit statistic : Chi-Squared =          54.84 using 59 PHA bins.
# Reduced chi-squared =         0.9972 for     55 degrees of freedom
# Null hypothesis probability =   4.805624e-01

Energy  Fluence     90% Error
[keV]   [erg/cm2]   [erg/cm2]
15- 25  1.814e-07   8.084e-08
25- 50  4.288e-07   1.147e-07
50-150  1.305e-06   3.153e-07
15-150  1.915e-06   4.095e-07
Peak spectrum fit
Power-law model

Time interval is from   31.108 sec. to   32.108 sec.

Spectral model in power-law:
------------------------------------------------------------
Parameters  : value       lower 90%   higher 90%
Photon index: 1.74996     ( -0.473194   0.528982 )
Norm@50keV  : 6.41770E-03    ( -0.00207966   0.00196657 )
------------------------------------------------------------
#Fit statistic : Chi-Squared =          62.25 using 59 PHA bins.
# Reduced chi-squared =          1.092 for     57 degrees of freedom
# Null hypothesis probability =   2.948783e-01

Photon flux (15-150 keV)    in 1 sec: 0.867768 ( -0.233057  0.233121 ) ph/cm2/s
Energy fluence (15-150 keV)             : 5.92187e-08 ( -1.88961e-08  1.97602e-08 ) ergs/cm2
Cutoff power-law model
Time interval is from   31.108 sec. to   32.108 sec.
Spectral model in the cutoff power-law:
------------------------------------------------------------
Parameters  : value       lower 90%   higher 90%
Photon index: 1.37140     ( -2.21795   0.89918 )
Epeak [keV] : 76.1250      ( -76.1025 -76.1025 )
Norm@50keV  : 1.03358E-02    ( -0.0103392   0.168526 )
------------------------------------------------------------
#Fit statistic : Chi-Squared =          62.09 using 59 PHA bins.
# Reduced chi-squared =          1.109 for     56 degrees of freedom
# Null hypothesis probability =   2.681121e-01

Photon flux (15-150 keV)    in 1 sec: 0.857205 ( -0.237168  0.237015 ) ph/cm2/s
Energy fluence (15-150 keV)             : 5.74494e-08 ( -1.97816e-08  2.09571e-08 ) ergs/cm2
Band function

Time interval is from   31.108 sec. to   32.108 sec.

Spectral model in the Band function:
------------------------------------------------------------
Parameters  : value       lower 90%   higher 90%
alpha       : -1.38251   ( -0.698202   1.3018 )
beta        : -10.0000    ( 10   20 )
Epeak [keV] : 76.8868      ( -60.4615 -76.8868 )
Norm@50keV   : 1.01987E-02    ( -0.00479861   0.168906 )
------------------------------------------------------------
#Fit statistic : Chi-Squared =          62.09 using 59 PHA bins.
# Reduced chi-squared =          1.129 for     55 degrees of freedom
# Null hypothesis probability =   2.381858e-01

Photon flux (15-150 keV)    in 1 sec: 0.856186 ( 6.14381  -0.23367 ) ph/cm2/s
Energy fluence (15-150 keV)             : 5.71771e-08 ( -5.71701e-08  -1.95529e-08 ) ergs/cm2
Single BB

Spectral model blackbody:
------------------------------------------------------------
Parameters  : value    Lower 90%  Upper 90%
kT [keV]    : 11.9199  (-3.92354  6.23543)
R^2/D10^2   : 0.214233  (-0.212399   0.709733)
(R is the radius in km and D10 is the distance to the source in units of 10 kpc)
------------------------------------------------------------
#Fit statistic : Chi-Squared =          66.10 using 59 PHA bins.
# Reduced chi-squared =          1.160 for     57 degrees of freedom
# Null hypothesis probability =   1.913784e-01

Energy  Fluence     90% Error
[keV]   [erg/cm2]   [erg/cm2]
15- 25  6.434e-09   3.701e-09
25- 50  2.009e-08   1.230e-08
50-150  1.709e-08   1.209e-08
15-150  4.361e-08   2.512e-08
Thermal bremsstrahlung (OTTB)

Spectral model: thermal bremsstrahlung
------------------------------------------------------------
Parameters  : value         Lower 90%    Upper 90%
kT [keV]    : 122.217       (-74.7764      -118.734)
Norm        : 3.64309       (-1.0922     1.81793)
------------------------------------------------------------
#Fit statistic : Chi-Squared =          62.13 using 59 PHA bins.
# Reduced chi-squared =          1.090 for     57 degrees of freedom
# Null hypothesis probability =   2.984987e-01

Energy  Fluence     90% Error
[keV]   [erg/cm2]   [erg/cm2]
15- 25  9.482e-09   5.580e-09
25- 50  1.702e-08   1.004e-08
50-150  3.064e-08   2.166e-08
15-150  5.714e-08   3.602e-08
Double BB

Spectral model: bbodyrad<1> + bbodyrad<2>
------------------------------------------------------------
Parameters  : value         Lower 90%    Upper 90%
kT1 [keV]   : 5.53565        (-5.50192      5.2166)
R1^2/D10^2  : 2.35240        (-2.16081      -2.40575)
kT2 [keV]   : 21.3083        (-18.3796      62.1287)
R2^2/D10^2  : 2.05835E-02    (-0.0208404   0.289034)
------------------------------------------------------------
#Fit statistic : Chi-Squared =          61.72 using 59 PHA bins.
# Reduced chi-squared =          1.122 for     55 degrees of freedom
# Null hypothesis probability =   2.485066e-01

Energy  Fluence     90% Error
[keV]   [erg/cm2]   [erg/cm2]
15- 25  1.021e-08   6.005e-09
25- 50  1.614e-08   8.655e-09
50-150  3.129e-08   2.122e-08
15-150  5.763e-08   2.969e-08
Pre-slew spectrum (Pre-slew PHA with pre-slew DRM)
Power-law model

Spectral model in power-law:
------------------------------------------------------------
Parameters  : value       lower 90%   higher 90%
Photon index: 1.07138     ( -0.164974   0.160932 )
Norm@50keV  : 2.72060E-03    ( -0.000258545   0.000257972 )
------------------------------------------------------------
#Fit statistic : Chi-Squared =          71.04 using 59 PHA bins.
# Reduced chi-squared =          1.246 for     57 degrees of freedom
# Null hypothesis probability =   9.992526e-02

Photon flux (15-150 keV)    in 57.29 sec: 0.314754 ( -0.030792  0.0309086 ) ph/cm2/s
Energy fluence (15-150 keV)             : 1.64478e-06 ( -1.65906e-07  1.66881e-07 ) ergs/cm2
Cutoff power-law model

Spectral model in the cutoff power-law:
------------------------------------------------------------
Parameters  : value       lower 90%   higher 90%
Photon index: -2.57220E-03     ( -0.916514   0.749716 )
Epeak [keV] : 106.738      ( -24.9277 107.63 )
Norm@50keV  : 8.05733E-03    ( -0.00420187   0.0111332 )
------------------------------------------------------------
#Fit statistic : Chi-Squared =          64.64 using 59 PHA bins.
# Reduced chi-squared =          1.154 for     56 degrees of freedom
# Null hypothesis probability =   2.005088e-01

Photon flux (15-150 keV)    in 57.29 sec: 0.298302 ( -0.032936  0.032955 ) ph/cm2/s
Energy fluence (15-150 keV)             : 1.5533e-06 ( -1.80865e-07  1.81094e-07 ) ergs/cm2
Band function

Spectral model in the Band function:
------------------------------------------------------------
Parameters  : value       lower 90%   higher 90%
alpha       : 9.48286E-03   ( -0.7334   0.858454 )
beta        : -9.34803    ( 9.37167   19.3717 )
Epeak [keV] : 106.574      ( -22.1514 102.968 )
Norm@50keV   : 8.09836E-03    ( -0.00413742   0.00406326 )
------------------------------------------------------------
#Fit statistic : Chi-Squared =          64.64 using 59 PHA bins.
# Reduced chi-squared =          1.175 for     55 degrees of freedom
# Null hypothesis probability =   1.754585e-01

Photon flux (15-150 keV)    in 57.29 sec:  (    ) ph/cm2/s
Energy fluence (15-150 keV)             : 0 ( 0  0 ) ergs/cm2
S(25-50 keV) vs. S(50-100 keV) plot

S(25-50 keV)  = 4.38e-07
S(50-100 keV) = 7.57e-07
T90 vs. Hardness ratio plot

T90                                   = 146.832000017166 sec.
Hardness ratio (energy fluence ratio) = 1.72831
Color vs. Color plot
Count Ratio  (25-50 keV) / (15-25 keV) = 1.65326
Count Ratio (50-100 keV) / (15-25 keV) = 1.85412
Mask shadow pattern
IMX = -1.208197273612199E-01, IMY = -5.638948055288383E-01
TIME vs. PHA plot around the trigger time

Blue+Cyan dotted lines: Time interval of the scaled map
From 0.000000 to 12.160000
TIME vs. DetID plot around the trigger time

Blue+Cyan dotted lines: Time interval of the scaled map
From 0.000000 to 12.160000
100 us light curve (15-350 keV)
Blue+Cyan dotted lines: Time interval of the scaled map
From 0.000000 to 12.160000
Spacecraft aspect plot

Bright source in the pre-burst/pre-slew/post-slew images
Pre-burst image of 15-350 keV band
Time interval of the image:
-239.056000 -40.898100
-40.056000 0.352000

# RAcent  DECcent POSerr Theta    Phi  PeakCts   SNR AngSep     Name
#  [deg]    [deg]    ['] [deg]  [deg]                   [']
135.4856 -40.5748    1.8  12.8  -64.6   1.1711   6.3    2.3	Vela X-1
170.1664 -60.7077    4.5  16.6  128.0   0.5115   2.5    6.7	Cen X-3
186.5835 -62.8612    2.5  24.5  124.4   1.1720   4.6    5.8	GX 301-2
203.4249 -57.4811    2.7  32.6  112.4   1.5174   4.3 ------	UNKNOWN
136.8135 -31.2425    2.7  20.2  -43.7   0.8320   4.2 ------	UNKNOWN
 26.4435 -62.6748    3.8  59.0 -166.2   4.3395   3.1 ------	UNKNOWN
 36.8511 -60.3491    3.7  57.3 -160.1   3.5990   3.2 ------	UNKNOWN
 35.8622 -58.8589    3.7  58.7 -159.2   4.9201   3.1 ------	UNKNOWN
 39.6625 -57.9229    3.5  58.0 -156.8   4.1682   3.3 ------	UNKNOWN
Pre-slew background subtracted image of 15-350 keV band
Time interval of the image:
0.352000 57.644600

# RAcent  DECcent POSerr Theta    Phi  PeakCts   SNR AngSep     Name
#  [deg]    [deg]    ['] [deg]  [deg]                   [']
135.6515 -40.7172    6.3  12.6  -64.7   0.1719   1.8   11.2	Vela X-1
170.1979 -60.4820    4.9  16.5  127.3   0.2397   2.3    9.1	Cen X-3
186.6052 -62.6282    9.2  24.5  123.9   0.1547   1.3    8.6	GX 301-2
197.0118 -52.7572    0.7  30.0  102.1   2.4849  16.4 ------	UNKNOWN
Post-slew image of 15-350 keV band
Time interval of the image:
108.244600 963.052500

# RAcent  DECcent POSerr Theta    Phi  PeakCts   SNR AngSep     Name
#  [deg]    [deg]    ['] [deg]  [deg]                   [']
135.6678 -40.4704    4.5  42.5  -69.3   7.2721   2.5    8.1	Vela X-1
170.4125 -60.6311    2.2  16.4  -99.7   2.9930   5.3    2.9	Cen X-3
186.6684 -62.7638    0.9  11.4 -126.1   5.9608  12.4    0.5	GX 301-2
255.8640 -37.9534    7.3  42.6  123.5   3.3544   1.6    8.8	4U 1700-377
264.7693 -44.4509  105.9  43.9  137.0   0.2079   0.1    1.1	4U 1735-44
248.5286 -47.4094    0.9  32.8  131.2  12.1080  13.3 ------	UNKNOWN
 31.0873 -71.5808    9.0  55.3 -145.2   6.0200   1.3 ------	UNKNOWN
Plot creation:
Sat May 30 19:29:20 EDT 2015