Special notes of this burst
Image
Pre-slew 15.0-350.0 keV image (Event data)

#   RAcent    DECcent   POSerr    Theta     Phi              Peak Cts       SNR   Name
  214.2842    42.1443   0.0063    19.1540    95.4980         1.8104872     30.445 TRIG_00522656

Foreground time interval of the image:
 -1.032  17.365 (delta_t =  18.397 [sec])
Background time interval of the image:
-180.435  -1.032 (delta_t = 179.403 [sec])
Lightcurves
Notes:
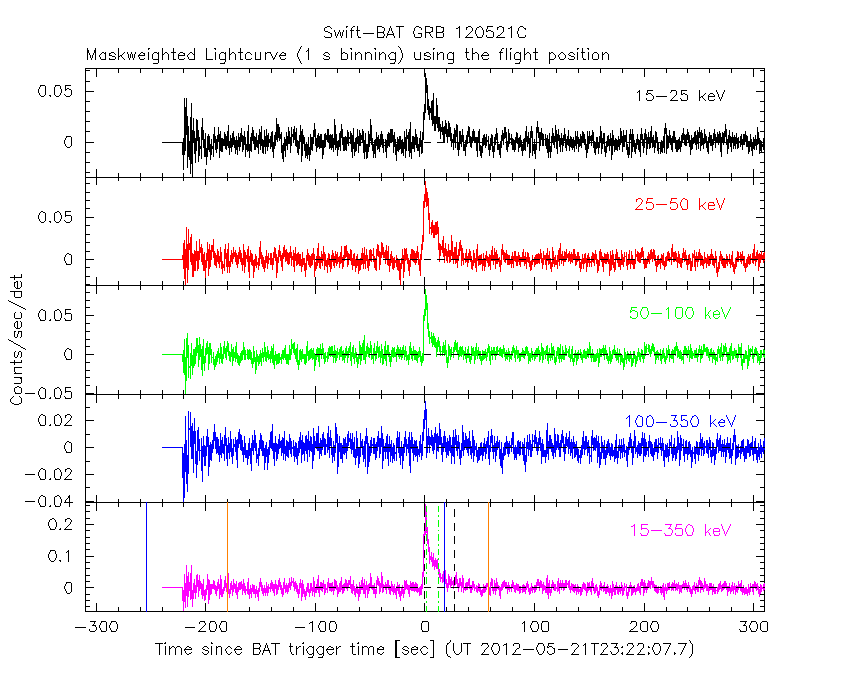
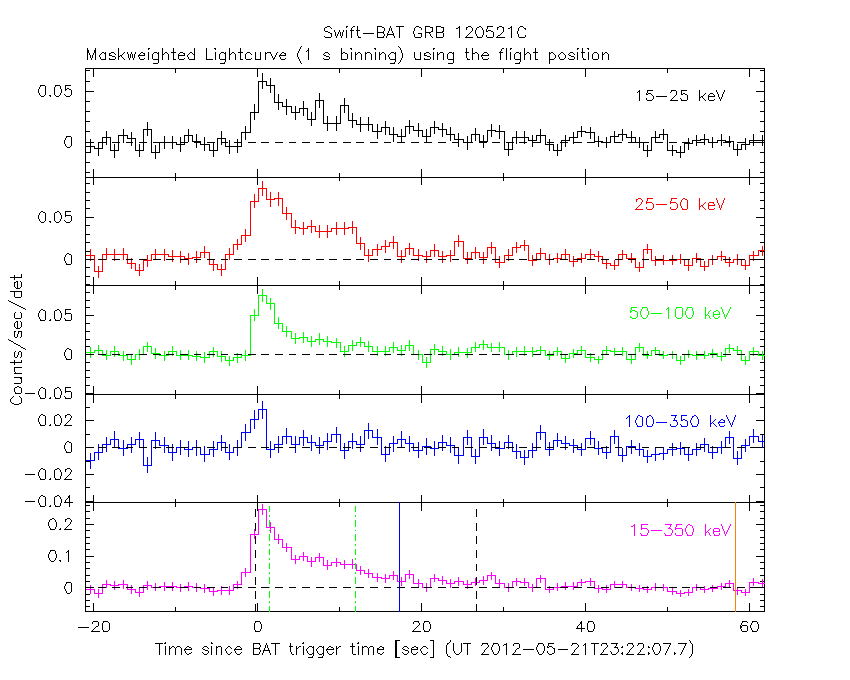
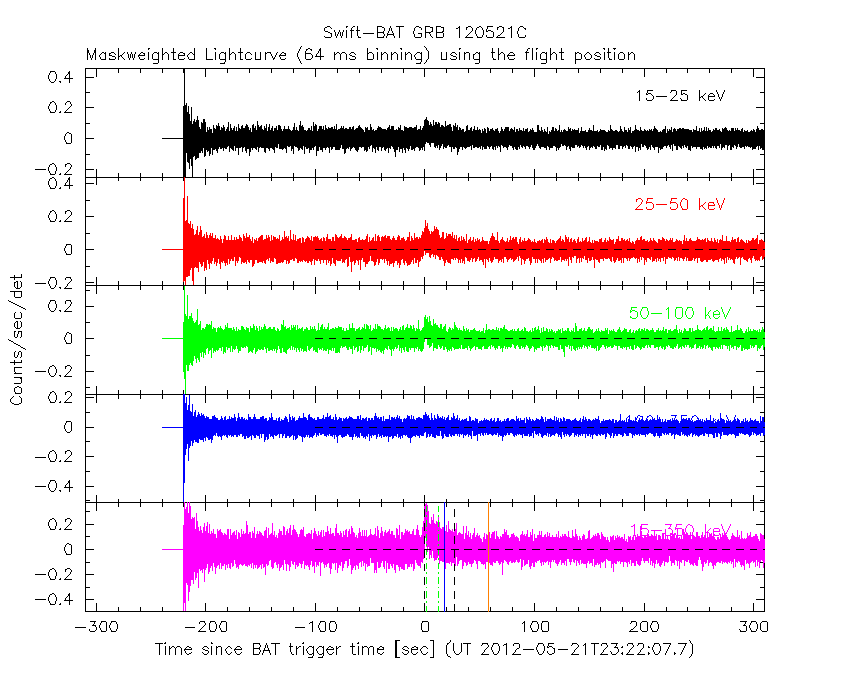
- 1) The mask-weighted light curves are using the flight position.
- 2) Multiple plots of different time binning/intervals are shown to cover all scenarios of short/long GRBs, rate/image triggers, and real/false positives.
- 3) For all the mask-weighted lightcurves, the y-axis units are counts/sec/det where a det is 0.4 x 0.4 = 0.16 sq cm.
- 4) The verticle lines correspond to following: green dotted lines are T50 interval, black dotted lines are T90 interval, blue solid line(s) is a spacecraft slew start time, and orange solid line(s) is a spacecraft slew end time.
- 5) Time of each bin is in the middle of the bin.
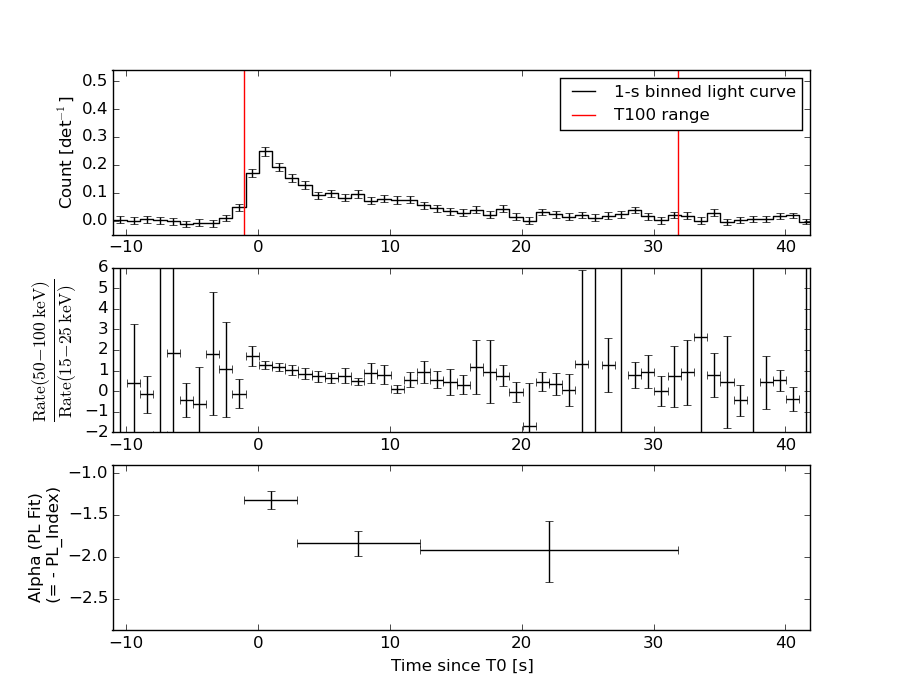
1 s binning
From T0-310 s to T0+310 s
From T100_start - 20 s to T100_end + 30 s
Full time interval

64 ms binning
Full time interval
From T100_start to T100_end

From T0-5 sec to T0+5 sec

16 ms binning
From T100_start-5 s to T100_start+5 s

Blue+Cyan dotted lines: Time interval of the scaled map
From 0.000000 to 1.024000
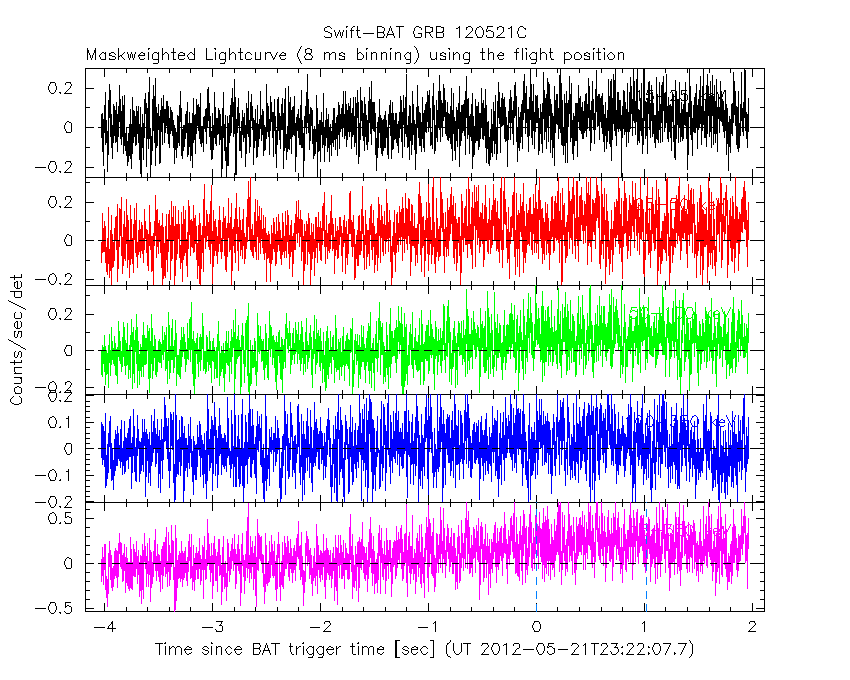
8 ms binning
From T100_start-3 s to T100_start+3 s
Blue+Cyan dotted lines: Time interval of the scaled map
From 0.000000 to 1.024000
2 ms binning
From T100_start-1 s to T100_start+1 s

Blue+Cyan dotted lines: Time interval of the scaled map
From 0.000000 to 1.024000
SN=5 or 10 sec. binning (whichever binning is satisfied first)

SN=5 or 10 sec. binning (T < 200 sec)

Quad-rate summed light curves (from T0-300s to T0+1000s)

Spectral Evolution
Spectra
Notes:
- 1) The fitting includes the systematic errors.
- 2) When the burst includes telescope slew time periods, the fitting uses an average response file made from multiple 5-s response files through out the slew time plus single time preiod for the non-slew times, and weighted by the total counts in the corresponding time period using addrmf. An average response file is needed becuase a spectral fit using the pre-slew DRM will introduce some errors in both a spectral shape and a normalization if the PHA file contains a lot of the slew/post-slew time interval.
- 3) For fits to more complicated models (e.g. a power-law over a cutoff power-law), the BAT team has decided to require a chi-square improvement of more than 6 for each extra dof.
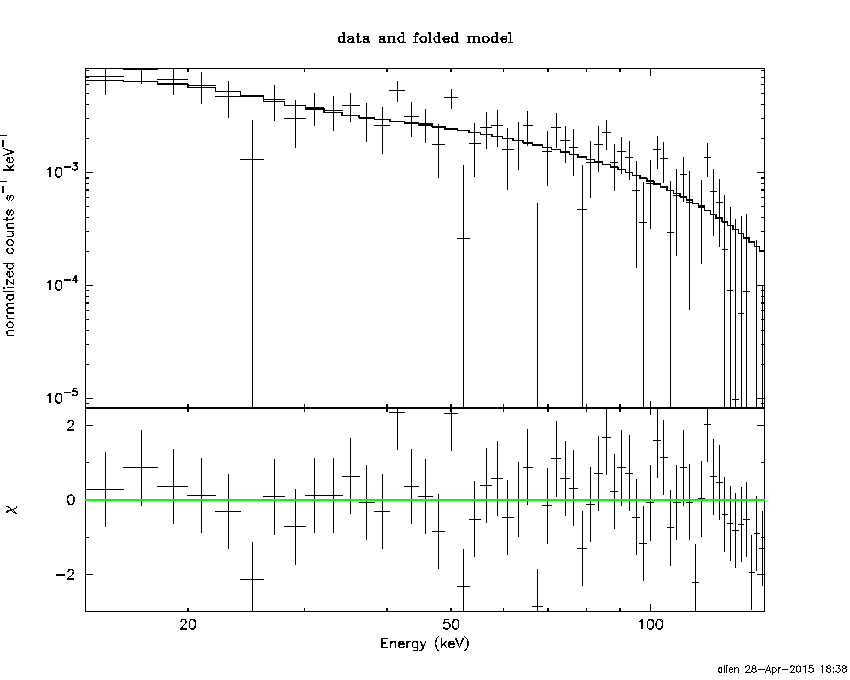
Time averaged spectrum fit using the average DRM
Power-law model
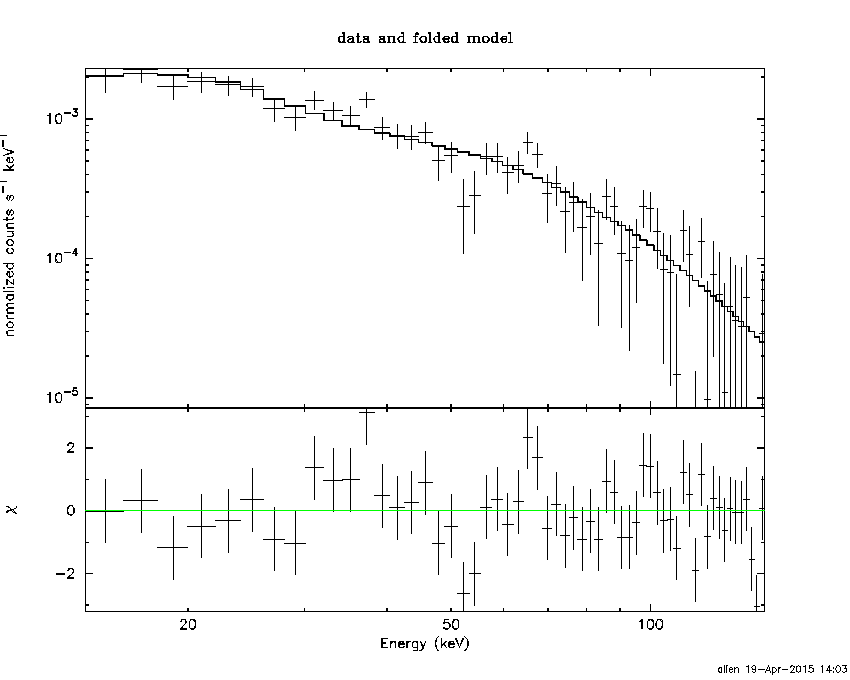
Time interval is from   -1.032 sec. to   31.864 sec.

Spectral model in power-law:
------------------------------------------------------------
Parameters  : value       lower 90%   higher 90%
Photon index: 1.65555     ( -0.109984   0.111694 )
Norm@50keV  : 3.93009E-03    ( -0.000253845   0.000251789 )
------------------------------------------------------------
#Fit statistic : Chi-Squared =          70.71 using 59 PHA bins.
# Reduced chi-squared =          1.241 for     57 degrees of freedom
# Null hypothesis probability =   1.047589e-01

Photon flux (15-150 keV)    in 32.9 sec: 0.514115 ( -0.0308932  0.0309208 ) ph/cm2/s
Energy fluence (15-150 keV)             : 1.20188e-06 ( -8.28902e-08  8.3693e-08 ) ergs/cm2
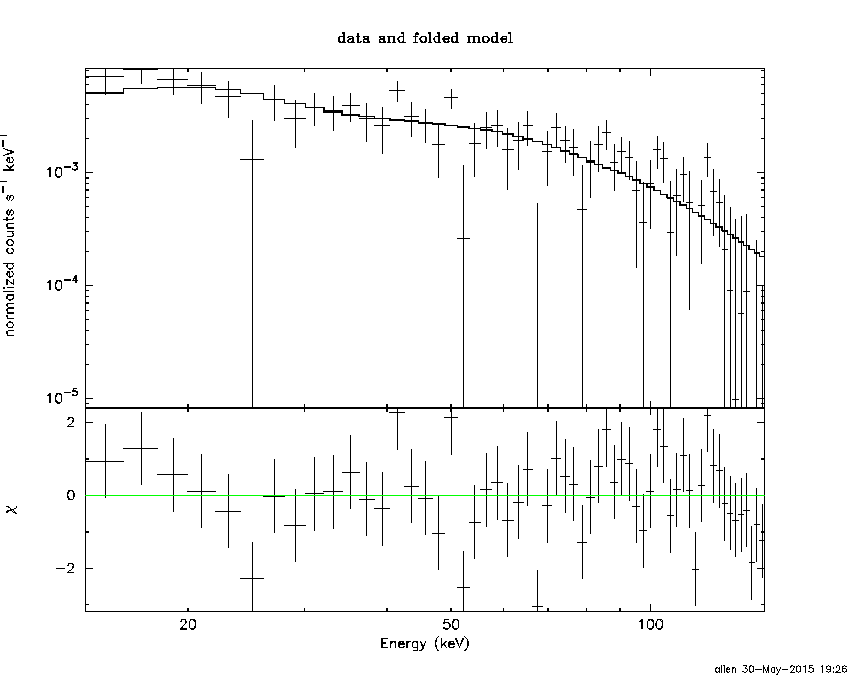
Cutoff power-law model
Time interval is from   -1.032 sec. to   31.864 sec.
Spectral model in the cutoff power-law:
------------------------------------------------------------
Parameters  : value       lower 90%   higher 90%
Photon index: 1.36323     ( -0.457528   0.35144 )
Epeak [keV] : 103.018      ( -37.6375 -103.018 )
Norm@50keV  : 5.59703E-03    ( -0.00183484   0.00404213 )
------------------------------------------------------------
#Fit statistic : Chi-Squared =          69.27 using 59 PHA bins.
# Reduced chi-squared =          1.237 for     56 degrees of freedom
# Null hypothesis probability =   1.095791e-01

Photon flux (15-150 keV)    in 32.9 sec: 0.505861 ( -0.032945  0.032921 ) ph/cm2/s
Energy fluence (15-150 keV)             : 1.16793e-06 ( -9.63246e-08  9.64167e-08 ) ergs/cm2
Band function

Time interval is from   -1.032 sec. to   31.864 sec.

Spectral model in the Band function:
------------------------------------------------------------
Parameters  : value       lower 90%   higher 90%
alpha       : -1.36327   ( -0.267637   0.426549 )
beta        : -10.0000    ( 10   1.06581e-14 )
Epeak [keV] : 103.000      ( -37.2083 -103 )
Norm@50keV   : 5.59610E-03    ( -0.00183436   0.00404334 )
------------------------------------------------------------
#Fit statistic : Chi-Squared =          69.27 using 59 PHA bins.
# Reduced chi-squared =          1.260 for     55 degrees of freedom
# Null hypothesis probability =   9.331108e-02

Photon flux (15-150 keV)    in 32.9 sec: 0.503441 (    ) ph/cm2/s
Energy fluence (15-150 keV)             : 1.17046e-06 ( 0  0 ) ergs/cm2
Single BB

Spectral model blackbody:
------------------------------------------------------------
Parameters  : value    Lower 90%  Upper 90%
kT [keV]    : 12.6724  (  )
R^2/D10^2   : 0.100554  (   )
(R is the radius in km and D10 is the distance to the source in units of 10 kpc)
------------------------------------------------------------
#Fit statistic : Chi-Squared =         129.69 using 59 PHA bins.
# Reduced chi-squared =         2.2753 for     57 degrees of freedom
# Null hypothesis probability =   1.372105e-07

Energy  Fluence     90% Error
[keV]   [erg/cm2]   [erg/cm2]
15- 25  1.127e-07   1.328e-08
25- 50  3.774e-07   2.829e-08
50-150  3.773e-07   5.174e-08
15-150  8.674e-07   6.498e-08
Thermal bremsstrahlung (OTTB)

Spectral model: thermal bremsstrahlung
------------------------------------------------------------
Parameters  : value         Lower 90%    Upper 90%
kT [keV]    : 150.724       (-40.0979      -148.932)
Norm        : 2.10488       (-0.141684     0.172896)
------------------------------------------------------------
#Fit statistic : Chi-Squared =          69.40 using 59 PHA bins.
# Reduced chi-squared =          1.218 for     57 degrees of freedom
# Null hypothesis probability =   1.254709e-01

Energy  Fluence     90% Error
[keV]   [erg/cm2]   [erg/cm2]
15- 25  1.778e-07   1.525e-08
25- 50  3.298e-07   3.815e-08
50-150  6.522e-07   2.350e-07
15-150  1.160e-06   2.757e-07
Double BB
Spectral model: bbodyrad<1> + bbodyrad<2>
------------------------------------------------------------
Parameters  : value         Lower 90%    Upper 90%
kT1 [keV]   : 7.33025        (-1.19279      1.23012)
R1^2/D10^2  : 0.505385        (-0.200073      0.409831)
kT2 [keV]   : 27.0689        (-5.50257      9.49443)
R2^2/D10^2  : 4.91447E-03    (-0.00313336   0.00648997)
------------------------------------------------------------
#Fit statistic : Chi-Squared =          68.36 using 59 PHA bins.
# Reduced chi-squared =          1.243 for     55 degrees of freedom
# Null hypothesis probability =   1.064251e-01

Energy  Fluence     90% Error
[keV]   [erg/cm2]   [erg/cm2]
15- 25  1.699e-07   3.731e-08
25- 50  3.407e-07   7.185e-08
50-150  6.653e-07   3.005e-07
15-150  1.176e-06   3.415e-07
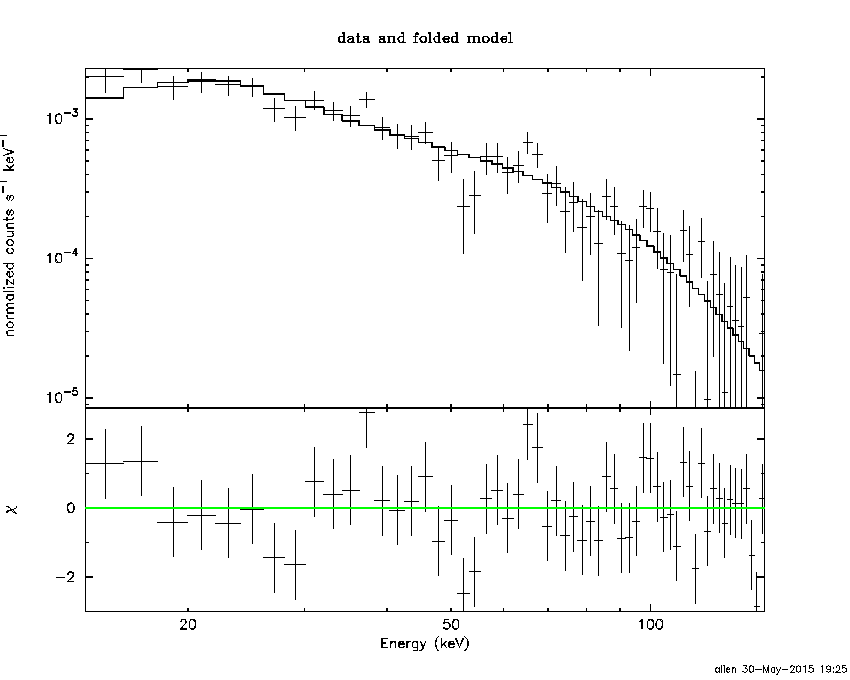
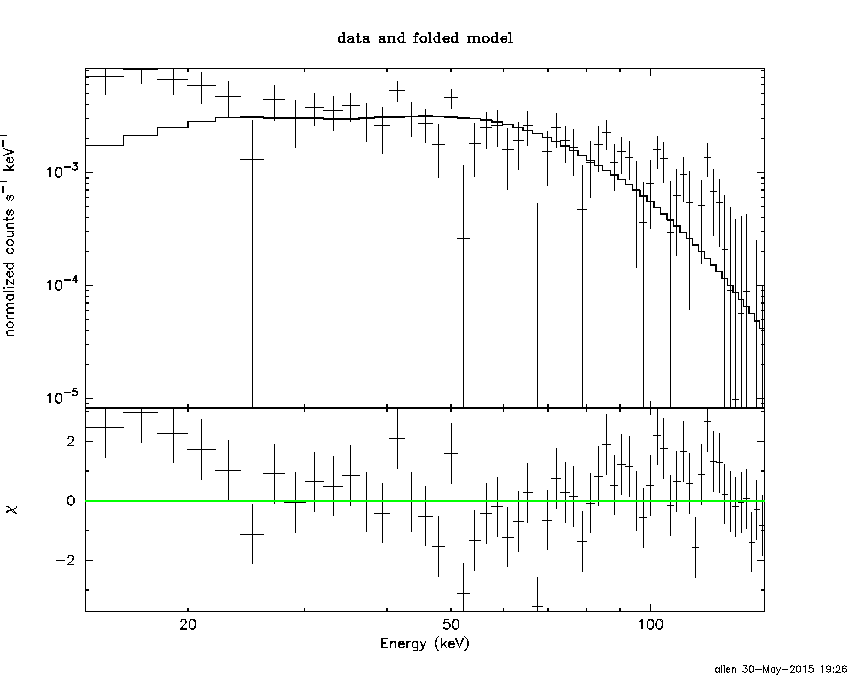
Peak spectrum fit
Power-law model

Time interval is from    0.184 sec. to    1.184 sec.

Spectral model in power-law:
------------------------------------------------------------
Parameters  : value       lower 90%   higher 90%
Photon index: 1.19519     ( -0.186182   0.18501 )
Norm@50keV  : 1.63796E-02    ( -0.00161974   0.00161915 )
------------------------------------------------------------
#Fit statistic : Chi-Squared =          71.27 using 59 PHA bins.
# Reduced chi-squared =          1.250 for     57 degrees of freedom
# Null hypothesis probability =   9.683678e-02

Photon flux (15-150 keV)    in 1 sec: 1.92134 ( -0.194156  0.194651 ) ph/cm2/s
Energy fluence (15-150 keV)             : 1.66405e-07 ( -1.88196e-08  1.8972e-08 ) ergs/cm2
Cutoff power-law model
Time interval is from    0.184 sec. to    1.184 sec.
Spectral model in the cutoff power-law:
------------------------------------------------------------
Parameters  : value       lower 90%   higher 90%
Photon index: 2.30481     ( -0.194058   0.181171 )
Epeak [keV] : 103.691      ( -9999.36 -9999.36 )
Norm@50keV  : 3.67551E-03    (     )
------------------------------------------------------------
#Fit statistic : Chi-Squared =          66.41 using 59 PHA bins.
# Reduced chi-squared =          1.186 for     56 degrees of freedom
# Null hypothesis probability =   1.608540e-01

Photon flux (15-150 keV)    in 1 sec: 1.92310 ( -0.19642  0.19226 ) ph/cm2/s
Energy fluence (15-150 keV)             : 1.66187e-07 ( -1.8515e-08  1.8904e-08 ) ergs/cm2
Band function
Time interval is from    0.184 sec. to    1.184 sec.

Spectral model in the Band function:
------------------------------------------------------------
Parameters  : value       lower 90%   higher 90%
alpha       : -0.962528   ( 0.963068   0.963068 )
beta        : -1.19517    ( -0.185213   0.186237 )
Epeak [keV] : 52.8840      ( -52.2399 -52.2399 )
Norm@50keV   : 2.88884E-02    ( -0.0141318   2.41738 )
------------------------------------------------------------
#Fit statistic : Chi-Squared =          71.27 using 59 PHA bins.
# Reduced chi-squared =          1.296 for     55 degrees of freedom
# Null hypothesis probability =   6.915878e-02

Photon flux (15-150 keV)    in 1 sec:  (    ) ph/cm2/s
Energy fluence (15-150 keV)             : 0 ( 0  0 ) ergs/cm2
Single BB
Spectral model blackbody:
------------------------------------------------------------
Parameters  : value    Lower 90%  Upper 90%
kT [keV]    : 20.5418  (-3.07811  3.75043)
R^2/D10^2   : 7.92932E-02  (-0.0324951   0.0544436)
(R is the radius in km and D10 is the distance to the source in units of 10 kpc)
------------------------------------------------------------
#Fit statistic : Chi-Squared =         102.69 using 59 PHA bins.
# Reduced chi-squared =         1.8017 for     57 degrees of freedom
# Null hypothesis probability =   1.977173e-04

Energy  Fluence     90% Error
[keV]   [erg/cm2]   [erg/cm2]
15- 25  6.380e-09   1.403e-09
25- 50  3.234e-08   5.285e-09
50-150  1.015e-07   1.779e-08
15-150  1.402e-07   2.260e-08
Thermal bremsstrahlung (OTTB)
Spectral model: thermal bremsstrahlung
------------------------------------------------------------
Parameters  : value         Lower 90%    Upper 90%
kT [keV]    : 200.000       (      )
Norm        : 7.86186       (-0.794417     0.794378)
------------------------------------------------------------
#Fit statistic : Chi-Squared =          83.38 using 59 PHA bins.
# Reduced chi-squared =          1.463 for     57 degrees of freedom
# Null hypothesis probability =   1.293450e-02

Energy  Fluence     90% Error
[keV]   [erg/cm2]   [erg/cm2]
15- 25  1.958e-08   1.078e-08
25- 50  3.767e-08   2.058e-08
50-150  8.261e-08   4.470e-08
15-150  1.398e-07   7.580e-08
Double BB

Spectral model: bbodyrad<1> + bbodyrad<2>
------------------------------------------------------------
Parameters  : value         Lower 90%    Upper 90%
kT1 [keV]   : 6.46714        (-3.4674      2.9937)
R1^2/D10^2  : 2.26982        (-1.55936      10.8604)
kT2 [keV]   : 33.3732        (-9.75861      18.8168)
R2^2/D10^2  : 1.54038E-02    (-0.0107097   0.0310537)
------------------------------------------------------------
#Fit statistic : Chi-Squared =          71.76 using 59 PHA bins.
# Reduced chi-squared =          1.305 for     55 degrees of freedom
# Null hypothesis probability =   6.405594e-02

Energy  Fluence     90% Error
[keV]   [erg/cm2]   [erg/cm2]
15- 25  1.645e-08   8.295e-09
25- 50  3.242e-08   1.318e-08
50-150  1.228e-07   5.359e-08
15-150  1.716e-07   7.191e-08
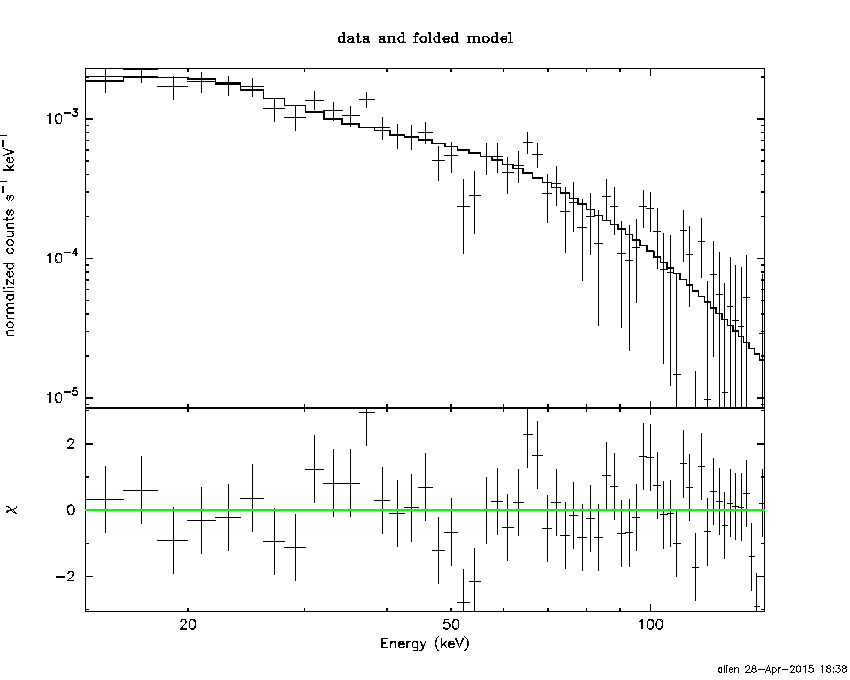
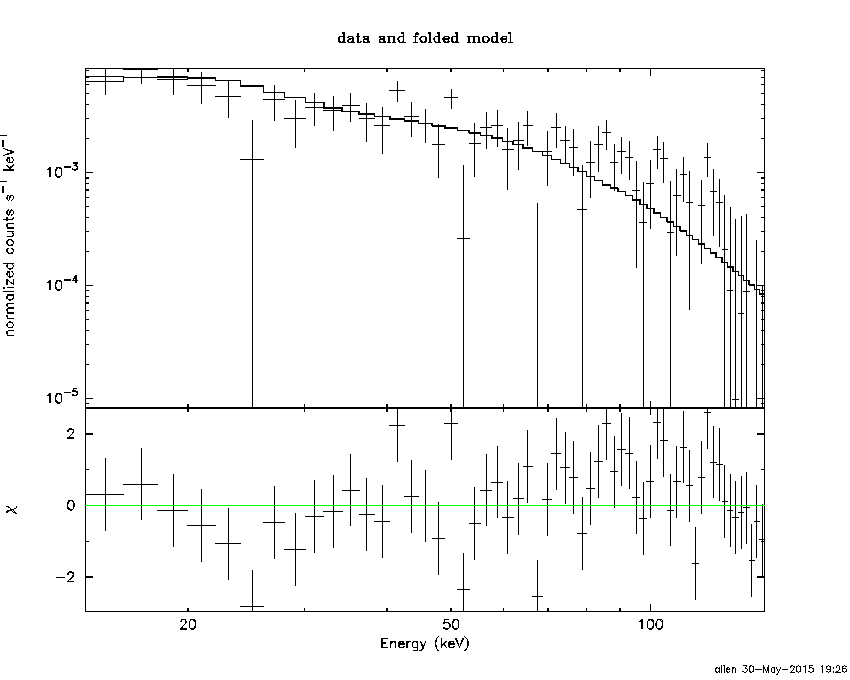
Pre-slew spectrum (Pre-slew PHA with pre-slew DRM)
Power-law model

Spectral model in power-law:
------------------------------------------------------------
Parameters  : value       lower 90%   higher 90%
Photon index: 1.61516     ( -0.0997891   0.100906 )
Norm@50keV  : 6.18901E-03    ( -0.00035492   0.00035272 )
------------------------------------------------------------
#Fit statistic : Chi-Squared =          74.55 using 59 PHA bins.
# Reduced chi-squared =          1.308 for     57 degrees of freedom
# Null hypothesis probability =   5.927526e-02

Photon flux (15-150 keV)    in 18.4 sec: 0.799097 ( -0.0436574  0.0437021 ) ph/cm2/s
Energy fluence (15-150 keV)             : 1.06309e-06 ( -6.58293e-08  6.63607e-08 ) ergs/cm2
Cutoff power-law model

Spectral model in the cutoff power-law:
------------------------------------------------------------
Parameters  : value       lower 90%   higher 90%
Photon index: 1.43941     ( -0.392955   0.229221 )
Epeak [keV] : 152.988      (   )
Norm@50keV  : 7.63946E-03    (     )
------------------------------------------------------------
#Fit statistic : Chi-Squared =          73.87 using 59 PHA bins.
# Reduced chi-squared =          1.319 for     56 degrees of freedom
# Null hypothesis probability =   5.502646e-02

Photon flux (15-150 keV)    in 18.4 sec: 0.791196 ( -0.046428  0.046405 ) ph/cm2/s
Energy fluence (15-150 keV)             : 1.04525e-06 ( -7.61797e-08  7.58522e-08 ) ergs/cm2
Band function

Spectral model in the Band function:
------------------------------------------------------------
Parameters  : value       lower 90%   higher 90%
alpha       : -0.721257   ( 0.986379   0.986379 )
beta        : -1.74396    ( 1.74106   0.17337 )
Epeak [keV] : 50.3732      ( -50.0194 203.174 )
Norm@50keV   : 2.20811E-02    ( -0.0230031   713.599 )
------------------------------------------------------------
#Fit statistic : Chi-Squared =          72.11 using 59 PHA bins.
# Reduced chi-squared =          1.311 for     55 degrees of freedom
# Null hypothesis probability =   6.062199e-02

Photon flux (15-150 keV)    in 18.4 sec: 0.788574 (    ) ph/cm2/s
Energy fluence (15-150 keV)             : 0 ( 0  0 ) ergs/cm2
S(25-50 keV) vs. S(50-100 keV) plot

S(25-50 keV)  = 3.19e-07
S(50-100 keV) = 4.05e-07
T90 vs. Hardness ratio plot
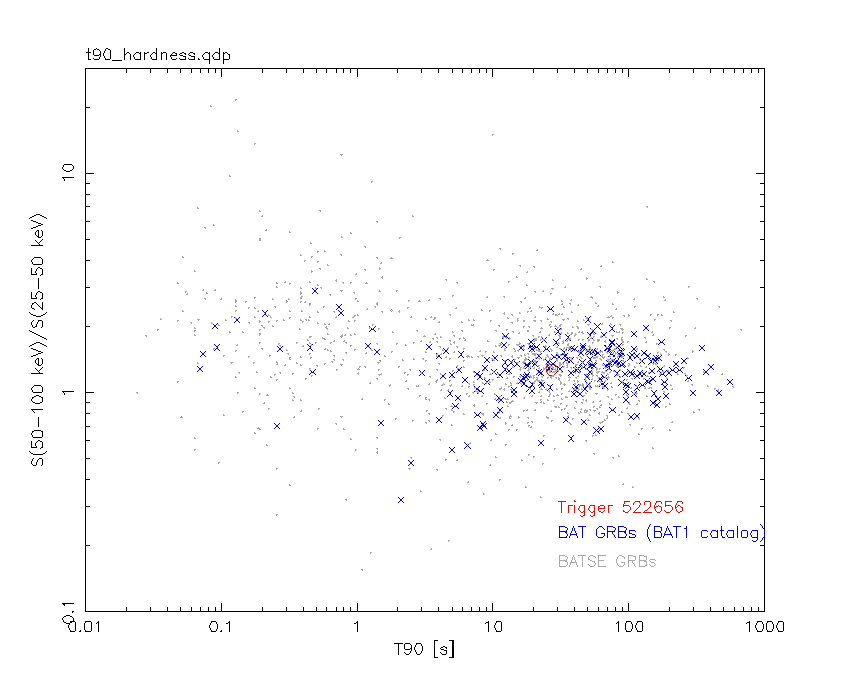
T90                                   = 27.067999958992 sec.
Hardness ratio (energy fluence ratio) = 1.26959
Color vs. Color plot
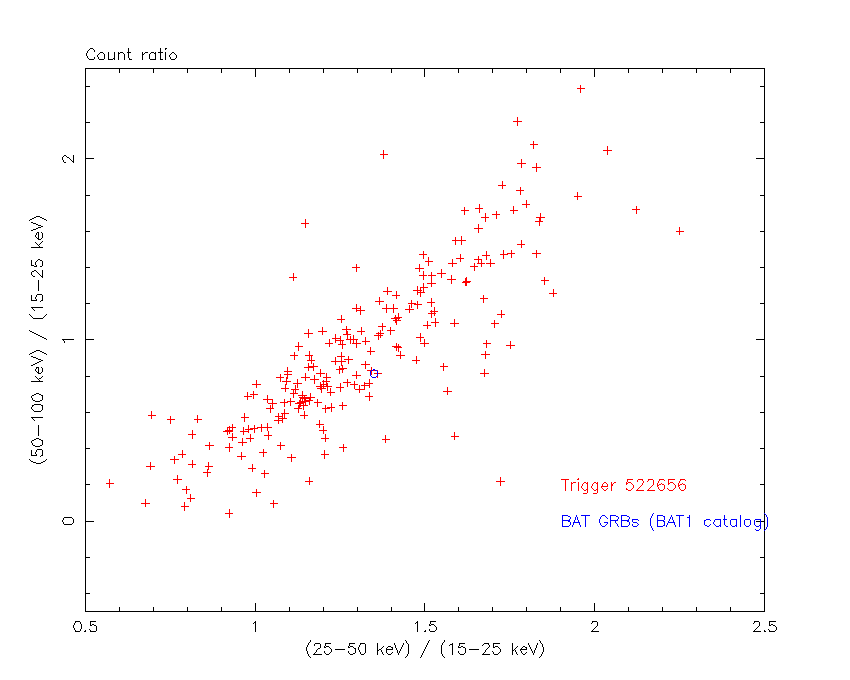
Count Ratio  (25-50 keV) / (15-25 keV) = 1.34964
Count Ratio (50-100 keV) / (15-25 keV) = 0.815127
Mask shadow pattern
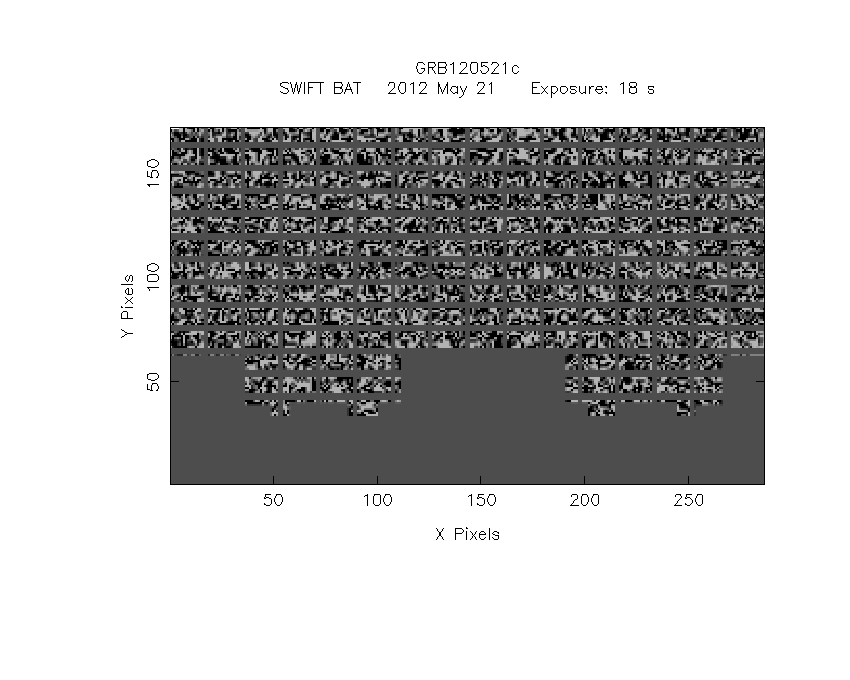
IMX = -3.327848078866250E-02, IMY = -3.457392824339013E-01
TIME vs. PHA plot around the trigger time
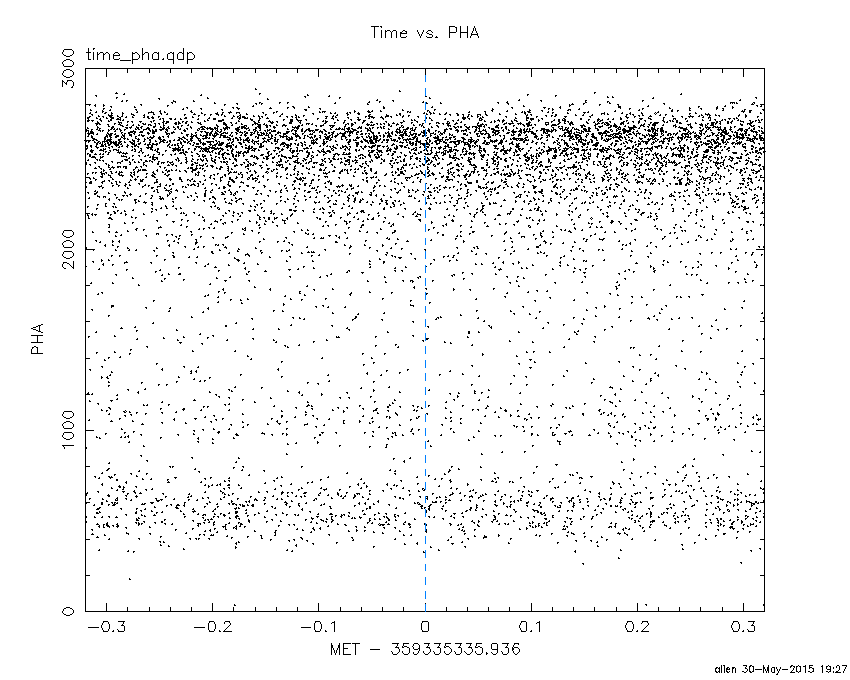
Blue+Cyan dotted lines: Time interval of the scaled map
From 0.000000 to 1.024000
TIME vs. DetID plot around the trigger time
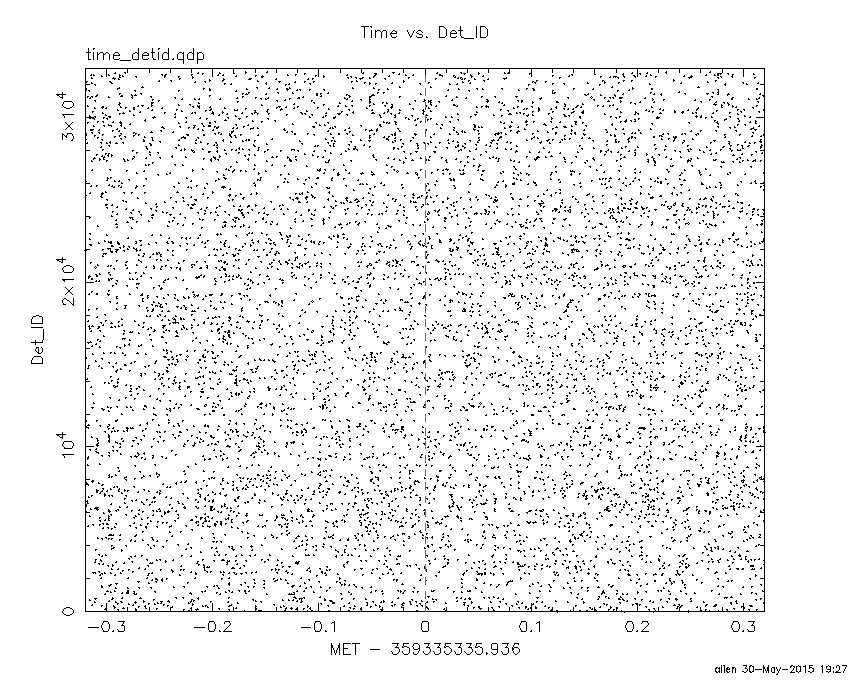
Blue+Cyan dotted lines: Time interval of the scaled map
From 0.000000 to 1.024000
100 us light curve (15-350 keV)
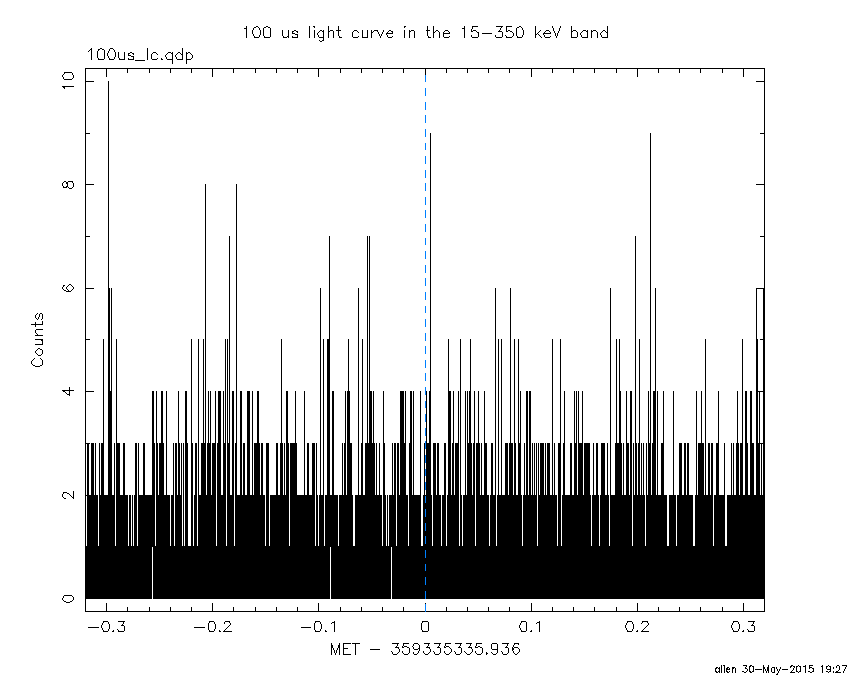
Blue+Cyan dotted lines: Time interval of the scaled map
From 0.000000 to 1.024000
Spacecraft aspect plot

Bright source in the pre-burst/pre-slew/post-slew images
Pre-burst image of 15-350 keV band
Time interval of the image:
-180.435400 -1.032000

# RAcent  DECcent POSerr Theta    Phi  PeakCts   SNR AngSep     Name
#  [deg]    [deg]    ['] [deg]  [deg]                   [']
254.5310  35.3828    4.3  40.8   44.6   1.1078   2.7    4.3	Her X-1
255.1457  31.6834    3.2  44.2   47.1   2.2271   3.6 ------	UNKNOWN
262.0384  40.0199    2.2  40.9   33.1   1.8389   5.3 ------	UNKNOWN
253.0335  46.7579    3.3  31.5   33.2   0.7756   3.5 ------	UNKNOWN
256.8369  47.5690    2.6  32.9   28.8   1.0896   4.5 ------	UNKNOWN
291.6799  41.8994    3.0  53.9    8.1   2.5165   3.8 ------	UNKNOWN
260.1969  65.7426    2.4  25.6   -6.1   0.8098   4.8 ------	UNKNOWN
136.7865  23.8453    3.7  57.8 -156.8   3.3612   3.1 ------	UNKNOWN
Pre-slew background subtracted image of 15-350 keV band
Time interval of the image:
-1.032000 17.364600

# RAcent  DECcent POSerr Theta    Phi  PeakCts   SNR AngSep     Name
#  [deg]    [deg]    ['] [deg]  [deg]                   [']
254.2424  35.2194    6.0  40.8   45.0   0.2559   1.9   12.9	Her X-1
214.2842  42.1443    0.4  19.2   95.5   1.8106  30.4 ------	UNKNOWN
Post-slew image of 15-350 keV band
Time interval of the image:
58.364580 962.155200

# RAcent  DECcent POSerr Theta    Phi  PeakCts   SNR AngSep     Name
#  [deg]    [deg]    ['] [deg]  [deg]                   [']
254.5710  35.2906    7.7  31.9   24.5  -1.1249  -1.5    6.4	Her X-1
231.2659  38.1436    2.8  13.6   37.2   2.1098   4.1 ------	UNKNOWN
179.9748  14.3254    4.0  40.6  172.7   2.4520   2.9 ------	UNKNOWN
297.9933  46.4136    3.5  57.2   -9.7   7.9817   3.3 ------	UNKNOWN
150.5318  19.2332    3.2  58.0 -156.8  12.4974   3.7 ------	UNKNOWN
Plot creation:
Sat May 30 19:27:14 EDT 2015