Click here for the BAT GCN circular template
Image
Pre-slew 15-350 keV image (Event data; bkg subtracted)

#   RAcent  DECcent POSerr  Theta    Phi     Peak Cts     SNR  Name
  282.7980  +0.0006 0.0357   17.6 -172.0       0.5217     5.4  TRIG_00524542
------------------------------------------

Foreground time interval of the image:
  0.000  64.000 (delta_t =  64.000 [sec])
Background time interval of the image:
Lightcurves
Notes:
- 1) All plots contain as much data as has been downloaded to date.
- 2) The mask-weighted light curves are using the flight position.
- 3) Multiple plots of different time binning/intervals are shown to cover all scenarios of short/long GRBs, rate/image triggers, and real/false positives.
- 4) For all the mask-weighted lightcurves, the y-axis units are counts/sec/det where a det is 0.4 x 0.4 = 0.16 sq cm.
- 5) The verticle lines correspond to following: green dotted lines are T50 interval, black dotted lines are T90 interval, blue solid line(s) is a spacecraft slew start time, and orange solid line(s) is a spacecraft slew end time.
- 6) Time of each bin is in the middle of the bin.
1 s binning
From T0-310 s to T0+310 s

From T100_start - 20 s to T100_end + 30 s

Full time interval

64 ms binning
Full time interval

From T100_start to T100_end

From T0-5 sec to T0+5 sec

16 ms binning
From T100_start-5 s to T100_start+5 s

8 ms binning
From T100_start-3 s to T100_start+3 s

2 ms binning
From T100_start-1 s to T100_start+1 s

SN=5 or 10 sec. binning (whichever binning is satisfied first)

SN=5 or 10 sec. binning (T < 200 sec)

Flight mask-tagged light curves
Caution: Mask-weight map is always using the same on-axis map


Quad-rate summed light curves (from T0-300 to T0+1000)

The mask-weighted light curves based on cleaned DPHs

Spectra
Notes:
- 1) The fitting includes the systematic errors.
- 2) For long bursts, a spectral fit of the pre-slew DRM will introduce some errors in both a spectral shape and a normalization if the PHA file contains a lot of the slew/post-slew time interval.
- 3) For fits to more complicated models (e.g. a power-law over a cutoff power-law), the BAT team has decided to require a chi-square improvement of more than 6 for each extra dof.
- 4) For short bursts (T90<1sec), the specrtum is also fit with Blackbody, OTTB, and Double Blackbody.
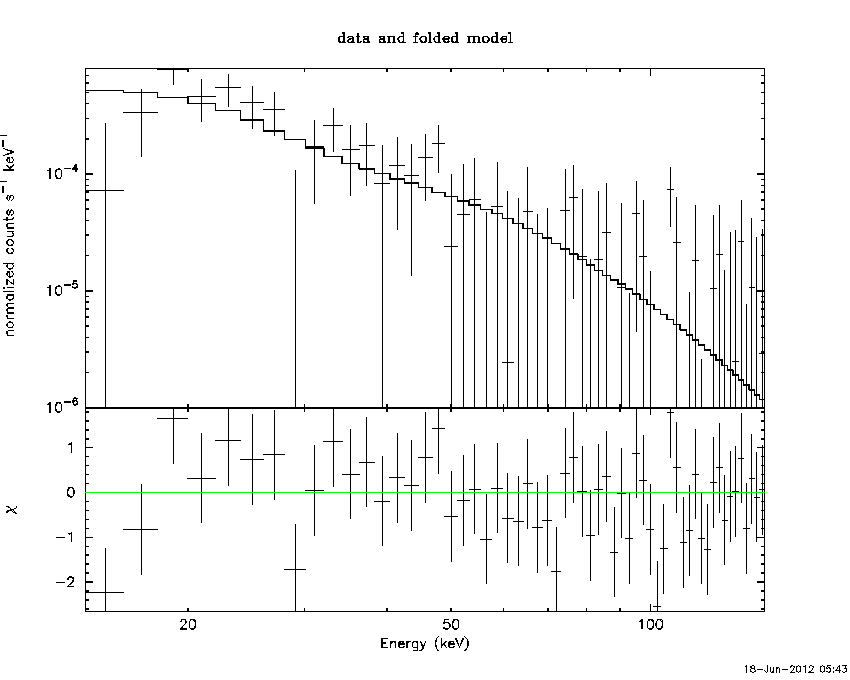
Time averaged spectrum fit using the pre-slew DRM
Power-law model

Time interval is from    0.000 sec. to   64.000 sec.

Spectral model in power-law:
------------------------------------------------------------
Parameters  : value       lower 90%   higher 90%
Photon index: 2.38895     ( -0.389472   0.449393 )
Norm@50keV  : 4.27540E-04    ( -0.000143885   0.000147132 )
------------------------------------------------------------
# Chi-Squared =          49.83 using 59 PHA bins.
# Reduced chi-squared =         0.8742 for     57 degrees of freedom
# Null hypothesis probability =   7.384804e-01

Photon flux (15-150 keV)    in 64 sec: 7.86066E-02 ( -0.0176868  0.0177262 ) ph/cm2/s
Energy fluence (15-150 keV)             : 2.66509e-07 ( -7.18182e-08  7.7168e-08 ) ergs/cm2
Cutoff power-law model

Time interval is from    0.000 sec. to   64.000 sec.
Spectral model in the cutoff power-law:
------------------------------------------------------------
Parameters  : value       lower 90%   higher 90%
Photon index: -0.981924     ( -4.22571   2.27004 )
Epeak [keV] : 28.8443      ( -4.87013 6.98637 )
Norm@50keV  : 7.52615E-02    ( -0.0852632   76.1295 )
------------------------------------------------------------
# Chi-Squared =          42.60 using 59 PHA bins.
# Reduced chi-squared =         0.7606 for     56 degrees of freedom
# Null hypothesis probability =   9.066299e-01

Photon flux (15-150 keV)    in 64 sec: 7.67571E-02 ( -0.0168123  0.0169436 ) ph/cm2/s
Energy fluence (15-150 keV)             : 2.2229e-07 ( -5.38035e-08  6.17152e-08 ) ergs/cm2
Band function

Time interval is from    0.000 sec. to   64.000 sec.

Spectral model in the Band function:
------------------------------------------------------------
Parameters  : value       lower 90%   higher 90%
alpha       : 1.00563   ( -2.14611   -0.875341 )
beta        : -9.99979    ( 15454.9   15464.9 )
Epeak [keV] : 28.8491      ( -9.13019 6.95053 )
Norm@50keV   : 7.81489E-02    ( -0.0952722   21.9703 )
------------------------------------------------------------
# Chi-Squared =          42.59 using 59 PHA bins.
# Reduced chi-squared =         0.7744 for     55 degrees of freedom
# Null hypothesis probability =   8.889745e-01

Photon flux (15-150 keV)    in 64 sec:  (    ) ph/cm2/s
Energy fluence (15-150 keV)             : 0 ( 0  0 ) ergs/cm2
Single BB

Spectral model blackbody:
------------------------------------------------------------
Parameters  : value    Lower 90%  Upper 90%
kT [keV]    : 7.48181  (-1.39413  1.67907)
R^2/D10^2   : 0.124089  (-0.070576   0.165116)
(R is the radius in km and D10 is the distance to the source in units of 10 kpc)
------------------------------------------------------------
# Chi-Squared =          42.67 using 59 PHA bins.
# Reduced chi-squared =         0.7486 for     57 degrees of freedom
# Null hypothesis probability =   9.208448e-01

Energy  Fluence     90% Error
[keV]   [erg/cm2]   [erg/cm2]
15- 25  7.613e-08   3.066e-08
25- 50  1.182e-07   5.262e-08
50-150  2.478e-08   1.608e-08
15-150  2.191e-07   9.315e-08
Thermal bremsstrahlung (OTTB)

Spectral model: thermal bremsstrahlung
------------------------------------------------------------
Parameters  : value         Lower 90%    Upper 90%
kT [keV]    : 32.4026       (-11.5358      21.743)
Norm        : 0.616073       (-0.210126     0.327568)
------------------------------------------------------------
# Chi-Squared =          45.50 using 59 PHA bins.
# Reduced chi-squared =         0.7983 for     57 degrees of freedom
# Null hypothesis probability =   8.633932e-01

Energy  Fluence     90% Error
[keV]   [erg/cm2]   [erg/cm2]
15- 25  8.330e-08   2.838e-08
25- 50  9.919e-08   4.042e-08
50-150  5.995e-08   4.070e-08
15-150  2.424e-07   8.646e-08
Double BB

Spectral model: bbodyrad<1> + bbodyrad<2>
------------------------------------------------------------
Parameters  : value         Lower 90%    Upper 90%
kT1 [keV]   : 5.29215        (-5.30984      -5.30984)
R1^2/D10^2  : 0.154330        (-0.153935      -0.153935)
kT2 [keV]   : 8.47617        (-8.55007      -8.55007)
R2^2/D10^2  : 5.57729E-02    (-0.0524914   0.231096)
------------------------------------------------------------
# Chi-Squared =          42.54 using 59 PHA bins.
# Reduced chi-squared =         0.7735 for     55 degrees of freedom
# Null hypothesis probability =   8.900478e-01

Energy  Fluence     90% Error
[keV]   [erg/cm2]   [erg/cm2]
15- 25  7.823e-08   3.853e-07
25- 50  1.156e-07   1.756e-06
50-150  3.067e-08   6.157e-06
15-150  2.245e-07   4.922e-06
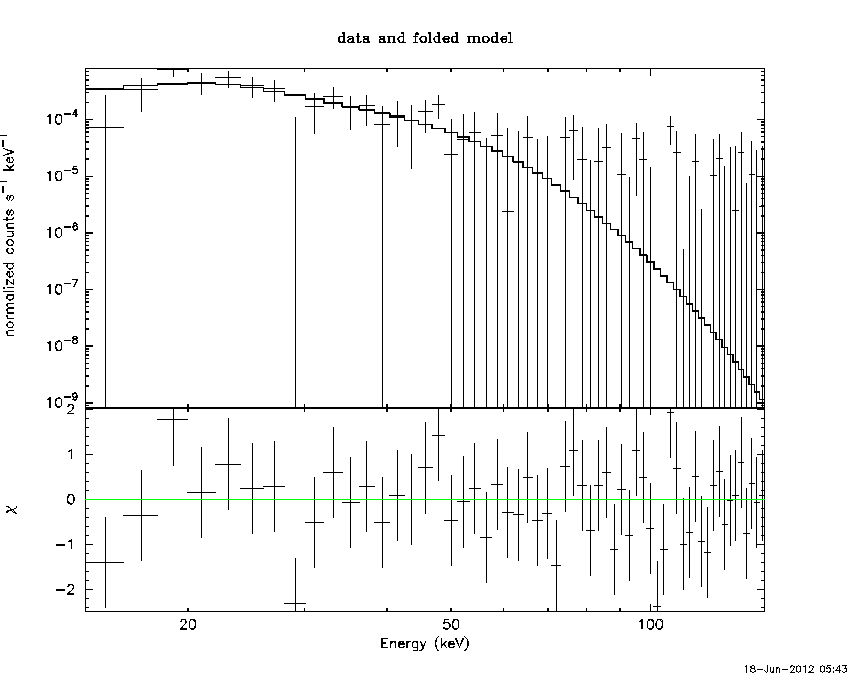
Peak spectrum fit
Power-law model

Time interval is from    0.000 sec. to   64.000 sec.

Spectral model in power-law:
------------------------------------------------------------
Parameters  : value       lower 90%   higher 90%
Photon index: 2.38895     ( -0.389472   0.449393 )
Norm@50keV  : 4.27540E-04    ( -0.000143885   0.000147132 )
------------------------------------------------------------
# Chi-Squared =          49.83 using 59 PHA bins.
# Reduced chi-squared =         0.8742 for     57 degrees of freedom
# Null hypothesis probability =   7.384804e-01

Photon flux (15-150 keV)    in 64 sec: 7.86066E-02 ( -0.0176868  0.0177262 ) ph/cm2/s
Energy fluence (15-150 keV)             : 2.66509e-07 ( -7.18182e-08  7.7168e-08 ) ergs/cm2
Cutoff power-law model

Time interval is from    0.000 sec. to   64.000 sec.
Spectral model in the cutoff power-law:
------------------------------------------------------------
Parameters  : value       lower 90%   higher 90%
Photon index: -0.981924     ( -4.22571   2.27004 )
Epeak [keV] : 28.8443      ( -4.87013 6.9908 )
Norm@50keV  : 7.52615E-02    ( -0.0852632   76.1295 )
------------------------------------------------------------
# Chi-Squared =          42.60 using 59 PHA bins.
# Reduced chi-squared =         0.7606 for     56 degrees of freedom
# Null hypothesis probability =   9.066299e-01

Photon flux (15-150 keV)    in 64 sec: 7.67571E-02 ( -0.0168123  0.0169436 ) ph/cm2/s
Energy fluence (15-150 keV)             : 2.2229e-07 ( -5.38035e-08  6.17152e-08 ) ergs/cm2
Band function

Time interval is from    0.000 sec. to   64.000 sec.

Spectral model in the Band function:
------------------------------------------------------------
Parameters  : value       lower 90%   higher 90%
alpha       : 1.00563   ( -2.14611   -0.875341 )
beta        : -9.99979    ( 15454.9   15464.9 )
Epeak [keV] : 28.8491      ( -9.13019 6.95053 )
Norm@50keV   : 7.81489E-02    ( -0.0952722   21.9626 )
------------------------------------------------------------
# Chi-Squared =          42.59 using 59 PHA bins.
# Reduced chi-squared =         0.7744 for     55 degrees of freedom
# Null hypothesis probability =   8.889745e-01

Photon flux (15-150 keV)    in 64 sec:  (    ) ph/cm2/s
Energy fluence (15-150 keV)             : 0 ( 0  0 ) ergs/cm2
Single BB

Spectral model blackbody:
------------------------------------------------------------
Parameters  : value    Lower 90%  Upper 90%
kT [keV]    : 7.48181  (-1.39413  1.67907)
R^2/D10^2   : 0.124089  (-0.070576   0.165116)
(R is the radius in km and D10 is the distance to the source in units of 10 kpc)
------------------------------------------------------------
# Chi-Squared =          42.67 using 59 PHA bins.
# Reduced chi-squared =         0.7486 for     57 degrees of freedom
# Null hypothesis probability =   9.208448e-01

Energy  Fluence     90% Error
[keV]   [erg/cm2]   [erg/cm2]
15- 25  7.613e-08   3.501e-08
25- 50  1.182e-07   5.070e-08
50-150  2.478e-08   1.613e-08
15-150  2.191e-07   9.856e-08
Thermal bremsstrahlung (OTTB)

Spectral model: thermal bremsstrahlung
------------------------------------------------------------
Parameters  : value         Lower 90%    Upper 90%
kT [keV]    : 32.4026       (-11.5358      21.743)
Norm        : 0.616073       (-0.210126     0.327568)
------------------------------------------------------------
# Chi-Squared =          45.50 using 59 PHA bins.
# Reduced chi-squared =         0.7983 for     57 degrees of freedom
# Null hypothesis probability =   8.633932e-01

Energy  Fluence     90% Error
[keV]   [erg/cm2]   [erg/cm2]
15- 25  8.330e-08   3.022e-08
25- 50  9.919e-08   3.738e-08
50-150  5.995e-08   4.117e-08
15-150  2.424e-07   1.005e-07
Double BB

Spectral model: bbodyrad<1> + bbodyrad<2>
------------------------------------------------------------
Parameters  : value         Lower 90%    Upper 90%
kT1 [keV]   : 5.29215        (-5.30984      -5.30984)
R1^2/D10^2  : 0.154330        (-0.153935      -0.153935)
kT2 [keV]   : 8.47617        (-8.55007      -8.55007)
R2^2/D10^2  : 5.57729E-02    (-0.0524914   0.231096)
------------------------------------------------------------
# Chi-Squared =          42.54 using 59 PHA bins.
# Reduced chi-squared =         0.7735 for     55 degrees of freedom
# Null hypothesis probability =   8.900478e-01

Energy  Fluence     90% Error
[keV]   [erg/cm2]   [erg/cm2]
15- 25  7.823e-08   6.365e-07
25- 50  1.156e-07   1.965e-06
50-150  3.067e-08   4.720e-06
15-150  2.245e-07   6.723e-06
Pre-slew spectrum (Pre-slew PHA with pre-slew DRM)
Power-law model
Spectral model in power-law:
------------------------------------------------------------
Parameters  : value       lower 90%   higher 90%
Photon index: 2.38895     ( -0.389472   0.449393 )
Norm@50keV  : 4.27540E-04    ( -0.000143885   0.000147132 )
------------------------------------------------------------
# Chi-Squared =          49.83 using 59 PHA bins.
# Reduced chi-squared =         0.8742 for     57 degrees of freedom
# Null hypothesis probability =   7.384804e-01

Photon flux (15-150 keV)    in 64 sec: 7.86066E-02 ( -0.0176868  0.0177262 ) ph/cm2/s
Energy fluence (15-150 keV)             : 2.66509e-07 ( -7.18182e-08  7.7168e-08 ) ergs/cm2
Cutoff power-law model
Spectral model in the cutoff power-law:
------------------------------------------------------------
Parameters  : value       lower 90%   higher 90%
Photon index: -0.981924     ( -4.22571   2.27004 )
Epeak [keV] : 28.8443      ( -4.87013 6.99687 )
Norm@50keV  : 7.52615E-02    ( -0.0852632   76.1295 )
------------------------------------------------------------
# Chi-Squared =          42.60 using 59 PHA bins.
# Reduced chi-squared =         0.7606 for     56 degrees of freedom
# Null hypothesis probability =   9.066299e-01

Photon flux (15-150 keV)    in 64 sec: 7.67571E-02 ( -0.0168123  0.0169436 ) ph/cm2/s
Energy fluence (15-150 keV)             : 2.2229e-07 ( -5.38035e-08  6.17152e-08 ) ergs/cm2
Band function

Spectral model in the Band function:
------------------------------------------------------------
Parameters  : value       lower 90%   higher 90%
alpha       : 1.00563   ( -2.14611   -0.875341 )
beta        : -9.99979    ( 15454.9   15464.9 )
Epeak [keV] : 28.8491      ( -9.13019 6.95053 )
Norm@50keV   : 7.81489E-02    ( -0.0952722   21.9862 )
------------------------------------------------------------
# Chi-Squared =          42.59 using 59 PHA bins.
# Reduced chi-squared =         0.7744 for     55 degrees of freedom
# Null hypothesis probability =   8.889745e-01

Photon flux (15-150 keV)    in 64 sec:  (    ) ph/cm2/s
Energy fluence (15-150 keV)             : 0 ( 0  0 ) ergs/cm2
S(25-50 keV) vs. S(50-100 keV) plot

S(25-50 keV)  = 8.72422e-08
S(50-100 keV) = 6.67386e-08
T90 vs. Hardness ratio plot

T90                                   = 64 sec.
Hardness ratio (energy fluence ratio) = 0.764981
Color vs. Color plot

Count Ratio  (25-50 keV) / (15-25 keV) = 0.814805
Count Ratio (50-100 keV) / (15-25 keV) = 0.127404
Mask shadow pattern

IMX = -3.138341780589828E-01, IMY = 4.412070835592503E-02
TIME vs. PHA plot around the trigger time

TIME vs. DetID plot around the trigger time

100 us light curve (15-350 keV)

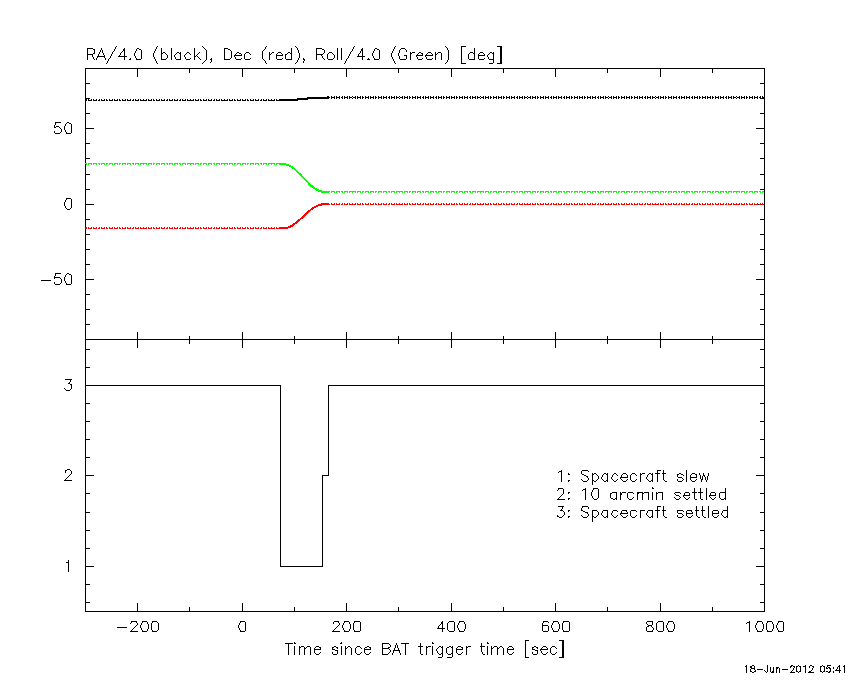
Spacecraft aspect plot
Bright source in the pre-burst/pre-slew/post-slew images
Pre-burst image of 15-350 keV band
Time interval of the image:
Pre-slew background subtracted image of 15-350 keV band
Time interval of the image:
0.000000 64.000000

# RAcent  DECcent POSerr Theta    Phi  PeakCts   SNR AngSep     Name
#  [deg]    [deg]    ['] [deg]  [deg]                   [']
244.9952 -15.6377    0.7  29.4   69.9   2.5514  15.8    0.9	Sco X-1
255.8260 -37.7988    3.2  27.8   18.2   0.3955   3.6    8.1	4U 1700-377
256.3121 -36.3095    4.0  26.5   19.9   0.2968   2.8    9.1	GX 349+2
263.0975 -24.7844    6.0  14.6   34.5   0.1836   1.9    5.4	GX 1+4
264.6681 -44.3371    4.0  29.7   -0.9   0.3397   2.9    7.5	4U 1735-44
268.2107  -1.5307  113.9  16.2  136.1  -0.0103  -0.1   10.5	SW J1753.5-0127
270.3227 -25.2492    6.9  10.4   10.5   0.1643   1.7   10.4	GX 5-1
270.2455 -25.6908    6.4  10.8    9.7   0.2164   2.2    4.4	GRS 1758-258
273.9321 -14.1712    4.8   2.5  123.6   0.2335   2.4    9.2	GX 17+2
275.8778 -30.2855    4.6  14.2  -17.8   0.2366   2.5    5.5	H1820-303
284.9483 -24.9860    9.6  12.5  -59.7   0.1210   1.2    6.2	HT1900.1-2455
288.8323  10.9271    2.3  30.0 -169.9   0.5432   5.1    2.3	GRS 1915+105
299.6394  35.2172    4.3  56.1 -173.0   1.1710   2.7    2.6	Cyg X-1
263.0736 -33.7653    3.4  21.0   13.5   0.3515   3.4    5.9	GX 354-0
229.7695 -23.8816    2.0  43.5   55.4   2.2007   5.8 ------	UNKNOWN
282.7980   0.0006    2.1  17.6 -172.0   0.5218   5.4 ------	UNKNOWN
293.3879  25.9915    2.3  45.5 -174.0   0.8661   5.1 ------	UNKNOWN
307.5162  34.6025    3.2  59.1 -166.1   2.3517   3.6 ------	UNKNOWN
317.6747 -36.6950    2.6  42.5  -69.4   2.1120   4.5 ------	UNKNOWN
Post-slew image of 15-350 keV band
Time interval of the image:
152.900600 963.112300

# RAcent  DECcent POSerr Theta    Phi  PeakCts   SNR AngSep     Name
#  [deg]    [deg]    ['] [deg]  [deg]                   [']
244.9798 -15.6472    0.9  40.5  122.8  30.2480  13.5    0.4	Sco X-1
254.4497  35.2344   74.8  44.0 -156.6   0.1468   0.2    6.5	Her X-1
263.0268 -24.7462  214.2  31.3   93.6   0.0627   0.1    1.0	GX 1+4
268.3574  -1.4516    2.7  14.5  141.5   2.2744   4.3    0.6	SW J1753.5-0127
270.4845 -25.0223    9.2  27.7   81.9   1.2192   1.3   11.4	GX 5-1
270.3306 -25.5958    7.2  28.3   81.7   1.6330   1.6    9.0	GRS 1758-258
273.9950 -13.9851    2.7  16.5   89.0   2.4318   4.3    3.1	GX 17+2
276.0125 -30.3823    3.4  31.1   68.8   3.4390   3.4    4.6	H1820-303
284.8079 -24.9700    0.0  25.1   53.1   1.9260   2.9   12.8	HT1900.1-2455
288.8221  10.9502    0.9  12.4  -94.3   7.0573  12.9    1.4	GRS 1915+105
299.5907  35.1849    1.4  38.5 -100.4  19.3369   8.2    1.0	Cyg X-1
263.0046 -33.8936    6.3  38.7   84.1   5.1221   1.8    3.6	GX 354-0
244.5016 -12.9138    3.4  40.1  127.0   6.4635   3.5 ------	UNKNOWN
320.5340 -25.0580    3.4  44.2    4.8   3.1867   3.4 ------	UNKNOWN
327.5264  -1.1563    3.4  44.7  -31.0   2.9629   3.4 ------	UNKNOWN
240.9652  44.5712    4.1  57.9 -156.8  10.9577   2.8 ------	UNKNOWN
258.7820  49.0674    3.2  53.2 -142.1  11.3029   3.6 ------	UNKNOWN
253.8480  49.4016    4.8  55.3 -145.2  11.6271   2.4 ------	UNKNOWN
300.9281  37.7746    2.8  41.3 -100.8  13.0865   4.1 ------	UNKNOWN
Plot creation:
Mon Jun 18 05:44:19 EDT 2012