Special notes of this burst
Image
Pre-slew 15.0-350.0 keV image (Event data)

#   RAcent    DECcent   POSerr    Theta     Phi              Peak Cts       SNR   Name
  170.8828     8.9315   0.0022    15.6865  -108.9418        23.9560912     85.771 TRIG_00525068

Foreground time interval of the image:
-15.124 139.885 (delta_t = 155.009 [sec])
Background time interval of the image:
-239.016 -15.124 (delta_t = 223.892 [sec])
Lightcurves
Notes:
- 1) The mask-weighted light curves are using the flight position.
- 2) Multiple plots of different time binning/intervals are shown to cover all scenarios of short/long GRBs, rate/image triggers, and real/false positives.
- 3) For all the mask-weighted lightcurves, the y-axis units are counts/sec/det where a det is 0.4 x 0.4 = 0.16 sq cm.
- 4) The verticle lines correspond to following: green dotted lines are T50 interval, black dotted lines are T90 interval, blue solid line(s) is a spacecraft slew start time, and orange solid line(s) is a spacecraft slew end time.
- 5) Time of each bin is in the middle of the bin.
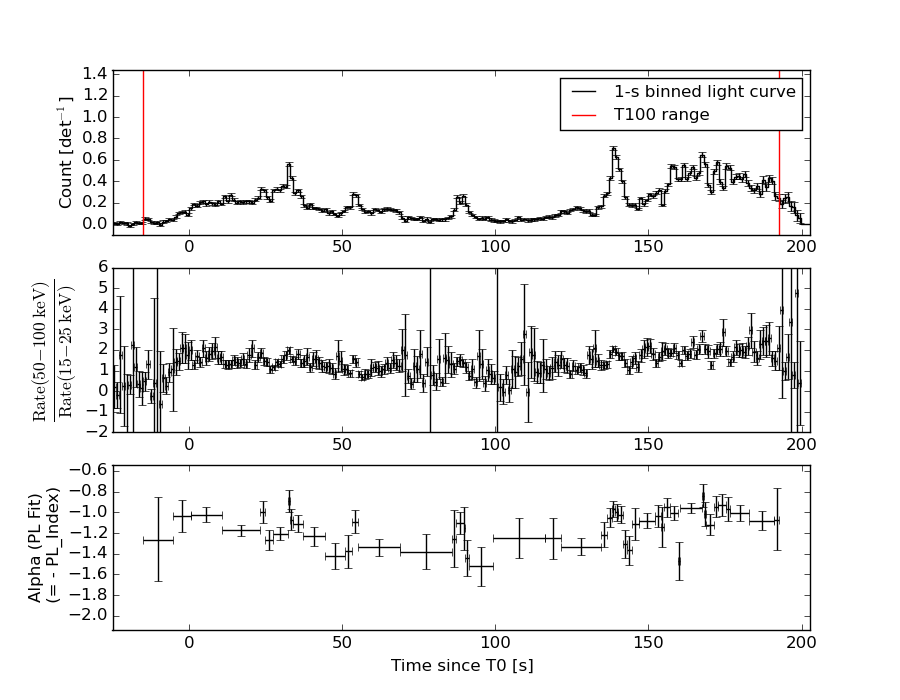
1 s binning
From T0-310 s to T0+310 s

From T100_start - 20 s to T100_end + 30 s

Full time interval

64 ms binning
Full time interval

From T100_start to T100_end

From T0-5 sec to T0+5 sec

16 ms binning
From T100_start-5 s to T100_start+5 s

8 ms binning
From T100_start-3 s to T100_start+3 s

2 ms binning
From T100_start-1 s to T100_start+1 s

SN=5 or 10 sec. binning (whichever binning is satisfied first)

SN=5 or 10 sec. binning (T < 200 sec)
Quad-rate summed light curves (from T0-300s to T0+1000s)

Spectral Evolution
Spectra
Notes:
- 1) The fitting includes the systematic errors.
- 2) When the burst includes telescope slew time periods, the fitting uses an average response file made from multiple 5-s response files through out the slew time plus single time preiod for the non-slew times, and weighted by the total counts in the corresponding time period using addrmf. An average response file is needed becuase a spectral fit using the pre-slew DRM will introduce some errors in both a spectral shape and a normalization if the PHA file contains a lot of the slew/post-slew time interval.
- 3) For fits to more complicated models (e.g. a power-law over a cutoff power-law), the BAT team has decided to require a chi-square improvement of more than 6 for each extra dof.
Time averaged spectrum fit using the average DRM
Power-law model

Time interval is from  -15.124 sec. to  192.772 sec.

Spectral model in power-law:
------------------------------------------------------------
Parameters  : value       lower 90%   higher 90%
Photon index: 1.11617     ( -0.0270059   0.0268945 )
Norm@50keV  : 1.36740E-02    ( -0.00020404   0.000203042 )
------------------------------------------------------------
#Fit statistic : Chi-Squared =          38.77 using 59 PHA bins.
# Reduced chi-squared =         0.6801 for     57 degrees of freedom
# Null hypothesis probability =   9.692294e-01

Photon flux (15-150 keV)    in 207.9 sec: 1.58866 ( -0.0257845  0.0259414 ) ph/cm2/s
Energy fluence (15-150 keV)             : 2.95707e-05 ( -4.02436e-07  4.02538e-07 ) ergs/cm2
Cutoff power-law model

Time interval is from  -15.124 sec. to  192.772 sec.
Spectral model in the cutoff power-law:
------------------------------------------------------------
Parameters  : value       lower 90%   higher 90%
Photon index: 1.11159     ( -0.0283388   0.0260507 )
Epeak [keV] : 9999.36      ( -9999.36 -9999.36 )
Norm@50keV  : 1.37481E-02    ( -0.000190892   0.000639305 )
------------------------------------------------------------
#Fit statistic : Chi-Squared =          39.12 using 59 PHA bins.
# Reduced chi-squared =         0.6986 for     56 degrees of freedom
# Null hypothesis probability =   9.578205e-01

Photon flux (15-150 keV)    in 207.9 sec: 1.58771 ( -0.02582  0.02587 ) ph/cm2/s
Energy fluence (15-150 keV)             : 2.95754e-05 ( -3.99168e-07  4.0395e-07 ) ergs/cm2
Band function
Time interval is from  -15.124 sec. to  192.772 sec.

Spectral model in the Band function:
------------------------------------------------------------
Parameters  : value       lower 90%   higher 90%
alpha       : -0.766749   ( 0.847056   5.8378 )
beta        : -1.11792    ( -0.0269344   0.0270108 )
Epeak [keV] : 92.0202      ( -62.6305 -62.6305 )
Norm@50keV   : 2.43950E-02    ( -0.0101751   475407 )
------------------------------------------------------------
#Fit statistic : Chi-Squared =          38.56 using 59 PHA bins.
# Reduced chi-squared =         0.7011 for     55 degrees of freedom
# Null hypothesis probability =   9.547407e-01

Photon flux (15-150 keV)    in 207.9 sec:  (    ) ph/cm2/s
Energy fluence (15-150 keV)             : 0 ( 0  0 ) ergs/cm2
Single BB
Spectral model blackbody:
------------------------------------------------------------
Parameters  : value    Lower 90%  Upper 90%
kT [keV]    : 24.3543  (  )
R^2/D10^2   : 3.86714E-02  (   )
(R is the radius in km and D10 is the distance to the source in units of 10 kpc)
------------------------------------------------------------
#Fit statistic : Chi-Squared =        1031.42 using 59 PHA bins.
# Reduced chi-squared =        18.0951 for     57 degrees of freedom
# Null hypothesis probability =  7.691724e-179

Energy  Fluence     90% Error
[keV]   [erg/cm2]   [erg/cm2]
15- 25  8.398e-07   2.568e-08
25- 50  4.700e-06   1.112e-07
50-150  2.074e-05   3.555e-07
15-150  2.628e-05   4.054e-07
Thermal bremsstrahlung (OTTB)
Spectral model: thermal bremsstrahlung
------------------------------------------------------------
Parameters  : value         Lower 90%    Upper 90%
kT [keV]    : 199.363       (      )
Norm        : 7.14613       (     )
------------------------------------------------------------
#Fit statistic : Chi-Squared =        1001.54 using 59 PHA bins.
# Reduced chi-squared =        17.5710 for     57 degrees of freedom
# Null hypothesis probability =  1.055181e-172

Energy  Fluence     90% Error
[keV]   [erg/cm2]   [erg/cm2]
15- 25  3.699e-06   6.341e-08
25- 50  7.116e-06   1.175e-07
50-150  1.561e-05   2.422e-07
15-150  2.642e-05   3.950e-07
Double BB

Spectral model: bbodyrad<1> + bbodyrad<2>
------------------------------------------------------------
Parameters  : value         Lower 90%    Upper 90%
kT1 [keV]   : 8.95085        (-0.546227      0.576808)
R1^2/D10^2  : 0.588008        (-0.108046      0.138031)
kT2 [keV]   : 39.8354        (-2.33109      2.81305)
R2^2/D10^2  : 7.19935E-03    (-0.00134534   0.0014841)
------------------------------------------------------------
#Fit statistic : Chi-Squared =          50.27 using 59 PHA bins.
# Reduced chi-squared =         0.9140 for     55 degrees of freedom
# Null hypothesis probability =   6.555978e-01

Energy  Fluence     90% Error
[keV]   [erg/cm2]   [erg/cm2]
15- 25  2.209e-06   1.324e-07
25- 50  6.101e-06   1.684e-07
50-150  2.142e-05   5.353e-07
15-150  2.973e-05   6.133e-07
Peak spectrum fit
Power-law model
Time interval is from  138.056 sec. to  139.056 sec.

Spectral model in power-law:
------------------------------------------------------------
Parameters  : value       lower 90%   higher 90%
Photon index: 0.966001     ( -0.0778721   0.0773949 )
Norm@50keV  : 4.77714E-02    ( -0.00211306   0.00211202 )
------------------------------------------------------------
#Fit statistic : Chi-Squared =          51.34 using 59 PHA bins.
# Reduced chi-squared =         0.9007 for     57 degrees of freedom
# Null hypothesis probability =   6.864192e-01

Photon flux (15-150 keV)    in 1 sec: 5.49144 ( -0.244908  0.245039 ) ph/cm2/s
Energy fluence (15-150 keV)             : 5.22955e-07 ( -2.61174e-08  2.61839e-08 ) ergs/cm2
Cutoff power-law model

Time interval is from  138.056 sec. to  139.056 sec.
Spectral model in the cutoff power-law:
------------------------------------------------------------
Parameters  : value       lower 90%   higher 90%
Photon index: 0.500760     ( -0.342004   0.316328 )
Epeak [keV] : 185.881      ( -54.9171 249.223 )
Norm@50keV  : 7.67773E-02    ( -0.0207001   0.0307 )
------------------------------------------------------------
#Fit statistic : Chi-Squared =          44.82 using 59 PHA bins.
# Reduced chi-squared =         0.8004 for     56 degrees of freedom
# Null hypothesis probability =   8.581297e-01

Photon flux (15-150 keV)    in 1 sec: 5.38882 ( -0.25467  0.25443 ) ph/cm2/s
Energy fluence (15-150 keV)             : 5.1149e-07 ( -2.7867e-08  2.775e-08 ) ergs/cm2
Band function

Time interval is from  138.056 sec. to  139.056 sec.

Spectral model in the Band function:
------------------------------------------------------------
Parameters  : value       lower 90%   higher 90%
alpha       : 4.99997   ( -4.99997   -4.99997 )
beta        : -0.983674    ( -0.0811842   0.080822 )
Epeak [keV] : 23.8285      ( -23.8285 5.04406 )
Norm@50keV   : 4113.90    ( -180.882   6.86352e+06 )
------------------------------------------------------------
#Fit statistic : Chi-Squared =          50.37 using 59 PHA bins.
# Reduced chi-squared =         0.9158 for     55 degrees of freedom
# Null hypothesis probability =   6.518486e-01

Photon flux (15-150 keV)    in 1 sec: 5.38965 (    ) ph/cm2/s
Energy fluence (15-150 keV)             : 0 ( 0  0 ) ergs/cm2
Single BB

Spectral model blackbody:
------------------------------------------------------------
Parameters  : value    Lower 90%  Upper 90%
kT [keV]    : 22.1755  (-1.29187  1.40531)
R^2/D10^2   : 0.195533  (-0.0336574   0.0398744)
(R is the radius in km and D10 is the distance to the source in units of 10 kpc)
------------------------------------------------------------
#Fit statistic : Chi-Squared =         100.79 using 59 PHA bins.
# Reduced chi-squared =         1.7683 for     57 degrees of freedom
# Null hypothesis probability =   3.120523e-04

Energy  Fluence     90% Error
[keV]   [erg/cm2]   [erg/cm2]
15- 25  1.773e-08   1.615e-09
25- 50  9.419e-08   5.935e-09
50-150  3.461e-07   2.650e-08
15-150  4.581e-07   2.630e-08
Thermal bremsstrahlung (OTTB)

Spectral model: thermal bremsstrahlung
------------------------------------------------------------
Parameters  : value         Lower 90%    Upper 90%
kT [keV]    : 199.363       (      )
Norm        : 21.6140       (     )
------------------------------------------------------------
#Fit statistic : Chi-Squared =         193.34 using 59 PHA bins.
# Reduced chi-squared =         3.3919 for     57 degrees of freedom
# Null hypothesis probability =   9.927930e-17

Energy  Fluence     90% Error
[keV]   [erg/cm2]   [erg/cm2]
15- 25  5.382e-08   2.640e-09
25- 50  1.035e-07   5.595e-09
50-150  2.271e-07   4.325e-08
15-150  3.844e-07   3.110e-08
Double BB

Spectral model: bbodyrad<1> + bbodyrad<2>
------------------------------------------------------------
Parameters  : value         Lower 90%    Upper 90%
kT1 [keV]   : 6.80515        (-1.61473      2.11073)
R1^2/D10^2  : 3.37749        (-1.92429      5.60015)
kT2 [keV]   : 29.2271        (-3.18042      4.77886)
R2^2/D10^2  : 7.48298E-02    (-0.0296241   0.0347833)
------------------------------------------------------------
#Fit statistic : Chi-Squared =          43.03 using 59 PHA bins.
# Reduced chi-squared =         0.7824 for     55 degrees of freedom
# Null hypothesis probability =   8.793041e-01

Energy  Fluence     90% Error
[keV]   [erg/cm2]   [erg/cm2]
15- 25  3.454e-08   9.805e-09
25- 50  9.359e-08   1.256e-08
50-150  3.825e-07   4.105e-08
15-150  5.106e-07   5.945e-08
Pre-slew spectrum (Pre-slew PHA with pre-slew DRM)
Power-law model

Spectral model in power-law:
------------------------------------------------------------
Parameters  : value       lower 90%   higher 90%
Photon index: 1.19787     ( -0.0315644   0.031458 )
Norm@50keV  : 9.49021E-03    ( -0.000158039   0.000157603 )
------------------------------------------------------------
#Fit statistic : Chi-Squared =          27.75 using 59 PHA bins.
# Reduced chi-squared =         0.4869 for     57 degrees of freedom
# Null hypothesis probability =   9.996191e-01

Photon flux (15-150 keV)    in 155 sec: 1.11362 ( -0.0206123  0.020712 ) ph/cm2/s
Energy fluence (15-150 keV)             : 1.49327e-05 ( -2.40033e-07  2.40163e-07 ) ergs/cm2
Cutoff power-law model

Spectral model in the cutoff power-law:
------------------------------------------------------------
Parameters  : value       lower 90%   higher 90%
Photon index: 1.19282     ( -0.0317986   0.0317073 )
Epeak [keV] : 9996.82      ( -9997.51 -9997.51 )
Norm@50keV  : 9.53621E-03    ( -0.000156085   0.000688134 )
------------------------------------------------------------
#Fit statistic : Chi-Squared =          27.86 using 59 PHA bins.
# Reduced chi-squared =         0.4975 for     56 degrees of freedom
# Null hypothesis probability =   9.994100e-01

Photon flux (15-150 keV)    in 155 sec: 1.11294 (    ) ph/cm2/s
Energy fluence (15-150 keV)             : 1.48925e-05 ( -2.69375e-07  3.57693e-07 ) ergs/cm2
Band function

Spectral model in the Band function:
------------------------------------------------------------
Parameters  : value       lower 90%   higher 90%
alpha       : -0.639261   ( 0.819895   5.72257 )
beta        : -1.19998    ( -0.0341193   0.0325721 )
Epeak [keV] : 59.4277      ( -60.2053 267.599 )
Norm@50keV   : 2.48318E-02    ( -0.0156428   0 )
------------------------------------------------------------
#Fit statistic : Chi-Squared =          27.50 using 59 PHA bins.
# Reduced chi-squared =         0.5000 for     55 degrees of freedom
# Null hypothesis probability =   9.992946e-01

Photon flux (15-150 keV)    in 155 sec:  (    ) ph/cm2/s
Energy fluence (15-150 keV)             : 0 ( 0  0 ) ergs/cm2
S(25-50 keV) vs. S(50-100 keV) plot

S(25-50 keV)  = 5.90e-06
S(50-100 keV) = 1.09e-05
T90 vs. Hardness ratio plot
T90                                   = 179.663999915123 sec.
Hardness ratio (energy fluence ratio) = 1.84746
Color vs. Color plot

Count Ratio  (25-50 keV) / (15-25 keV) = 1.6202
Count Ratio (50-100 keV) / (15-25 keV) = 1.59205
Mask shadow pattern

IMX = -9.116022833228478E-02, IMY = 2.656252137694277E-01
TIME vs. PHA plot around the trigger time

TIME vs. DetID plot around the trigger time

100 us light curve (15-350 keV)
Spacecraft aspect plot

Bright source in the pre-burst/pre-slew/post-slew images
Pre-burst image of 15-350 keV band
Time interval of the image:
-239.016000 -15.124000

# RAcent  DECcent POSerr Theta    Phi  PeakCts   SNR AngSep     Name
#  [deg]    [deg]    ['] [deg]  [deg]                   [']
227.7513   7.2905    3.0  40.6   71.4   2.9745   3.8 ------	UNKNOWN
231.5882  48.6514    2.2  54.2   16.7   5.4234   5.3 ------	UNKNOWN
212.4656  44.7032    2.4  41.7    9.3   1.4665   4.9 ------	UNKNOWN
148.8587 -22.8481    2.4  49.2 -149.9   2.1765   4.8 ------	UNKNOWN
Pre-slew background subtracted image of 15-350 keV band
Time interval of the image:
-15.124000 139.884590

# RAcent  DECcent POSerr Theta    Phi  PeakCts   SNR AngSep     Name
#  [deg]    [deg]    ['] [deg]  [deg]                   [']
232.6529  42.9948    3.2  52.1   23.4   5.3529   3.6 ------	UNKNOWN
189.0461 -42.5255    2.7  52.0  159.5   5.5157   4.3 ------	UNKNOWN
215.3490  58.1905    3.1  53.4   -0.1   3.4395   3.7 ------	UNKNOWN
170.8828   8.9315    0.1  15.7 -108.9  23.9556  85.8 ------	UNKNOWN
192.3601  59.5283    2.6  50.3  -14.7   2.7196   4.4 ------	UNKNOWN
162.3136  15.4163    2.4  24.6  -91.9   1.6955   4.9 ------	UNKNOWN
Post-slew image of 15-350 keV band
Time interval of the image:
264.084590 439.784600

# RAcent  DECcent POSerr Theta    Phi  PeakCts   SNR AngSep     Name
#  [deg]    [deg]    ['] [deg]  [deg]                   [']
186.5878 -62.7182    2.7  40.8  -78.9   3.5913   4.2    3.7	GX 301-2
244.9791 -15.6383    0.6  31.7   41.4   5.2342  19.1    0.1	Sco X-1
255.9887 -37.8348    0.6   8.3   64.8   3.1737  18.8    0.6	4U 1700-377
256.6624 -36.3518    5.5   9.9   67.4   0.3761   2.1   11.8	GX 349+2
262.9888 -24.9014    5.5  22.2   79.4   0.4908   2.1    9.4	GX 1+4
264.8556 -44.6463    0.0   7.0  141.3   0.1301   0.7   12.7	4U 1735-44
270.3348 -25.1231    4.4  24.3   95.5   0.6435   2.7    3.8	GX 5-1
270.1825 -25.6387    5.5  23.8   95.8   0.5185   2.2    9.0	GRS 1758-258
273.9379 -14.1192    7.1  35.7   92.7   0.7865   1.6    6.3	GX 17+2
275.9968 -30.4327    4.3  22.5  113.4   0.6266   2.7    5.4	H1820-303
284.9686 -24.9414   42.8  31.9  118.9  -0.0870  -0.3    3.9	HT1900.1-2455
263.1042 -33.8160    3.9  13.7   89.2   0.5502   2.9    5.8	GX 354-0
  6.4305 -70.8028    3.2  53.2 -142.1   3.9363   3.6 ------	UNKNOWN
  6.6320 -67.5154    4.4  55.3 -145.3   3.9733   2.6 ------	UNKNOWN
186.7600 -36.5756    3.8  50.6  -44.6   2.8618   3.1 ------	UNKNOWN
 13.4432 -82.0456    2.6  48.0 -129.1   3.5699   4.6 ------	UNKNOWN
Plot creation:
Sat May 30 19:23:06 EDT 2015