Special notes of this burst
Image
Pre-slew 15.0-350.0 keV image (Event data)
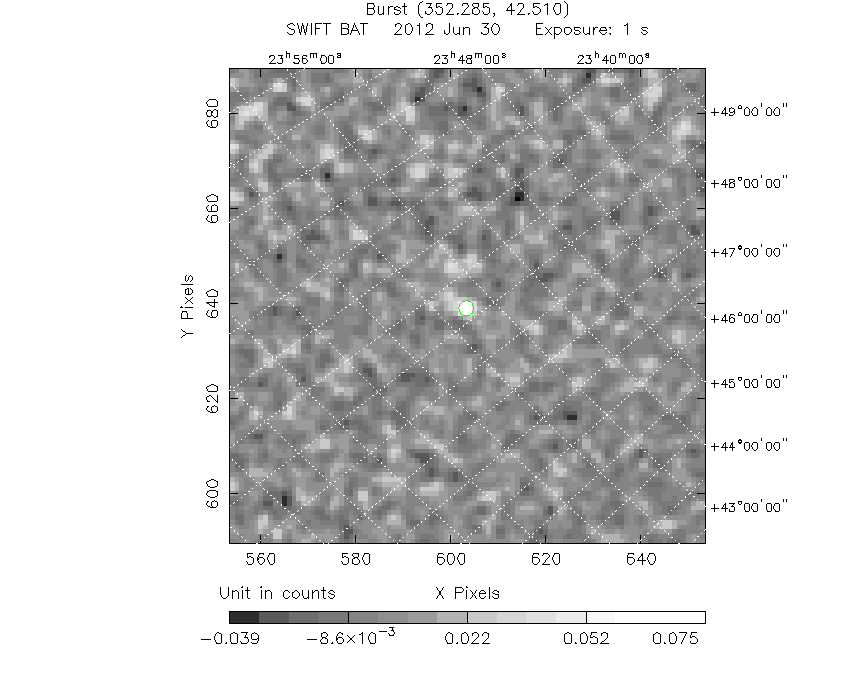
# RAcent DECcent POSerr Theta Phi Peak Cts SNR Name
352.3016 42.4946 0.0265 33.9638 -30.4332 0.0838499 7.262 TRIG_00525451
Foreground time interval of the image:
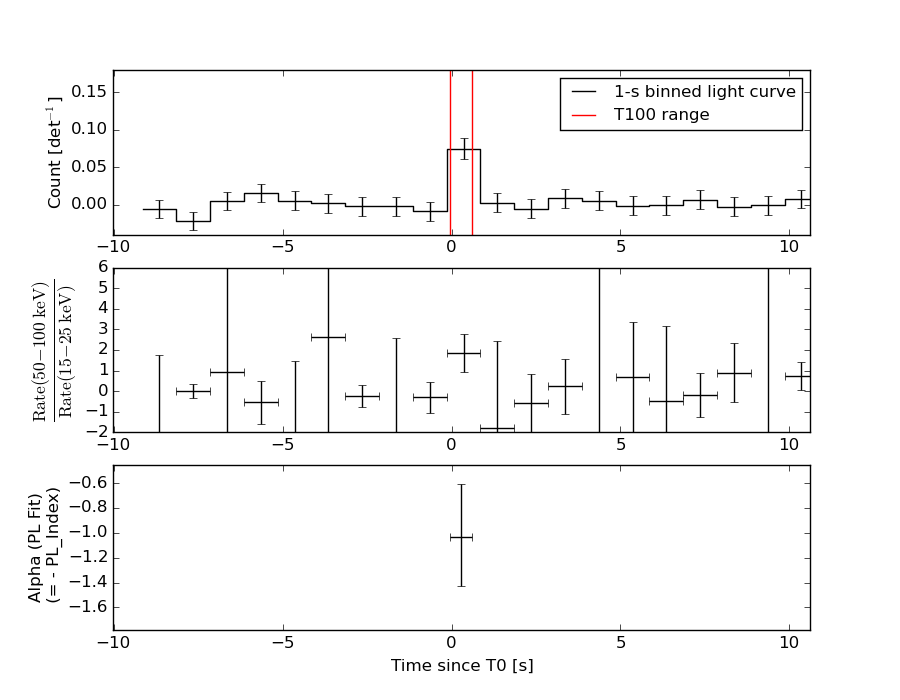
-0.032 0.608 (delta_t = 0.640 [sec])
Background time interval of the image:
-239.144 -0.032 (delta_t = 239.112 [sec])
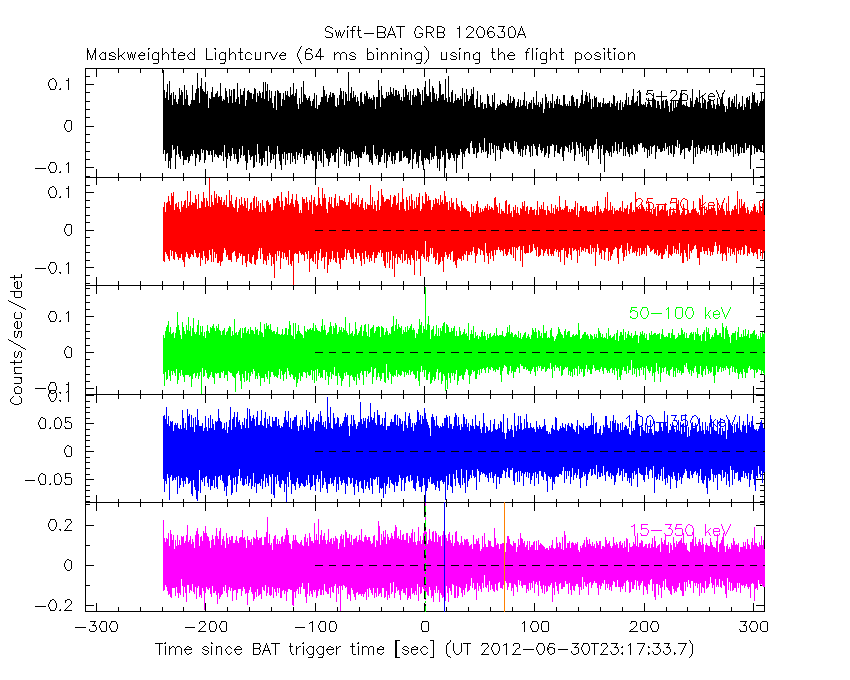
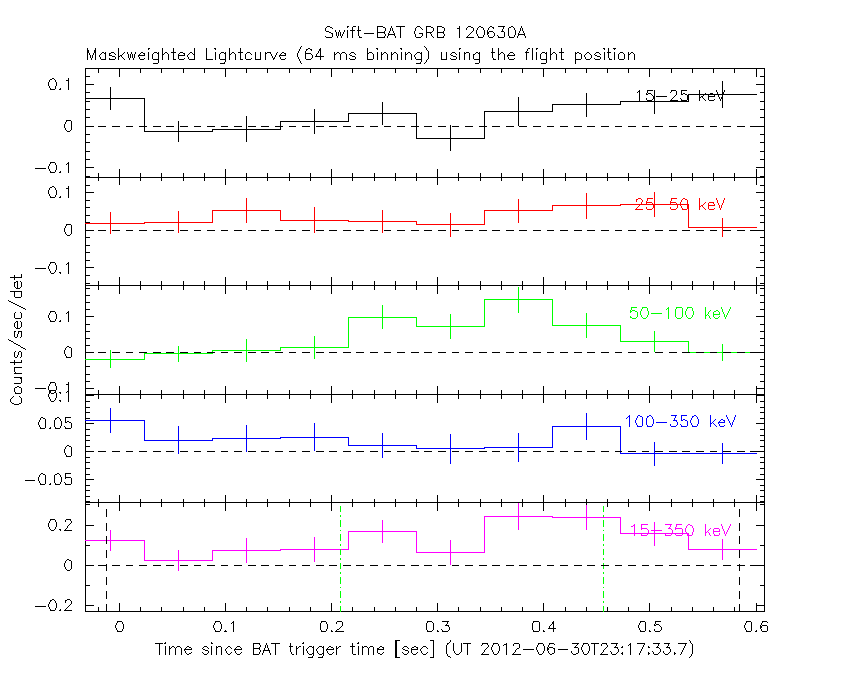
Lightcurves
Notes:
- 1) The mask-weighted light curves are using the flight position.
- 2) Multiple plots of different time binning/intervals are shown to cover all scenarios of short/long GRBs, rate/image triggers, and real/false positives.
- 3) For all the mask-weighted lightcurves, the y-axis units are counts/sec/det where a det is 0.4 x 0.4 = 0.16 sq cm.
- 4) The verticle lines correspond to following: green dotted lines are T50 interval, black dotted lines are T90 interval, blue solid line(s) is a spacecraft slew start time, and orange solid line(s) is a spacecraft slew end time.
- 5) Time of each bin is in the middle of the bin.
1 s binning
From T0-310 s to T0+310 s

From T100_start - 20 s to T100_end + 30 s
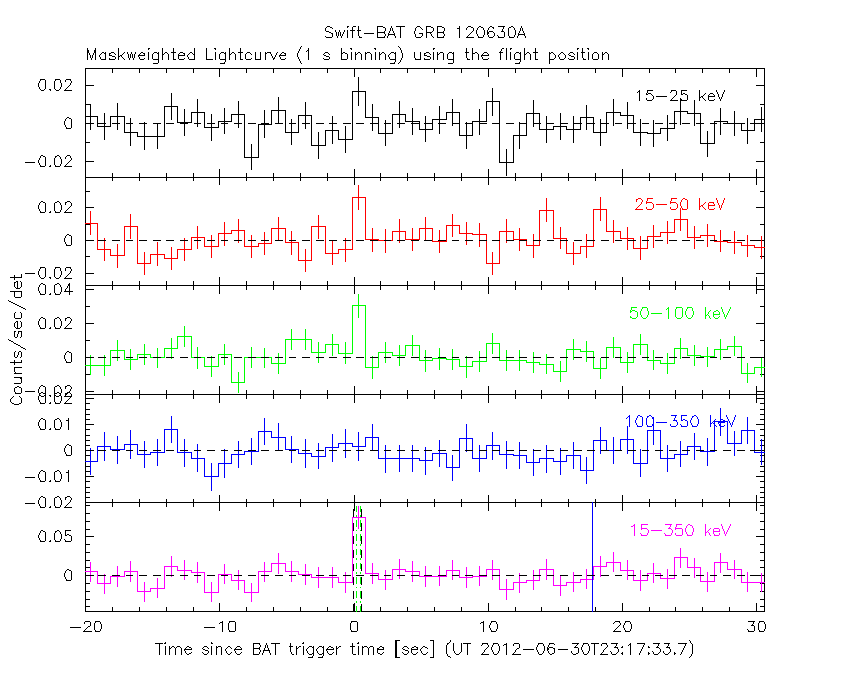
Full time interval

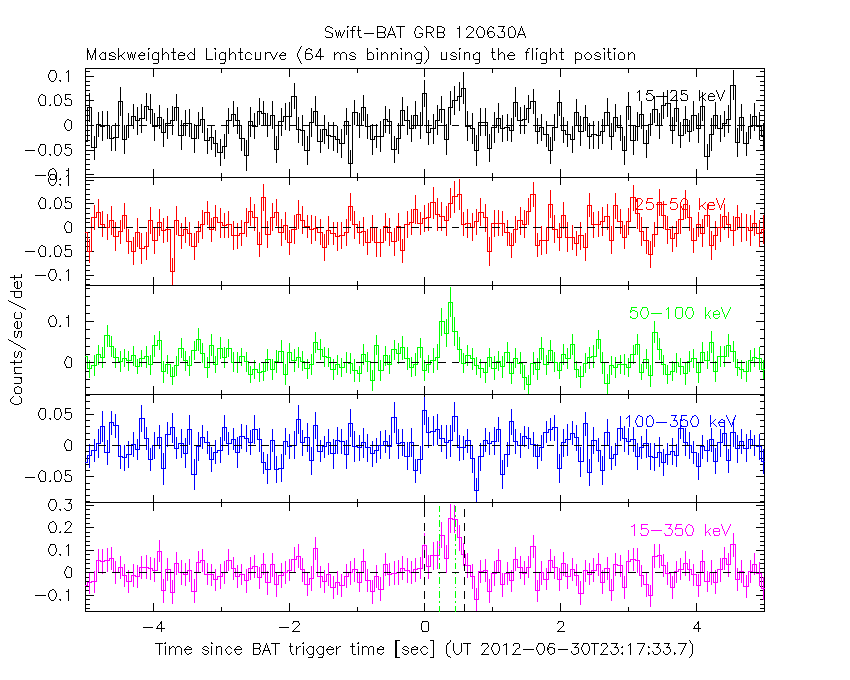
64 ms binning
Full time interval
From T100_start to T100_end
From T0-5 sec to T0+5 sec
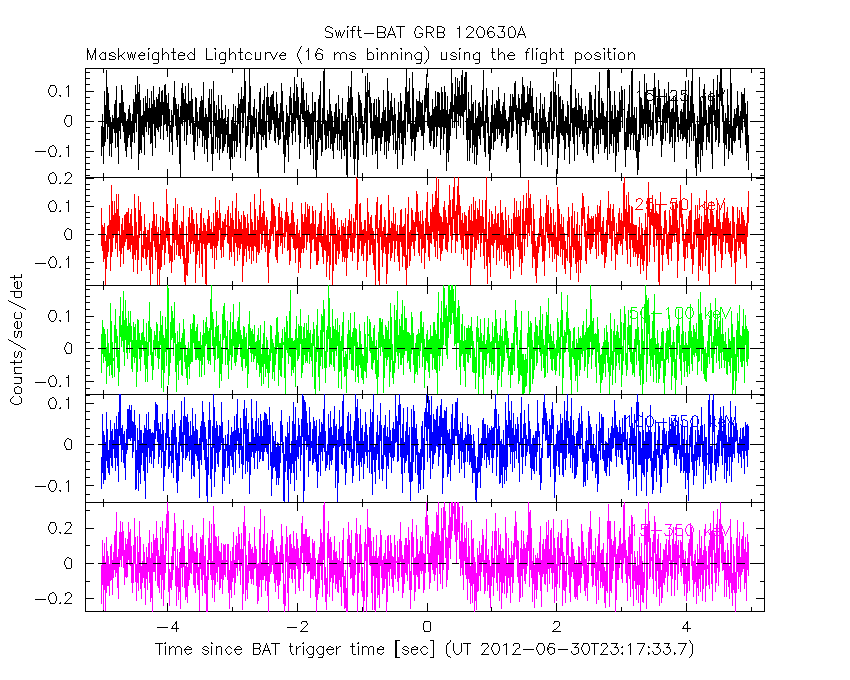
16 ms binning
From T100_start-5 s to T100_start+5 s
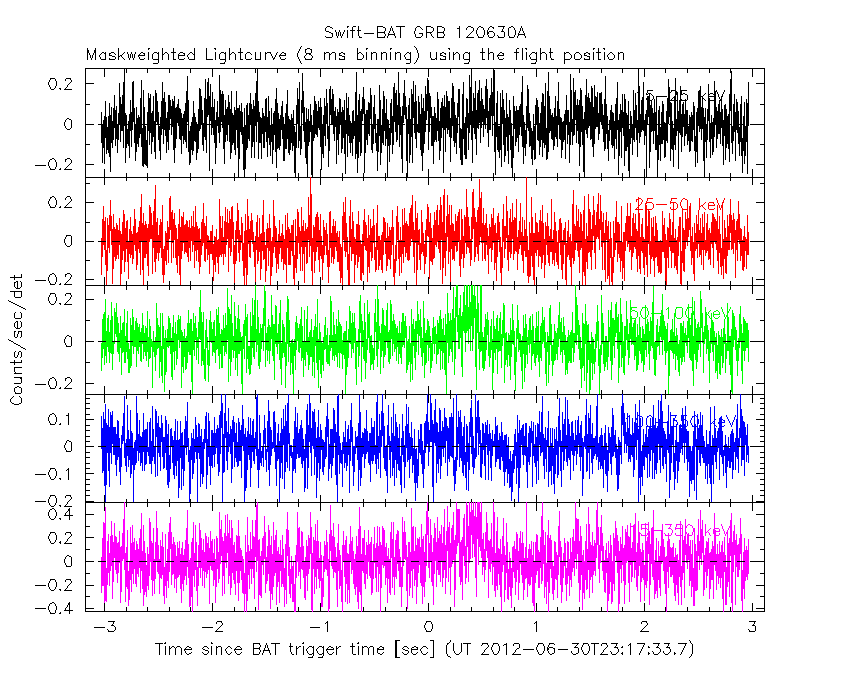
8 ms binning
From T100_start-3 s to T100_start+3 s
2 ms binning
From T100_start-1 s to T100_start+1 s

SN=5 or 10 sec. binning (whichever binning is satisfied first)
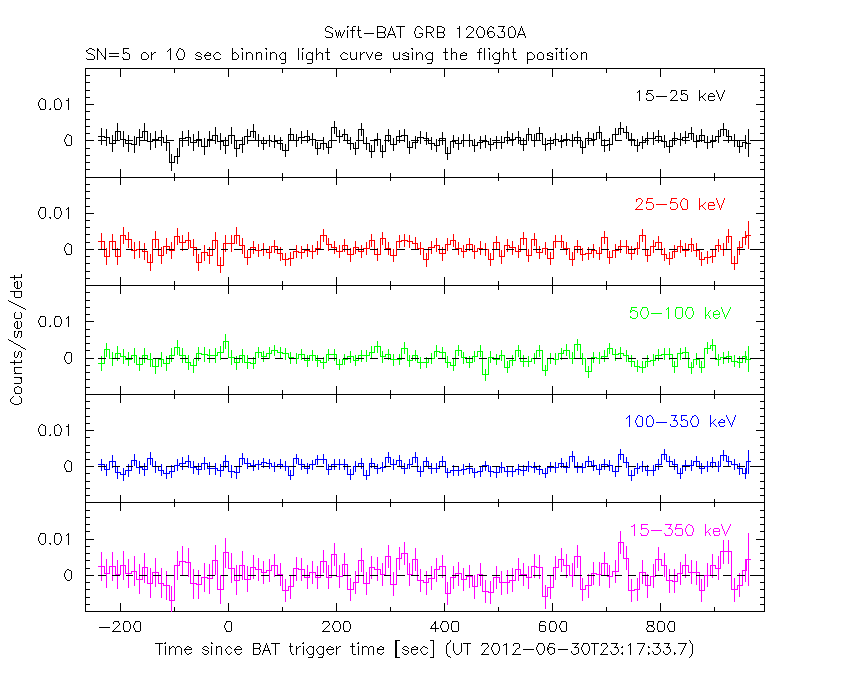
SN=5 or 10 sec. binning (T < 200 sec)

Quad-rate summed light curves (from T0-300s to T0+1000s)

Spectral Evolution
Spectra
Notes:
- 1) The fitting includes the systematic errors.
- 2) When the burst includes telescope slew time periods, the fitting uses an average response file made from multiple 5-s response files through out the slew time plus single time preiod for the non-slew times, and weighted by the total counts in the corresponding time period using addrmf. An average response file is needed becuase a spectral fit using the pre-slew DRM will introduce some errors in both a spectral shape and a normalization if the PHA file contains a lot of the slew/post-slew time interval.
- 3) For fits to more complicated models (e.g. a power-law over a cutoff power-law), the BAT team has decided to require a chi-square improvement of more than 6 for each extra dof.
Time averaged spectrum fit using the average DRM
Power-law model

Time interval is from   -0.032 sec. to    0.608 sec.

Spectral model in power-law:
------------------------------------------------------------
Parameters  : value       lower 90%   higher 90%
Photon index: 1.03003     ( -0.421338   0.394991 )
Norm@50keV  : 8.78548E-03    ( -0.00203013   0.0019696 )
------------------------------------------------------------
#Fit statistic : Chi-Squared =          45.56 using 59 PHA bins.
# Reduced chi-squared =         0.7992 for     57 degrees of freedom
# Null hypothesis probability =   8.620880e-01

Photon flux (15-150 keV)    in 0.64 sec: 1.01326 ( -0.237513  0.238944 ) ph/cm2/s
Energy fluence (15-150 keV)             : 6.01684e-08 ( -1.36124e-08  1.36276e-08 ) ergs/cm2
Cutoff power-law model

Time interval is from   -0.032 sec. to    0.608 sec.
Spectral model in the cutoff power-law:
------------------------------------------------------------
Parameters  : value       lower 90%   higher 90%
Photon index: 1.02374     ( -0.587791   0.398656 )
Epeak [keV] : 9999.35      ( -9999.36 -9999.36 )
Norm@50keV  : 8.83555E-03    ( -0.00202587   0.0131939 )
------------------------------------------------------------
#Fit statistic : Chi-Squared =          45.56 using 59 PHA bins.
# Reduced chi-squared =         0.8137 for     56 degrees of freedom
# Null hypothesis probability =   8.391208e-01

Photon flux (15-150 keV)    in 0.64 sec: 1.01882 ( -0.243576  0.23298 ) ph/cm2/s
Energy fluence (15-150 keV)             : 6.02477e-08 ( -1.36116e-08  1.34918e-08 ) ergs/cm2
Band function

Time interval is from   -0.032 sec. to    0.608 sec.

Spectral model in the Band function:
------------------------------------------------------------
Parameters  : value       lower 90%   higher 90%
alpha       : -0.865581   ( 0.865573   0.865573 )
beta        : -1.03005    ( 1.03002   0.421323 )
Epeak [keV] : 44.2698      ( -44.2629 -44.2629 )
Norm@50keV   : 1.45152E-02    ( -0.00763565   0 )
------------------------------------------------------------
#Fit statistic : Chi-Squared =          45.56 using 59 PHA bins.
# Reduced chi-squared =         0.8283 for     55 degrees of freedom
# Null hypothesis probability =   8.141484e-01

Photon flux (15-150 keV)    in 0.64 sec:  (    ) ph/cm2/s
Energy fluence (15-150 keV)             : 0 ( 0  0 ) ergs/cm2
Single BB

Spectral model blackbody:
------------------------------------------------------------
Parameters  : value    Lower 90%  Upper 90%
kT [keV]    : 29.1969  (-7.94603  13.1616)
R^2/D10^2   : 1.50006E-02  (-0.00989917   0.0247466)
(R is the radius in km and D10 is the distance to the source in units of 10 kpc)
------------------------------------------------------------
#Fit statistic : Chi-Squared =          51.89 using 59 PHA bins.
# Reduced chi-squared =         0.9104 for     57 degrees of freedom
# Null hypothesis probability =   6.665091e-01

Energy  Fluence     90% Error
[keV]   [erg/cm2]   [erg/cm2]
15- 25  1.302e-09   6.037e-10
25- 50  7.939e-09   3.667e-09
50-150  4.829e-08   2.313e-08
15-150  5.753e-08   2.937e-08
Thermal bremsstrahlung (OTTB)

Spectral model: thermal bremsstrahlung
------------------------------------------------------------
Parameters  : value         Lower 90%    Upper 90%
kT [keV]    : 200.000       (      )
Norm        : 4.26953       (-0.972087     0.97196)
------------------------------------------------------------
#Fit statistic : Chi-Squared =          51.38 using 59 PHA bins.
# Reduced chi-squared =         0.9013 for     57 degrees of freedom
# Null hypothesis probability =   6.851317e-01

Energy  Fluence     90% Error
[keV]   [erg/cm2]   [erg/cm2]
15- 25  6.804e-09   4.064e-09
25- 50  1.309e-08   7.763e-09
50-150  2.871e-08   1.700e-08
15-150  4.860e-08   2.836e-08
Double BB

Spectral model: bbodyrad<1> + bbodyrad<2>
------------------------------------------------------------
Parameters  : value         Lower 90%    Upper 90%
kT1 [keV]   : 6.06845        (-2.64799      4.00653)
R1^2/D10^2  : 1.67332        (-1.43911      6.7472)
kT2 [keV]   : 40.1797        (-13.2297      43.6442)
R2^2/D10^2  : 5.34221E-03    (-0.00442193   0.0121536)
------------------------------------------------------------
#Fit statistic : Chi-Squared =          43.05 using 59 PHA bins.
# Reduced chi-squared =         0.7828 for     55 degrees of freedom
# Null hypothesis probability =   8.787708e-01

Energy  Fluence     90% Error
[keV]   [erg/cm2]   [erg/cm2]
15- 25  6.035e-09   3.728e-09
25- 50  1.029e-08   5.770e-09
50-150  4.713e-08   2.741e-08
15-150  6.345e-08   3.270e-08
Peak spectrum fit
Power-law model

Time interval is from   -0.212 sec. to    0.788 sec.

Spectral model in power-law:
------------------------------------------------------------
Parameters  : value       lower 90%   higher 90%
Photon index: 0.960109     ( -0.54844   0.487181 )
Norm@50keV  : 5.31465E-03    ( -0.0015915   0.00152664 )
------------------------------------------------------------
#Fit statistic : Chi-Squared =          47.48 using 59 PHA bins.
# Reduced chi-squared =         0.8330 for     57 degrees of freedom
# Null hypothesis probability =   8.114182e-01

Photon flux (15-150 keV)    in 1 sec: 0.610819 ( -0.1797  0.182376 ) ph/cm2/s
Energy fluence (15-150 keV)             : 5.83053e-08 ( -1.65889e-08  1.67168e-08 ) ergs/cm2
Cutoff power-law model

Time interval is from   -0.212 sec. to    0.788 sec.
Spectral model in the cutoff power-law:
------------------------------------------------------------
Parameters  : value       lower 90%   higher 90%
Photon index: 2.75003     (     )
Epeak [keV] : 212.133      (   )
Norm@50keV  : 1.79923E-04    (     )
------------------------------------------------------------
#Fit statistic : Chi-Squared =          47.23 using 59 PHA bins.
# Reduced chi-squared =         0.8434 for     56 degrees of freedom
# Null hypothesis probability =   7.916497e-01

Photon flux (15-150 keV)    in 1 sec: 0.607503 ( -0.093821  0.184113 ) ph/cm2/s
Energy fluence (15-150 keV)             : 5.81926e-08 ( -8.4784e-09  1.65521e-08 ) ergs/cm2
Band function

Time interval is from   -0.212 sec. to    0.788 sec.

Spectral model in the Band function:
------------------------------------------------------------
Parameters  : value       lower 90%   higher 90%
alpha       : -0.714460   ( -0.718733   1.5472 )
beta        : 10.0000    ( -10   -10 )
Epeak [keV] : 324.087      ( -324.087 -324.087 )
Norm@50keV   : 1.85856E-21    ( -5.32005e-22   7.95726e-15 )
------------------------------------------------------------
#Fit statistic : Chi-Squared =          47.27 using 59 PHA bins.
# Reduced chi-squared =         0.8595 for     55 degrees of freedom
# Null hypothesis probability =   7.612233e-01

Photon flux (15-150 keV)    in 1 sec:  (    ) ph/cm2/s
Energy fluence (15-150 keV)             : 0 ( 0  0 ) ergs/cm2
Single BB

Spectral model blackbody:
------------------------------------------------------------
Parameters  : value    Lower 90%  Upper 90%
kT [keV]    : 28.8165  (-9.45792  17.9165)
R^2/D10^2   : 9.60833E-03  (-0.00960675   0.0228686)
(R is the radius in km and D10 is the distance to the source in units of 10 kpc)
------------------------------------------------------------
#Fit statistic : Chi-Squared =          50.14 using 59 PHA bins.
# Reduced chi-squared =         0.8797 for     57 degrees of freedom
# Null hypothesis probability =   7.279633e-01

Energy  Fluence     90% Error
[keV]   [erg/cm2]   [erg/cm2]
15- 25  1.279e-09   8.165e-10
25- 50  7.758e-09   4.713e-09
50-150  4.617e-08   2.807e-08
15-150  5.521e-08   3.298e-08
Thermal bremsstrahlung (OTTB)

Spectral model: thermal bremsstrahlung
------------------------------------------------------------
Parameters  : value         Lower 90%    Upper 90%
kT [keV]    : 200.000       (      )
Norm        : 2.58221       (-0.750146     0.750046)
------------------------------------------------------------
#Fit statistic : Chi-Squared =          51.66 using 59 PHA bins.
# Reduced chi-squared =         0.9063 for     57 degrees of freedom
# Null hypothesis probability =   6.750508e-01

Energy  Fluence     90% Error
[keV]   [erg/cm2]   [erg/cm2]
15- 25  6.430e-09   4.014e-09
25- 50  1.237e-08   7.600e-09
50-150  2.713e-08   1.686e-08
15-150  4.593e-08   2.787e-08
Double BB

Spectral model: bbodyrad<1> + bbodyrad<2>
------------------------------------------------------------
Parameters  : value         Lower 90%    Upper 90%
kT1 [keV]   : 7.27206        (-3.11602      5.37387)
R1^2/D10^2  : 0.495787        (-0.442225      2.79124)
kT2 [keV]   : 41.2382        (-19.7743      102.581)
R2^2/D10^2  : 3.00678E-03    (-0.00262325   0.00954707)
------------------------------------------------------------
#Fit statistic : Chi-Squared =          45.29 using 59 PHA bins.
# Reduced chi-squared =         0.8235 for     55 degrees of freedom
# Null hypothesis probability =   8.217300e-01

Energy  Fluence     90% Error
[keV]   [erg/cm2]   [erg/cm2]
15- 25  5.020e-09   3.188e-09
25- 50  1.088e-08   6.255e-09
50-150  4.528e-08   2.625e-08
15-150  6.118e-08   3.167e-08
Pre-slew spectrum (Pre-slew PHA with pre-slew DRM)
Power-law model

Spectral model in power-law:
------------------------------------------------------------
Parameters  : value       lower 90%   higher 90%
Photon index: 1.03003     ( -0.421338   0.394991 )
Norm@50keV  : 8.78548E-03    ( -0.00203013   0.0019696 )
------------------------------------------------------------
#Fit statistic : Chi-Squared =          45.56 using 59 PHA bins.
# Reduced chi-squared =         0.7992 for     57 degrees of freedom
# Null hypothesis probability =   8.620880e-01

Photon flux (15-150 keV)    in 0.64 sec: 1.01326 ( -0.237513  0.238944 ) ph/cm2/s
Energy fluence (15-150 keV)             : 6.01684e-08 ( -1.36124e-08  1.36276e-08 ) ergs/cm2
Cutoff power-law model

Spectral model in the cutoff power-law:
------------------------------------------------------------
Parameters  : value       lower 90%   higher 90%
Photon index: 1.02374     ( -0.5878   0.398644 )
Epeak [keV] : 9999.35      ( -9999.36 -9999.36 )
Norm@50keV  : 8.83555E-03    ( -0.00202587   0.0131939 )
------------------------------------------------------------
#Fit statistic : Chi-Squared =          45.56 using 59 PHA bins.
# Reduced chi-squared =         0.8137 for     56 degrees of freedom
# Null hypothesis probability =   8.391208e-01

Photon flux (15-150 keV)    in 0.64 sec: 1.01882 ( -0.243576  0.23298 ) ph/cm2/s
Energy fluence (15-150 keV)             : 6.02477e-08 ( -1.36116e-08  1.34918e-08 ) ergs/cm2
Band function

Spectral model in the Band function:
------------------------------------------------------------
Parameters  : value       lower 90%   higher 90%
alpha       : -0.865581   ( 0.865573   0.865573 )
beta        : -1.03005    ( 1.03002   0.421323 )
Epeak [keV] : 44.2698      ( -44.2629 -44.2629 )
Norm@50keV   : 1.45152E-02    ( -0.00763565   0 )
------------------------------------------------------------
#Fit statistic : Chi-Squared =          45.56 using 59 PHA bins.
# Reduced chi-squared =         0.8283 for     55 degrees of freedom
# Null hypothesis probability =   8.141484e-01

Photon flux (15-150 keV)    in 0.64 sec:  (    ) ph/cm2/s
Energy fluence (15-150 keV)             : 0 ( 0  0 ) ergs/cm2
S(25-50 keV) vs. S(50-100 keV) plot
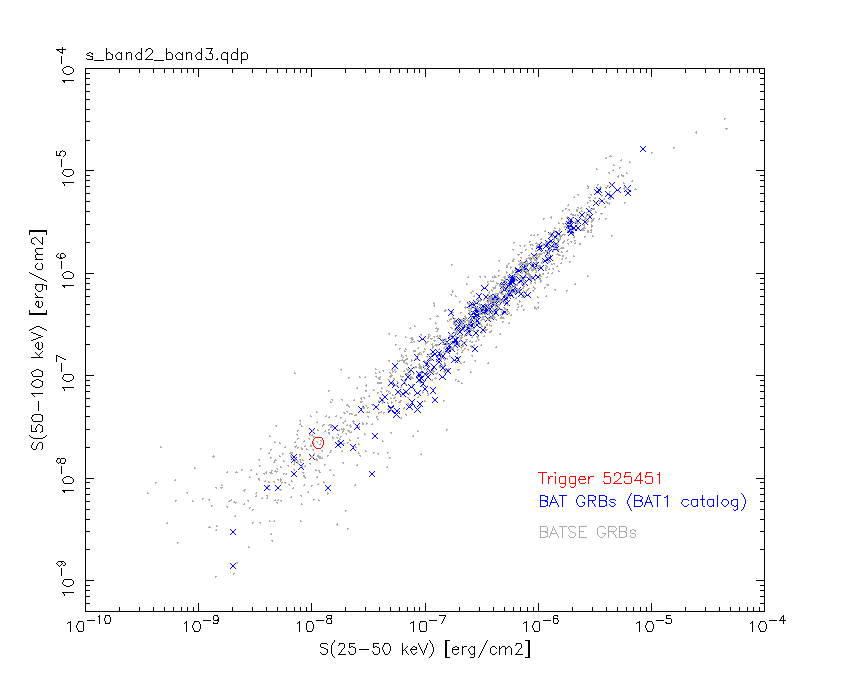
S(25-50 keV)  = 1.14e-08
S(50-100 keV) = 2.23e-08
T90 vs. Hardness ratio plot
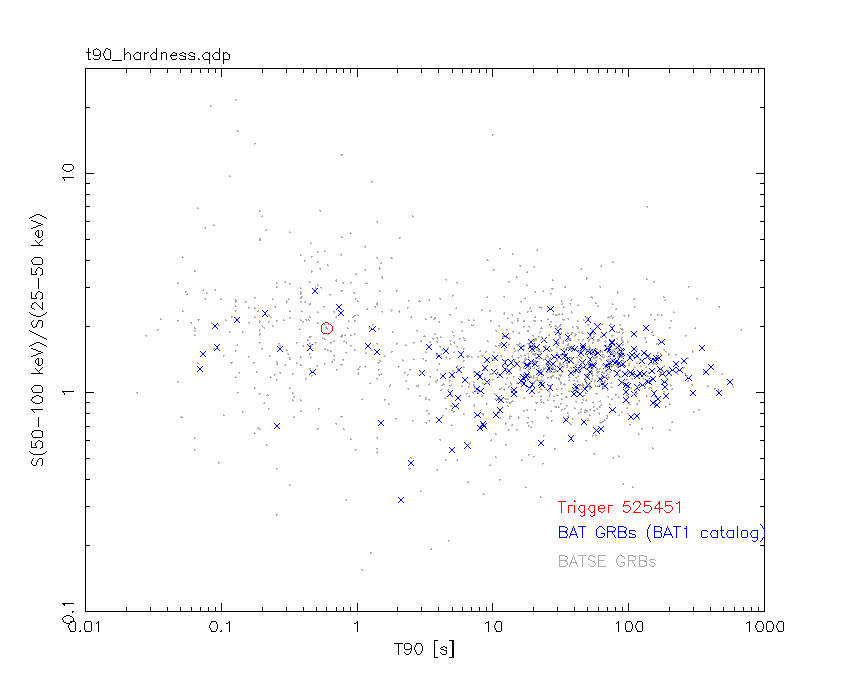
T90                                   = 0.595999896526337 sec.
Hardness ratio (energy fluence ratio) = 1.95614
Color vs. Color plot

Count Ratio  (25-50 keV) / (15-25 keV) = 1.18326
Count Ratio (50-100 keV) / (15-25 keV) = 1.40746
Mask shadow pattern

IMX = 5.807817109795863E-01, IMY = 3.411954567137049E-01
TIME vs. PHA plot around the trigger time

TIME vs. DetID plot around the trigger time
100 us light curve (15-350 keV)

Spacecraft aspect plot

Bright source in the pre-burst/pre-slew/post-slew images
Pre-burst image of 15-350 keV band
Time interval of the image:
-239.144000 -0.032000

# RAcent  DECcent POSerr Theta    Phi  PeakCts   SNR AngSep     Name
#  [deg]    [deg]    ['] [deg]  [deg]                   [']
254.4354  35.3268    6.4  39.4  169.5   0.5167   1.8    1.4	Her X-1
288.8342  10.9480    1.6  35.8  102.2   3.2226   7.1    2.1	GRS 1915+105
299.6738  35.2085    2.3   9.6  101.9   0.9232   5.0    4.1	Cyg X-1
308.1110  40.9859    2.0   3.6   35.3   1.0183   5.7    2.0	Cyg X-3
326.1696  38.3214    6.3  16.7   -3.9   0.3349   1.8    0.1	Cyg X-2
351.3533  24.0645    2.6  42.4   -3.6   1.3399   4.4 ------	UNKNOWN
236.0637  72.1149    2.9  42.4 -131.0   1.7112   4.0 ------	UNKNOWN
Pre-slew background subtracted image of 15-350 keV band
Time interval of the image:
-0.032000 0.608000

# RAcent  DECcent POSerr Theta    Phi  PeakCts   SNR AngSep     Name
#  [deg]    [deg]    ['] [deg]  [deg]                   [']
254.6365  35.3774    4.0  39.2  169.4   0.0375   2.9    9.0	Her X-1
288.6826  11.0559   12.5  35.7  102.5   0.0193   0.9    9.5	GRS 1915+105
299.7789  35.2139    4.9   9.5  101.5  -0.0198  -2.3    9.3	Cyg X-1
308.2214  40.7681    5.5   3.8   36.2   0.0170   2.1   12.2	Cyg X-3
326.2918  38.4331    8.5  16.8   -4.4   0.0114   1.4    8.8	Cyg X-2
  6.8137  18.3063    2.1  57.2  -10.1   0.2241   5.7 ------	UNKNOWN
352.3048  42.4939    1.6  34.0  -30.4   0.0857   7.4 ------	UNKNOWN
  2.1781  53.9664    2.3  37.7  -52.1   0.0784   4.9 ------	UNKNOWN
Post-slew image of 15-350 keV band
Time interval of the image:
72.556610 962.906500

# RAcent  DECcent POSerr Theta    Phi  PeakCts   SNR AngSep     Name
#  [deg]    [deg]    ['] [deg]  [deg]                   [']
299.5903  35.2016   25.1  41.0  127.0   0.7656   0.5    0.0	Cyg X-1
308.0663  40.9291    2.4  32.7  131.6   4.3147   4.9    2.4	Cyg X-3
325.9772  38.3657    4.7  20.4  116.2   1.3435   2.5    9.5	Cyg X-2
314.0453  26.6441    3.4  34.9  104.5   3.9118   3.4 ------	UNKNOWN
217.8670  79.0579    2.9  55.6 -160.4   7.2019   4.0 ------	UNKNOWN
205.5908  76.9222    4.9  58.8 -159.3  11.2292   2.4 ------	UNKNOWN
198.2196  78.6186    4.9  57.9 -156.8   8.8406   2.4 ------	UNKNOWN
119.7717  81.1718    3.2  53.2 -142.2  11.0816   3.6 ------	UNKNOWN
 43.9474  22.7757    2.9  46.9  -53.0  11.4080   3.9 ------	UNKNOWN
 54.3878  55.0924    3.1  41.3 -100.9  11.9363   3.8 ------	UNKNOWN
Plot creation:
Sat May 30 19:21:27 EDT 2015