Click here for the BAT GCN circular template
Image
Pre-slew 15.0-350.0 keV image (Event data)

#   RAcent    DECcent   POSerr    Theta     Phi              Peak Cts       SNR   Name
   80.3347   -58.5319   0.0085    32.7365   162.1812         1.2691040     22.623 TRIG_00525477

Foreground time interval of the image:
 -0.016  10.757 (delta_t =  10.773 [sec])
Background time interval of the image:
-182.243  -0.016 (delta_t = 182.227 [sec])
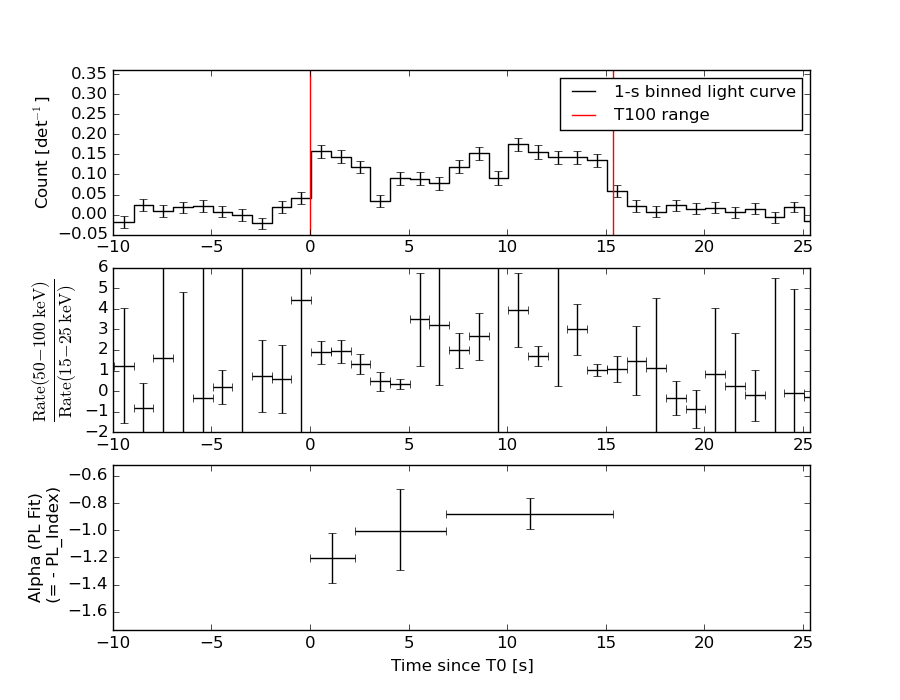
Lightcurves
Notes:
- 1) The mask-weighted light curves are using the flight position.
- 2) Multiple plots of different time binning/intervals are shown to cover all scenarios of short/long GRBs, rate/image triggers, and real/false positives.
- 3) For all the mask-weighted lightcurves, the y-axis units are counts/sec/det where a det is 0.4 x 0.4 = 0.16 sq cm.
- 4) The verticle lines correspond to following: green dotted lines are T50 interval, black dotted lines are T90 interval, blue solid line(s) is a spacecraft slew start time, and orange solid line(s) is a spacecraft slew end time.
- 5) Time of each bin is in the middle of the bin.
1 s binning
From T0-310 s to T0+310 s
From T100_start - 20 s to T100_end + 30 s
Full time interval

64 ms binning
Full time interval
From T100_start to T100_end
From T0-5 sec to T0+5 sec
16 ms binning
From T100_start-5 s to T100_start+5 s
8 ms binning
From T100_start-3 s to T100_start+3 s
2 ms binning
From T100_start-1 s to T100_start+1 s

SN=5 or 10 sec. binning (whichever binning is satisfied first)
SN=5 or 10 sec. binning (T < 200 sec)
Quad-rate summed light curves (from T0-300s to T0+1000s)

Spectral Evolution
Spectra
Notes:
- 1) The fitting includes the systematic errors.
- 2) When the burst includes telescope slew time periods, the fitting uses an average response file made from multiple 5-s response files through out the slew time plus single time preiod for the non-slew times, and weighted by the total counts in the corresponding time period using addrmf. An average response file is needed becuase a spectral fit using the pre-slew DRM will introduce some errors in both a spectral shape and a normalization if the PHA file contains a lot of the slew/post-slew time interval.
- 3) For fits to more complicated models (e.g. a power-law over a cutoff power-law), the BAT team has decided to require a chi-square improvement of more than 6 for each extra dof.
Time averaged spectrum fit using the average DRM
Power-law model

Time interval is from   -0.016 sec. to   15.356 sec.

Spectral model in power-law:
------------------------------------------------------------
Parameters  : value       lower 90%   higher 90%
Photon index: 0.967414     ( -0.0988848   0.0970661 )
Norm@50keV  : 8.59557E-03    ( -0.000464721   0.000462709 )
------------------------------------------------------------
#Fit statistic : Chi-Squared =          59.21 using 59 PHA bins.
# Reduced chi-squared =          1.039 for     57 degrees of freedom
# Null hypothesis probability =   3.948076e-01

Photon flux (15-150 keV)    in 15.37 sec: 0.988136 ( -0.054345  0.0545271 ) ph/cm2/s
Energy fluence (15-150 keV)             : 1.44546e-06 ( -8.0947e-08  8.12146e-08 ) ergs/cm2
Cutoff power-law model

Time interval is from   -0.016 sec. to   15.356 sec.
Spectral model in the cutoff power-law:
------------------------------------------------------------
Parameters  : value       lower 90%   higher 90%
Photon index: 0.961218     ( -0.381114   0.104866 )
Epeak [keV] : 9999.99      (   )
Norm@50keV  : 8.64846E-03    ( -0.000465783   0.000448959 )
------------------------------------------------------------
#Fit statistic : Chi-Squared =          59.21 using 59 PHA bins.
# Reduced chi-squared =          1.057 for     56 degrees of freedom
# Null hypothesis probability =   3.593677e-01

Photon flux (15-150 keV)    in 15.37 sec: 0.987816 ( -0.057659  0.054424 ) ph/cm2/s
Energy fluence (15-150 keV)             : 1.4424e-06 ( -8.24908e-08  8.51098e-08 ) ergs/cm2
Band function

Time interval is from   -0.016 sec. to   15.356 sec.

Spectral model in the Band function:
------------------------------------------------------------
Parameters  : value       lower 90%   higher 90%
alpha       : -0.798586   ( 0.798586   0.798586 )
beta        : -0.967414    ( -0.0970474   0.098915 )
Epeak [keV] : 54.8060      ( -54.8057 -54.8057 )
Norm@50keV   : 1.39557E-02    ( -0.00502496   0 )
------------------------------------------------------------
#Fit statistic : Chi-Squared =          59.21 using 59 PHA bins.
# Reduced chi-squared =          1.077 for     55 degrees of freedom
# Null hypothesis probability =   3.245647e-01

Photon flux (15-150 keV)    in 15.37 sec:  (    ) ph/cm2/s
Energy fluence (15-150 keV)             : 0 ( 0  0 ) ergs/cm2
Single BB
Spectral model blackbody:
------------------------------------------------------------
Parameters  : value    Lower 90%  Upper 90%
kT [keV]    : 23.9721  (  )
R^2/D10^2   : 2.67776E-02  (   )
(R is the radius in km and D10 is the distance to the source in units of 10 kpc)
------------------------------------------------------------
#Fit statistic : Chi-Squared =         124.40 using 59 PHA bins.
# Reduced chi-squared =         2.1824 for     57 degrees of freedom
# Null hypothesis probability =   6.342267e-07

Energy  Fluence     90% Error
[keV]   [erg/cm2]   [erg/cm2]
15- 25  4.199e-08   4.588e-09
25- 50  2.331e-07   1.898e-08
50-150  9.979e-07   7.662e-08
15-150  1.273e-06   8.815e-08
Thermal bremsstrahlung (OTTB)

Spectral model: thermal bremsstrahlung
------------------------------------------------------------
Parameters  : value         Lower 90%    Upper 90%
kT [keV]    : 199.363       (      )
Norm        : 4.10994       (     )
------------------------------------------------------------
#Fit statistic : Chi-Squared =         162.02 using 59 PHA bins.
# Reduced chi-squared =         2.8424 for     57 degrees of freedom
# Null hypothesis probability =   5.256252e-12

Energy  Fluence     90% Error
[keV]   [erg/cm2]   [erg/cm2]
15- 25  1.573e-07   9.230e-09
25- 50  3.026e-07   1.914e-08
50-150  6.636e-07   1.309e-07
15-150  1.124e-06   1.553e-07
Double BB

Spectral model: bbodyrad<1> + bbodyrad<2>
------------------------------------------------------------
Parameters  : value         Lower 90%    Upper 90%
kT1 [keV]   : 8.70803        (-1.64954      1.93538)
R1^2/D10^2  : 0.361117        (-0.163628      0.347665)
kT2 [keV]   : 39.9020        (-6.9889      12.8112)
R2^2/D10^2  : 5.07056E-03    (-0.00271864   0.00398826)
------------------------------------------------------------
#Fit statistic : Chi-Squared =          56.90 using 59 PHA bins.
# Reduced chi-squared =          1.034 for     55 degrees of freedom
# Null hypothesis probability =   4.042930e-01

Energy  Fluence     90% Error
[keV]   [erg/cm2]   [erg/cm2]
15- 25  9.652e-08   2.252e-08
25- 50  2.717e-07   5.226e-08
50-150  1.098e-06   2.535e-07
15-150  1.466e-06   3.531e-07
Peak spectrum fit
Power-law model

Time interval is from   10.360 sec. to   11.360 sec.

Spectral model in power-law:
------------------------------------------------------------
Parameters  : value       lower 90%   higher 90%
Photon index: 0.704711     ( -0.249203   0.233166 )
Norm@50keV  : 1.35412E-02    ( -0.00195647   0.00190596 )
------------------------------------------------------------
#Fit statistic : Chi-Squared =          59.37 using 59 PHA bins.
# Reduced chi-squared =          1.042 for     57 degrees of freedom
# Null hypothesis probability =   3.891701e-01

Photon flux (15-150 keV)    in 1 sec: 1.56466 ( -0.210452  0.211616 ) ph/cm2/s
Energy fluence (15-150 keV)             : 1.64937e-07 ( -2.19988e-08  2.20699e-08 ) ergs/cm2
Cutoff power-law model
Time interval is from   10.360 sec. to   11.360 sec.
Spectral model in the cutoff power-law:
------------------------------------------------------------
Parameters  : value       lower 90%   higher 90%
Photon index: 0.468632     ( -0.97094   0.444882 )
Epeak [keV] : 415.612      ( -415.612 -415.612 )
Norm@50keV  : 1.67834E-02    ( -0.004564   0.0271935 )
------------------------------------------------------------
#Fit statistic : Chi-Squared =          59.19 using 59 PHA bins.
# Reduced chi-squared =          1.057 for     56 degrees of freedom
# Null hypothesis probability =   3.598718e-01

Photon flux (15-150 keV)    in 1 sec: 1.55097 ( -0.2168  0.21787 ) ph/cm2/s
Energy fluence (15-150 keV)             : 1.64142e-07 ( -2.2705e-08  2.244e-08 ) ergs/cm2
Band function
Time interval is from   10.360 sec. to   11.360 sec.

Spectral model in the Band function:
------------------------------------------------------------
Parameters  : value       lower 90%   higher 90%
alpha       : -0.944551   ( 0.944551   0.944551 )
beta        : -0.704686    ( -0.233194   0.249123 )
Epeak [keV] : 12.9970      ( -12.997 -12.997 )
Norm@50keV   : 2.01786E-02    ( -0.00855339   0 )
------------------------------------------------------------
#Fit statistic : Chi-Squared =          59.37 using 59 PHA bins.
# Reduced chi-squared =          1.080 for     55 degrees of freedom
# Null hypothesis probability =   3.193352e-01

Photon flux (15-150 keV)    in 1 sec:  (    ) ph/cm2/s
Energy fluence (15-150 keV)             : 0 ( 0  0 ) ergs/cm2
Single BB

Spectral model blackbody:
------------------------------------------------------------
Parameters  : value    Lower 90%  Upper 90%
kT [keV]    : 28.4316  (-4.97708  7.01074)
R^2/D10^2   : 2.79017E-02  (-0.0129404   0.0214071)
(R is the radius in km and D10 is the distance to the source in units of 10 kpc)
------------------------------------------------------------
#Fit statistic : Chi-Squared =          65.22 using 59 PHA bins.
# Reduced chi-squared =          1.144 for     57 degrees of freedom
# Null hypothesis probability =   2.125358e-01

Energy  Fluence     90% Error
[keV]   [erg/cm2]   [erg/cm2]
15- 25  3.645e-09   1.097e-09
25- 50  2.198e-08   5.585e-09
50-150  1.279e-07   2.889e-08
15-150  1.535e-07   3.180e-08
Thermal bremsstrahlung (OTTB)

Spectral model: thermal bremsstrahlung
------------------------------------------------------------
Parameters  : value         Lower 90%    Upper 90%
kT [keV]    : 200.000       (      )
Norm        : 6.20220       (-0.883784     0.883739)
------------------------------------------------------------
#Fit statistic : Chi-Squared =          94.69 using 59 PHA bins.
# Reduced chi-squared =          1.661 for     57 degrees of freedom
# Null hypothesis probability =   1.266863e-03

Energy  Fluence     90% Error
[keV]   [erg/cm2]   [erg/cm2]
15- 25  1.544e-08   8.870e-09
25- 50  2.969e-08   1.667e-08
50-150  6.512e-08   3.687e-08
15-150  1.102e-07   6.280e-08
Double BB

------------------------------------------------------------
Parameters  : value         Lower 90%    Upper 90%
kT1 [keV]   : 13.4721        (      )
R1^2/D10^2  : 0.137538        (-0.0842979      1.08208)
kT2 [keV]   : 59.7699        (-58.7443      -61.3591)
R2^2/D10^2  : 2.99590E-03    (-0.00225448   0.0203011)
------------------------------------------------------------
#Fit statistic : Chi-Squared =          61.40 using 59 PHA bins.
#Fit statistic : Chi-Squared =          58.79 using 59 PHA bins.
# Reduced chi-squared =          1.116 for     55 degrees of freedom
# Reduced chi-squared =          1.069 for     55 degrees of freedom
# Null hypothesis probability =   2.573690e-01
# Null hypothesis probability =   3.384312e-01

Energy  Fluence     90% Error
[keV]   [erg/cm2]   [erg/cm2]
15- 25  8.333e-09   3.911e-09
25- 50  2.069e-08   6.015e-09
50-150  1.310e-07   3.403e-08
15-150  1.600e-07   4.010e-08
Pre-slew spectrum (Pre-slew PHA with pre-slew DRM)
Power-law model
Spectral model in power-law:
------------------------------------------------------------
Parameters  : value       lower 90%   higher 90%
Photon index: 0.947936     ( -0.133358   0.12957 )
Norm@50keV  : 7.55694E-03    ( -0.000542205   0.000538666 )
------------------------------------------------------------
#Fit statistic : Chi-Squared =          63.64 using 59 PHA bins.
# Reduced chi-squared =          1.117 for     57 degrees of freedom
# Null hypothesis probability =   2.542296e-01

Photon flux (15-150 keV)    in 10.77 sec: 0.868165 ( -0.062909  0.063211 ) ph/cm2/s
Energy fluence (15-150 keV)             : 8.96909e-07 ( -6.68906e-08  6.69973e-08 ) ergs/cm2
Cutoff power-law model
Spectral model in the cutoff power-law:
------------------------------------------------------------
Parameters  : value       lower 90%   higher 90%
Photon index: 0.941806     ( -0.26962   0.191145 )
Epeak [keV] : 9999.24      (   )
Norm@50keV  : 7.60401E-03    ( -0.000535665   0.00241624 )
------------------------------------------------------------
#Fit statistic : Chi-Squared =          63.68 using 59 PHA bins.
# Reduced chi-squared =          1.137 for     56 degrees of freedom
# Null hypothesis probability =   2.244313e-01

Photon flux (15-150 keV)    in 10.77 sec: 0.867405 ( -0.062121  0.063556 ) ph/cm2/s
Energy fluence (15-150 keV)             : 8.9599e-07 ( -6.55301e-08  6.82463e-08 ) ergs/cm2
Band function

Spectral model in the Band function:
------------------------------------------------------------
Parameters  : value       lower 90%   higher 90%
alpha       : 4.99998   ( -4.99998   -4.99998 )
beta        : -1.00178    ( -0.146862   0.145406 )
Epeak [keV] : 28.1842      ( -28.1842 5.27602 )
Norm@50keV   : 245.126    ( -16.8204   1.13549e+06 )
------------------------------------------------------------
#Fit statistic : Chi-Squared =          62.37 using 59 PHA bins.
# Reduced chi-squared =          1.134 for     55 degrees of freedom
# Null hypothesis probability =   2.306559e-01

Photon flux (15-150 keV)    in 10.77 sec:  (    ) ph/cm2/s
Energy fluence (15-150 keV)             : 0 ( 0  0 ) ergs/cm2
S(25-50 keV) vs. S(50-100 keV) plot
S(25-50 keV)  = 2.62e-07
S(50-100 keV) = 5.36e-07
T90 vs. Hardness ratio plot
T90                                   = 14.1599999666214 sec.
Hardness ratio (energy fluence ratio) = 2.0458
Color vs. Color plot
Count Ratio  (25-50 keV) / (15-25 keV) = 1.83547
Count Ratio (50-100 keV) / (15-25 keV) = 2.06055
Mask shadow pattern
IMX = -6.120485563868362E-01, IMY = -1.967291612168200E-01
TIME vs. PHA plot around the trigger time
TIME vs. DetID plot around the trigger time
100 us light curve (15-350 keV)

Spacecraft aspect plot
Bright source in the pre-burst/pre-slew/post-slew images
Pre-burst image of 15-350 keV band
Time interval of the image:
-182.243400 -0.016000

# RAcent  DECcent POSerr Theta    Phi  PeakCts   SNR AngSep     Name
#  [deg]    [deg]    ['] [deg]  [deg]                   [']
135.4685 -40.5334    1.7   5.9  -23.1   1.1935   6.8    3.0	Vela X-1
170.1113 -60.6051    2.0  28.0   72.6   1.6441   5.7    6.1	Cen X-3
186.6405 -62.9000    4.1  36.1   74.5   1.3672   2.8    7.8	GX 301-2
184.2869 -20.6593    2.5  50.4   14.2   2.3689   4.6 ------	UNKNOWN
128.9717 -43.1877    1.4   2.1  -91.8   1.4316   8.1 ------	UNKNOWN
108.5398  -8.1598    3.4  41.4  -99.0   3.2690   3.4 ------	UNKNOWN
Pre-slew background subtracted image of 15-350 keV band
Time interval of the image:
-0.016000 10.756590

# RAcent  DECcent POSerr Theta    Phi  PeakCts   SNR AngSep     Name
#  [deg]    [deg]    ['] [deg]  [deg]                   [']
135.2617 -40.4934    0.0   5.9  -24.6  -0.0198  -0.5   12.7	Vela X-1
170.2986 -60.6201   51.8  28.1   72.5  -0.0155  -0.2    0.5	Cen X-3
186.5681 -62.7110   12.2  36.1   74.2   0.1044   0.9    4.3	GX 301-2
 80.3347 -58.5319    0.5  32.7  162.2   1.2691  22.6 ------	UNKNOWN
178.3507 -10.8029    2.2  53.4    0.2   0.6728   5.2 ------	UNKNOWN
154.6933 -12.4847    2.6  38.7  -25.1   0.2485   4.4 ------	UNKNOWN
Post-slew image of 15-350 keV band
Time interval of the image:
63.156600 962.143300

# RAcent  DECcent POSerr Theta    Phi  PeakCts   SNR AngSep     Name
#  [deg]    [deg]    ['] [deg]  [deg]                   [']
135.5238 -40.5596    1.0  38.6  -21.5   7.9844  11.4    0.4	Vela X-1
170.2994 -60.6170    4.7  41.9   24.2   2.5877   2.4    0.6	Cen X-3
186.6168 -62.7697 2700.0  46.2   33.9   0.0021   0.0    1.1	GX 301-2
203.4402 -68.1940    4.3  46.6   46.0   6.5978   2.7 ------	UNKNOWN
353.8721 -71.7460    3.7  34.9  104.5   4.1731   3.1 ------	UNKNOWN
  1.0725 -53.0828    2.9  42.2  132.8   7.3244   4.1 ------	UNKNOWN
128.9722 -43.1769    1.3  33.3  -24.3   5.4082   8.9 ------	UNKNOWN
 52.1975 -15.3860    2.6  48.0 -146.4   5.8411   4.4 ------	UNKNOWN
 75.0125 -15.0348    2.9  43.7 -116.1   8.8671   4.0 ------	UNKNOWN
Plot creation:
Sat May 30 19:19:28 EDT 2015