Special notes of this burst
Image
Pre-slew 15.0-350.0 keV image (Event data)
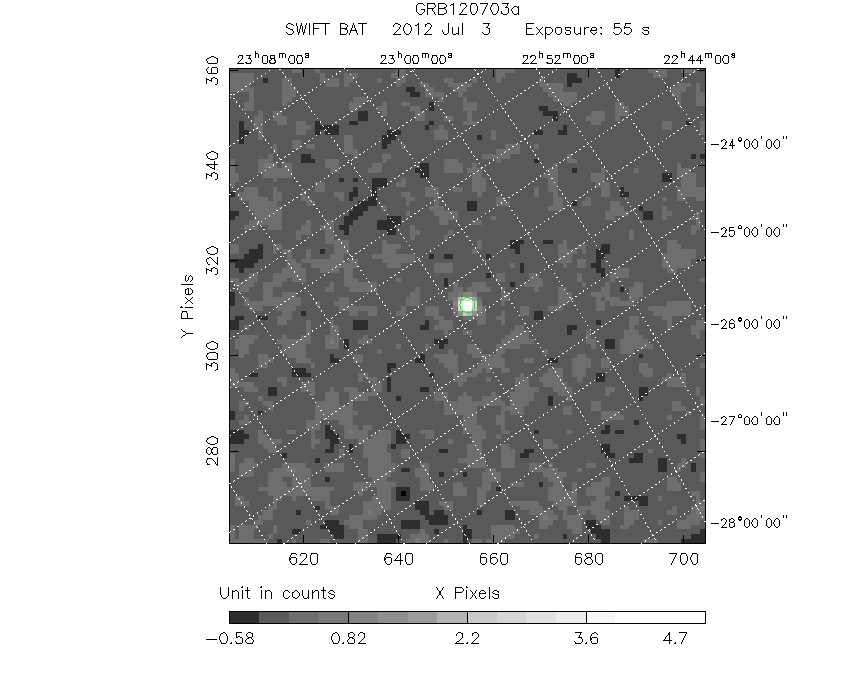
#   RAcent    DECcent   POSerr    Theta     Phi              Peak Cts       SNR   Name
  339.3530   -29.7236   0.0047    30.4418    36.3931         5.5163093     40.381 TRIG_00525671

Foreground time interval of the image:
-44.496  10.517 (delta_t =  55.013 [sec])
Background time interval of the image:
-239.584 -44.496 (delta_t = 195.088 [sec])
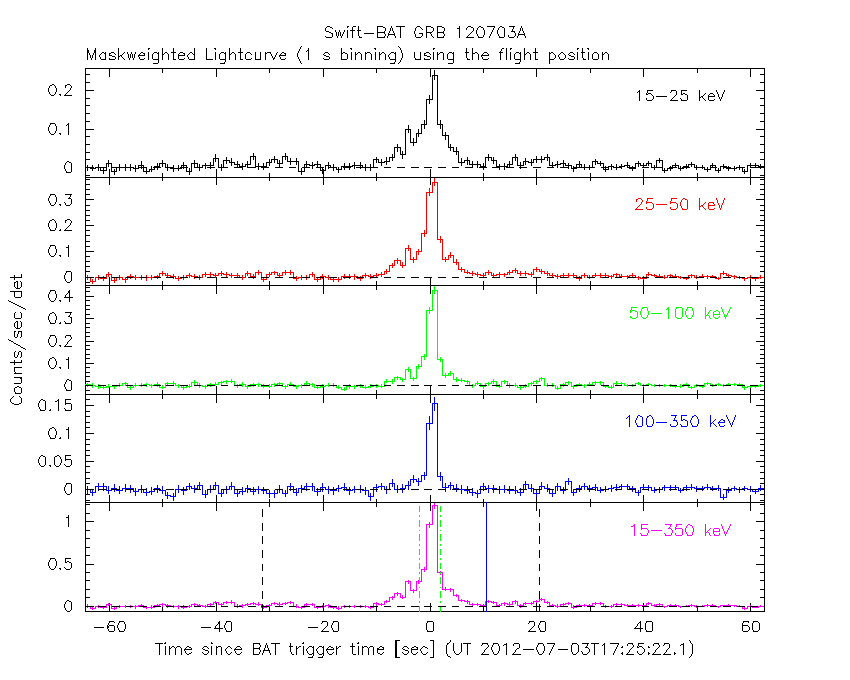
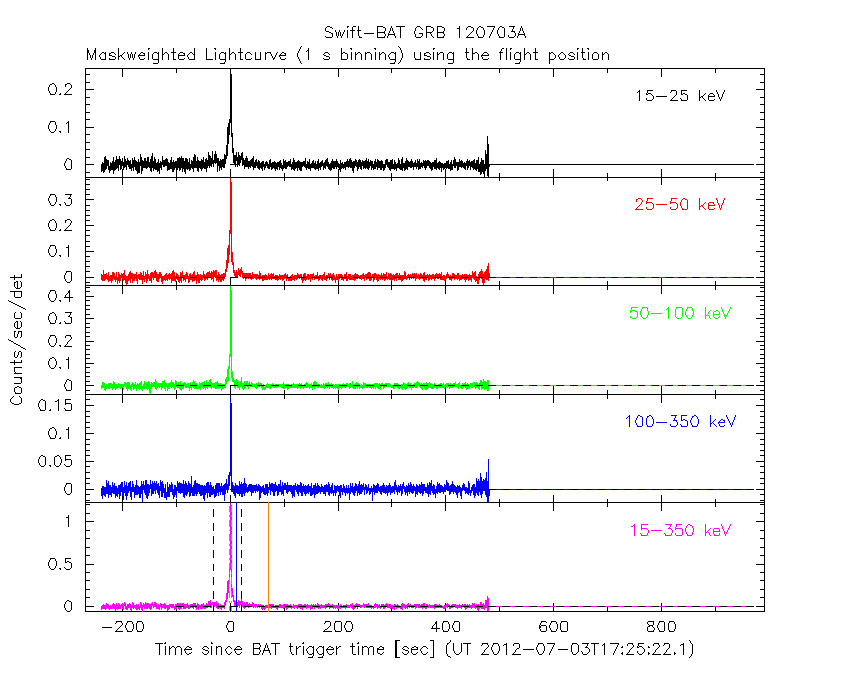
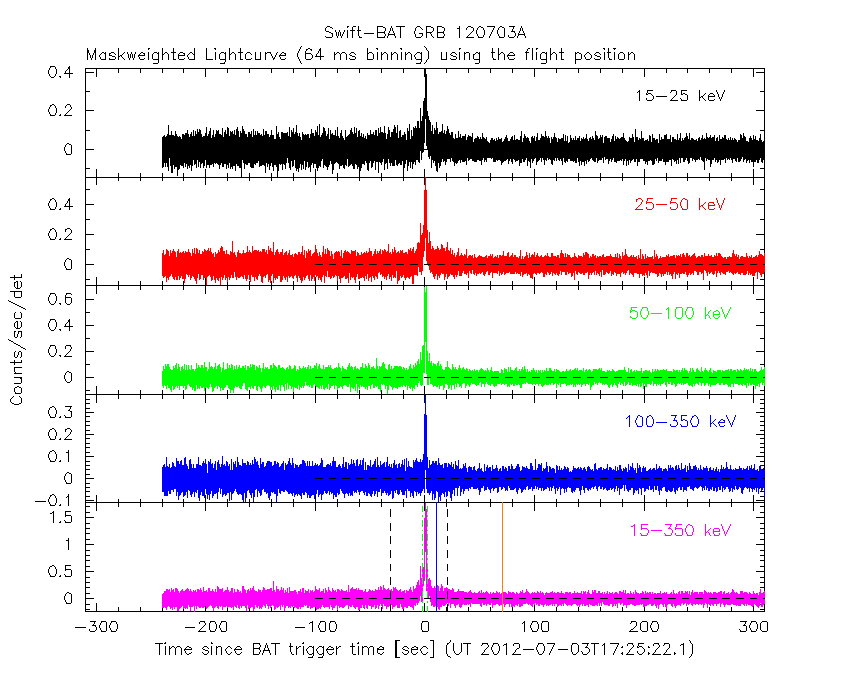
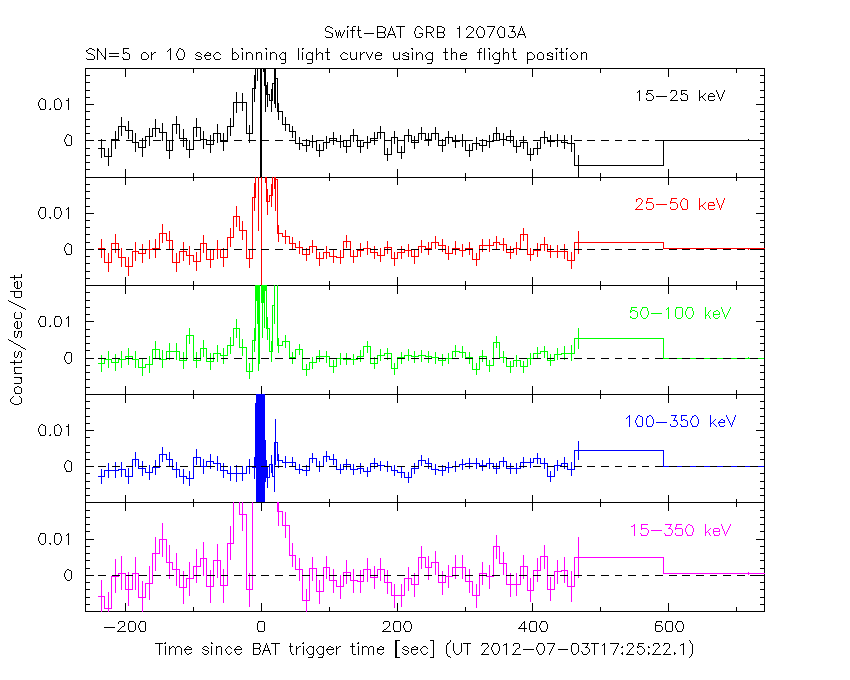
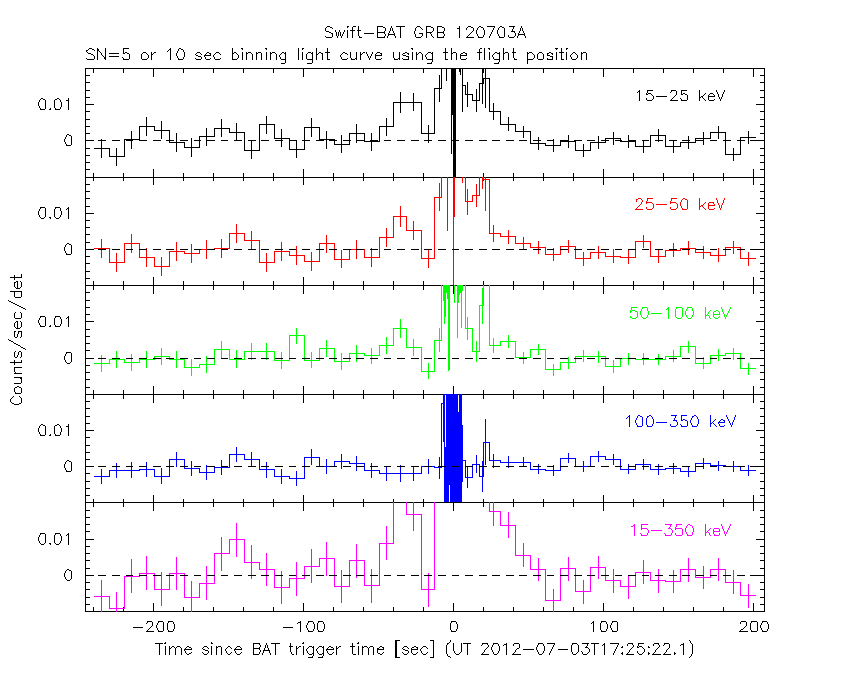
Lightcurves
Notes:
- 1) The mask-weighted light curves are using the flight position.
- 2) Multiple plots of different time binning/intervals are shown to cover all scenarios of short/long GRBs, rate/image triggers, and real/false positives.
- 3) For all the mask-weighted lightcurves, the y-axis units are counts/sec/det where a det is 0.4 x 0.4 = 0.16 sq cm.
- 4) The verticle lines correspond to following: green dotted lines are T50 interval, black dotted lines are T90 interval, blue solid line(s) is a spacecraft slew start time, and orange solid line(s) is a spacecraft slew end time.
- 5) Time of each bin is in the middle of the bin.
1 s binning
From T0-310 s to T0+310 s

From T100_start - 20 s to T100_end + 30 s
Full time interval
64 ms binning
Full time interval
From T100_start to T100_end
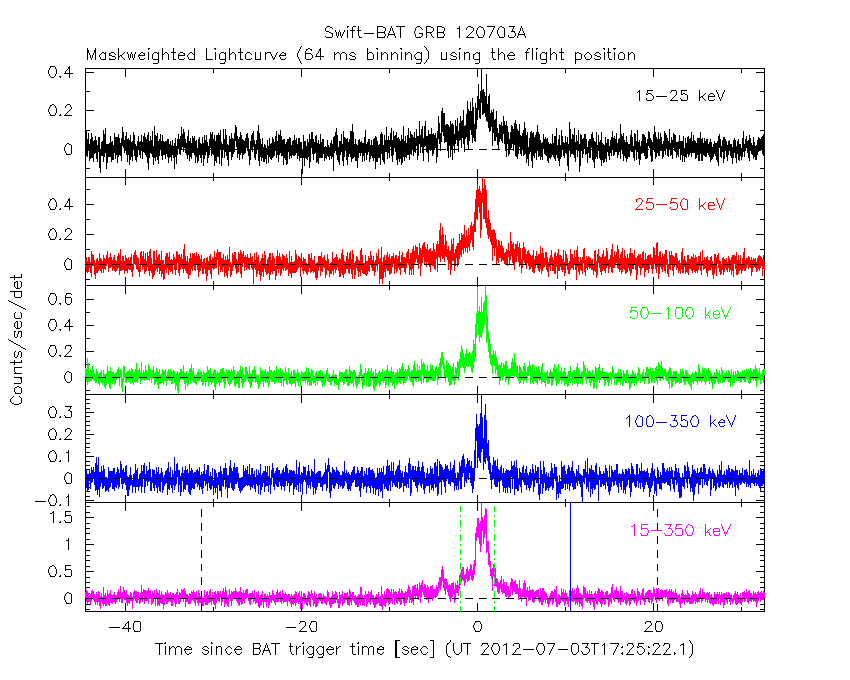
From T0-5 sec to T0+5 sec

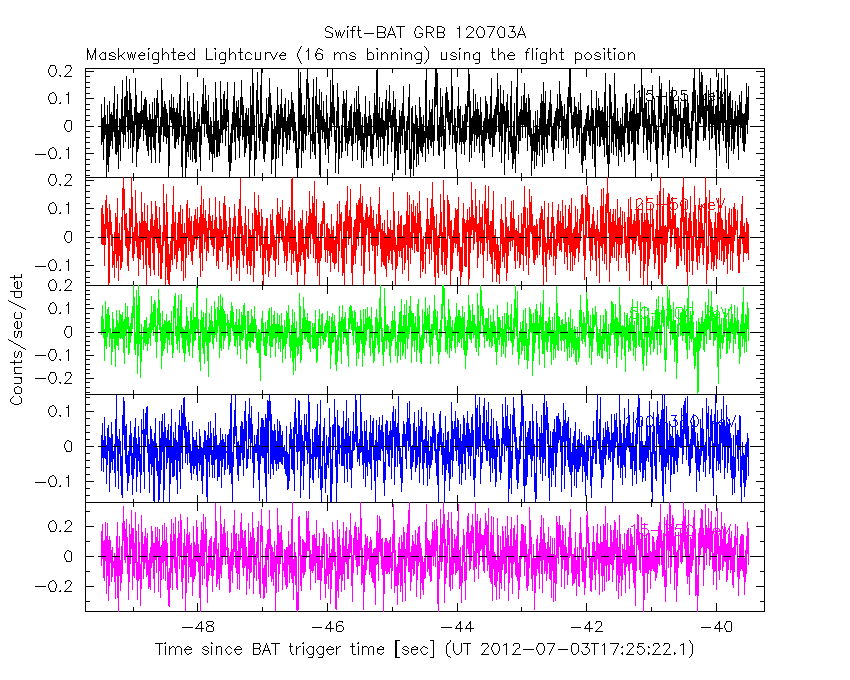
16 ms binning
From T100_start-5 s to T100_start+5 s
Blue+Cyan dotted lines: Time interval of the scaled map
From 0.000000 to 0.512000
8 ms binning
From T100_start-3 s to T100_start+3 s
Blue+Cyan dotted lines: Time interval of the scaled map
From 0.000000 to 0.512000
2 ms binning
From T100_start-1 s to T100_start+1 s
Blue+Cyan dotted lines: Time interval of the scaled map
From 0.000000 to 0.512000
SN=5 or 10 sec. binning (whichever binning is satisfied first)
SN=5 or 10 sec. binning (T < 200 sec)
Quad-rate summed light curves (from T0-300s to T0+1000s)

Spectral Evolution

Spectra
Notes:
- 1) The fitting includes the systematic errors.
- 2) When the burst includes telescope slew time periods, the fitting uses an average response file made from multiple 5-s response files through out the slew time plus single time preiod for the non-slew times, and weighted by the total counts in the corresponding time period using addrmf. An average response file is needed becuase a spectral fit using the pre-slew DRM will introduce some errors in both a spectral shape and a normalization if the PHA file contains a lot of the slew/post-slew time interval.
- 3) For fits to more complicated models (e.g. a power-law over a cutoff power-law), the BAT team has decided to require a chi-square improvement of more than 6 for each extra dof.
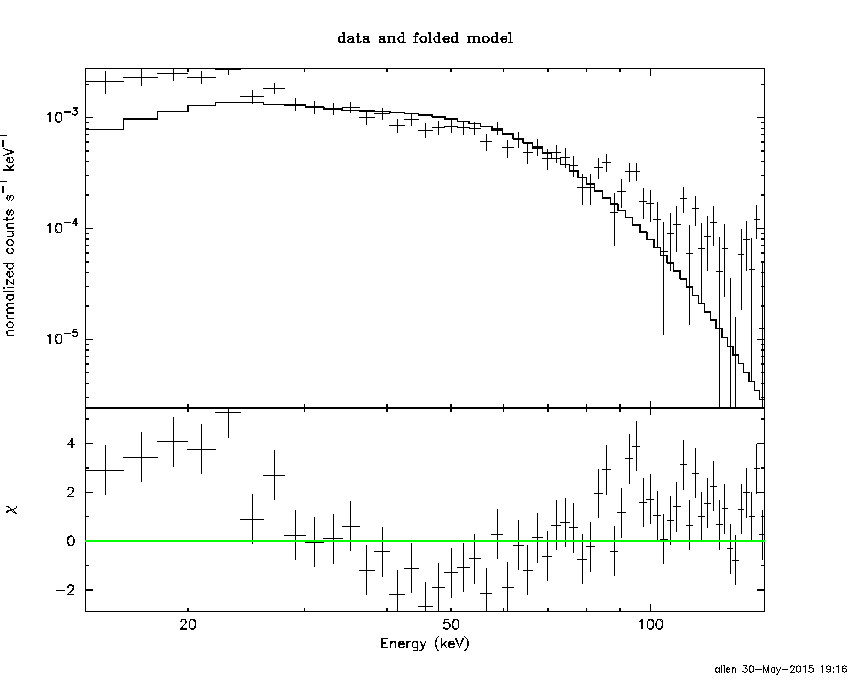
Time averaged spectrum fit using the average DRM
Power-law model
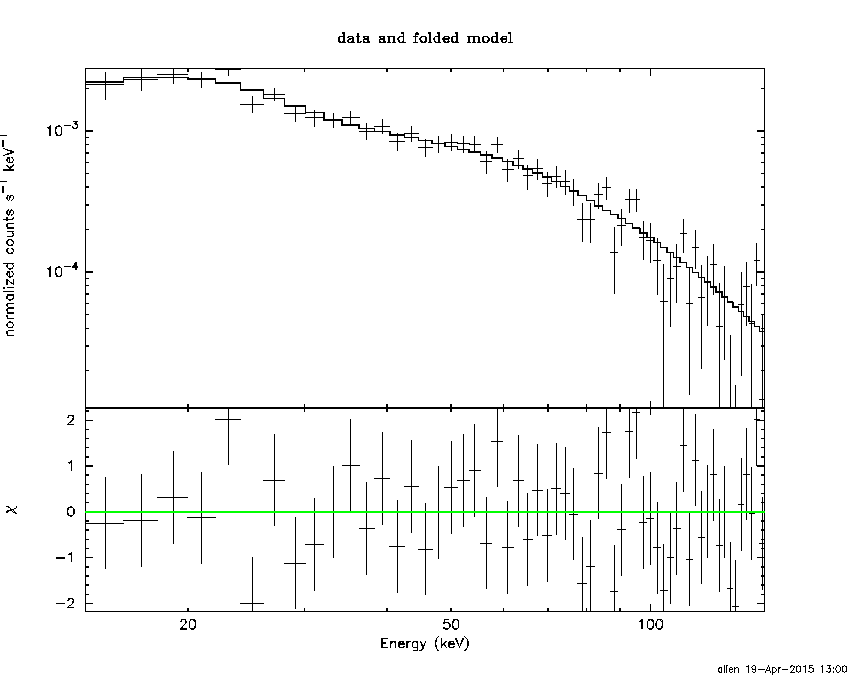
Time interval is from  -44.496 sec. to   32.604 sec.

Spectral model in power-law:
------------------------------------------------------------
Parameters  : value       lower 90%   higher 90%
Photon index: 1.59255     ( -0.0741211   0.0744869 )
Norm@50keV  : 5.24417E-03    ( -0.00020701   0.000206475 )
------------------------------------------------------------
#Fit statistic : Chi-Squared =          62.02 using 59 PHA bins.
# Reduced chi-squared =          1.088 for     57 degrees of freedom
# Null hypothesis probability =   3.017833e-01

Photon flux (15-150 keV)    in 77.1 sec: 0.672354 ( -0.0278374  0.0279529 ) ph/cm2/s
Energy fluence (15-150 keV)             : 3.78477e-06 ( -1.59459e-07  1.60269e-07 ) ergs/cm2
Cutoff power-law model

Time interval is from  -44.496 sec. to   32.604 sec.
Spectral model in the cutoff power-law:
------------------------------------------------------------
Parameters  : value       lower 90%   higher 90%
Photon index: 1.49133     ( -0.291992   0.140284 )
Epeak [keV] : 262.221      ( -262.221 -262.221 )
Norm@50keV  : 5.86711E-03    ( -0.000801758   0.00217128 )
------------------------------------------------------------
#Fit statistic : Chi-Squared =          61.64 using 59 PHA bins.
# Reduced chi-squared =          1.101 for     56 degrees of freedom
# Null hypothesis probability =   2.815039e-01

Photon flux (15-150 keV)    in 77.1 sec: 0.667516 ( -0.030542  0.030438 ) ph/cm2/s
Energy fluence (15-150 keV)             : 3.75669e-06 ( -1.79543e-07  1.77538e-07 ) ergs/cm2
Band function
Time interval is from  -44.496 sec. to   32.604 sec.

Spectral model in the Band function:
------------------------------------------------------------
Parameters  : value       lower 90%   higher 90%
alpha       : -1.50733   ( 1.35718   6.22638 )
beta        : -2.86407    ( 8.77715   18.1811 )
Epeak [keV] : 307.015      ( -147.25 -306.36 )
Norm@50keV   : 5.75691E-03    ( -0.000474296   0.000274655 )
------------------------------------------------------------
#Fit statistic : Chi-Squared =          61.65 using 59 PHA bins.
# Reduced chi-squared =          1.121 for     55 degrees of freedom
# Null hypothesis probability =   2.504011e-01

Photon flux (15-150 keV)    in 77.1 sec:  (    ) ph/cm2/s
Energy fluence (15-150 keV)             : 0 ( 0  0 ) ergs/cm2
Single BB
Spectral model blackbody:
------------------------------------------------------------
Parameters  : value    Lower 90%  Upper 90%
kT [keV]    : 15.2481  (  )
R^2/D10^2   : 6.76261E-02  (   )
(R is the radius in km and D10 is the distance to the source in units of 10 kpc)
------------------------------------------------------------
#Fit statistic : Chi-Squared =         215.37 using 59 PHA bins.
# Reduced chi-squared =         3.7785 for     57 degrees of freedom
# Null hypothesis probability =   3.051232e-20

Energy  Fluence     90% Error
[keV]   [erg/cm2]   [erg/cm2]
15- 25  2.531e-07   1.862e-08
25- 50  1.021e-06   5.397e-08
50-150  1.627e-06   1.280e-07
15-150  2.901e-06   1.249e-07
Thermal bremsstrahlung (OTTB)

Spectral model: thermal bremsstrahlung
------------------------------------------------------------
Parameters  : value         Lower 90%    Upper 90%
kT [keV]    : 197.530       (-40.8154      -197.494)
Norm        : 2.70159       (-0.106406     0.12143)
------------------------------------------------------------
#Fit statistic : Chi-Squared =          63.41 using 59 PHA bins.
# Reduced chi-squared =          1.112 for     57 degrees of freedom
# Null hypothesis probability =   2.607027e-01

Energy  Fluence     90% Error
[keV]   [erg/cm2]   [erg/cm2]
15- 25  5.193e-07   3.080e-08
25- 50  9.978e-07   8.096e-08
50-150  2.182e-06   5.123e-07
15-150  3.699e-06   5.698e-07
Double BB

Spectral model: bbodyrad<1> + bbodyrad<2>
------------------------------------------------------------
Parameters  : value         Lower 90%    Upper 90%
kT1 [keV]   : 6.14623        (-0.939119      1.08687)
R1^2/D10^2  : 1.12025        (-0.498589      1.03107)
kT2 [keV]   : 24.1244        (-2.7009      3.81859)
R2^2/D10^2  : 1.11369E-02    (-0.00466452   0.00626244)
------------------------------------------------------------
#Fit statistic : Chi-Squared =          68.69 using 59 PHA bins.
# Reduced chi-squared =          1.249 for     55 degrees of freedom
# Null hypothesis probability =   1.014791e-01

Energy  Fluence     90% Error
[keV]   [erg/cm2]   [erg/cm2]
15- 25  5.369e-07   7.733e-08
25- 50  9.635e-07   9.946e-08
50-150  2.182e-06   2.552e-07
15-150  3.682e-06   3.354e-07
Peak spectrum fit
Power-law model
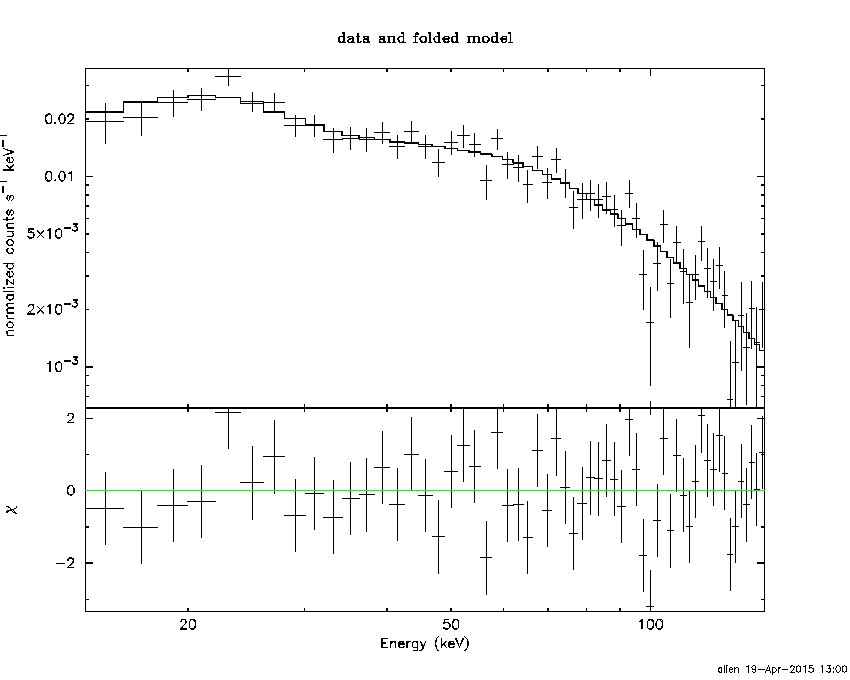
Time interval is from    0.056 sec. to    1.056 sec.

Spectral model in power-law:
------------------------------------------------------------
Parameters  : value       lower 90%   higher 90%
Photon index: 1.06227     ( -0.0687323   0.0684052 )
Norm@50keV  : 9.10964E-02    ( -0.00349049   0.00348844 )
------------------------------------------------------------
#Fit statistic : Chi-Squared =          65.58 using 59 PHA bins.
# Reduced chi-squared =          1.151 for     57 degrees of freedom
# Null hypothesis probability =   2.036900e-01

Photon flux (15-150 keV)    in 1 sec: 10.5313 ( -0.412486  0.41291 ) ph/cm2/s
Energy fluence (15-150 keV)             : 9.64224e-07 ( -4.11749e-08  4.1259e-08 ) ergs/cm2
Cutoff power-law model

Time interval is from    0.056 sec. to    1.056 sec.
Spectral model in the cutoff power-law:
------------------------------------------------------------
Parameters  : value       lower 90%   higher 90%
Photon index: 1.05686     ( -0.220036   0.0988122 )
Epeak [keV] : 9998.39      (   )
Norm@50keV  : 9.16121E-02    ( -0.00349531   0.0285527 )
------------------------------------------------------------
#Fit statistic : Chi-Squared =          65.58 using 59 PHA bins.
# Reduced chi-squared =          1.171 for     56 degrees of freedom
# Null hypothesis probability =   1.786809e-01

Photon flux (15-150 keV)    in 1 sec: 10.5267 ( -0.4106  0.4135 ) ph/cm2/s
Energy fluence (15-150 keV)             : 9.66043e-07 ( -3.6871e-08  3.9787e-08 ) ergs/cm2
Band function

Time interval is from    0.056 sec. to    1.056 sec.

Spectral model in the Band function:
------------------------------------------------------------
Parameters  : value       lower 90%   higher 90%
alpha       : 3.37251   ( -3.59019   -3.59019 )
beta        : -1.08989    ( -0.0789298   0.0808638 )
Epeak [keV] : 27.3945      ( -27.1034 159.276 )
Norm@50keV   : 267.633    ( -266.599   1730.18 )
------------------------------------------------------------
#Fit statistic : Chi-Squared =          64.07 using 59 PHA bins.
# Reduced chi-squared =          1.165 for     55 degrees of freedom
# Null hypothesis probability =   1.882849e-01

Photon flux (15-150 keV)    in 1 sec:  (    ) ph/cm2/s
Energy fluence (15-150 keV)             : 0 ( 0  0 ) ergs/cm2
Single BB

Spectral model blackbody:
------------------------------------------------------------
Parameters  : value    Lower 90%  Upper 90%
kT [keV]    : 21.2571  (  )
R^2/D10^2   : 0.412288  (   )
(R is the radius in km and D10 is the distance to the source in units of 10 kpc)
------------------------------------------------------------
#Fit statistic : Chi-Squared =         205.90 using 59 PHA bins.
# Reduced chi-squared =         3.6122 for     57 degrees of freedom
# Null hypothesis probability =   1.027331e-18

Energy  Fluence     90% Error
[keV]   [erg/cm2]   [erg/cm2]
15- 25  3.501e-08   2.730e-09
25- 50  1.813e-07   9.950e-09
50-150  6.112e-07   4.125e-08
15-150  8.276e-07   4.170e-08
Thermal bremsstrahlung (OTTB)
Spectral model: thermal bremsstrahlung
------------------------------------------------------------
Parameters  : value         Lower 90%    Upper 90%
kT [keV]    : 199.363       (      )
Norm        : 42.7733       (     )
------------------------------------------------------------
#Fit statistic : Chi-Squared =         204.87 using 59 PHA bins.
# Reduced chi-squared =         3.5942 for     57 degrees of freedom
# Null hypothesis probability =   1.497006e-18

Energy  Fluence     90% Error
[keV]   [erg/cm2]   [erg/cm2]
15- 25  1.065e-07   4.150e-09
25- 50  2.049e-07   9.000e-09
50-150  4.493e-07   2.075e-08
15-150  7.607e-07   3.095e-08
Double BB

Spectral model: bbodyrad<1> + bbodyrad<2>
------------------------------------------------------------
Parameters  : value         Lower 90%    Upper 90%
kT1 [keV]   : 8.26538        (-1.33837      1.60699)
R1^2/D10^2  : 4.79391        (-1.94117      3.62508)
kT2 [keV]   : 36.8027        (-5.38758      9.4187)
R2^2/D10^2  : 6.38296E-02    (-0.0312714   0.0413936)
------------------------------------------------------------
#Fit statistic : Chi-Squared =          69.04 using 59 PHA bins.
# Reduced chi-squared =          1.255 for     55 degrees of freedom
# Null hypothesis probability =   9.652588e-02

Energy  Fluence     90% Error
[keV]   [erg/cm2]   [erg/cm2]
15- 25  7.244e-08   1.125e-08
25- 50  1.908e-07   2.175e-08
50-150  7.082e-07   1.014e-07
15-150  9.715e-07   1.211e-07
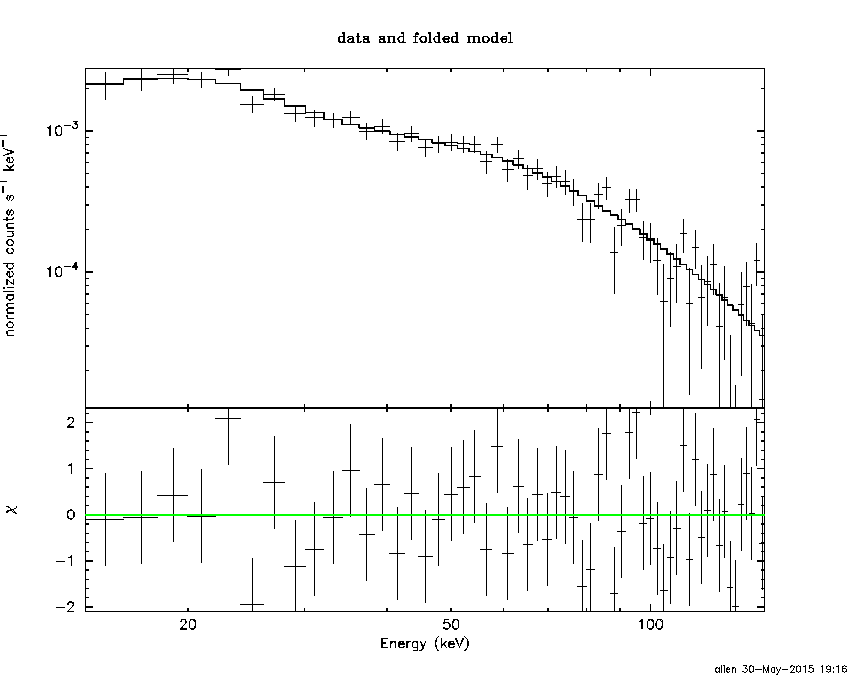
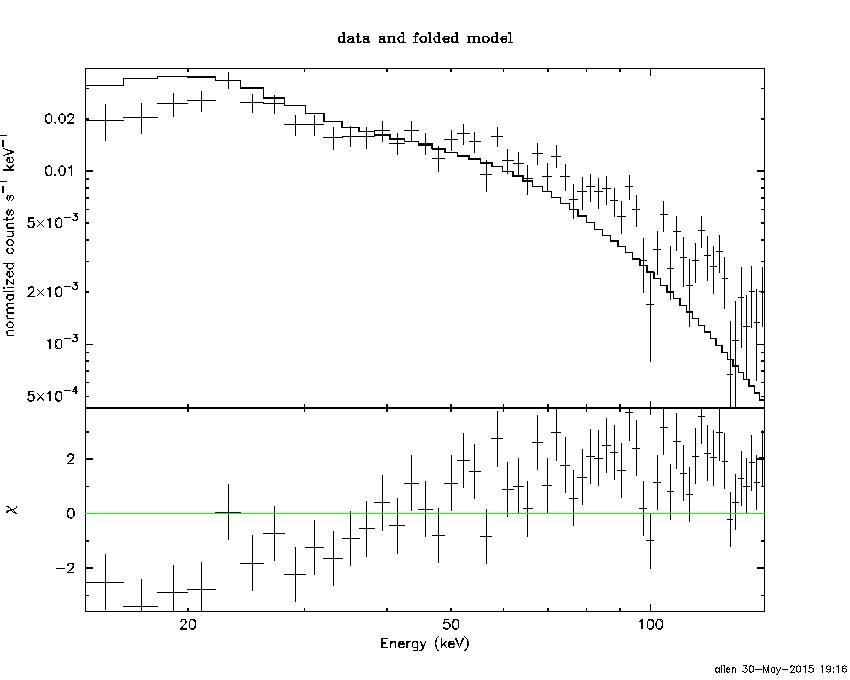
Pre-slew spectrum (Pre-slew PHA with pre-slew DRM)
Power-law model

Spectral model in power-law:
------------------------------------------------------------
Parameters  : value       lower 90%   higher 90%
Photon index: 1.53953     ( -0.0726698   0.0729421 )
Norm@50keV  : 6.62224E-03    ( -0.000254058   0.000253676 )
------------------------------------------------------------
#Fit statistic : Chi-Squared =          55.37 using 59 PHA bins.
# Reduced chi-squared =         0.9713 for     57 degrees of freedom
# Null hypothesis probability =   5.366351e-01

Photon flux (15-150 keV)    in 55.01 sec: 0.835819 ( -0.0340315  0.0341747 ) ph/cm2/s
Energy fluence (15-150 keV)             : 3.43467e-06 ( -1.41592e-07  1.42249e-07 ) ergs/cm2
Cutoff power-law model

Spectral model in the cutoff power-law:
------------------------------------------------------------
Parameters  : value       lower 90%   higher 90%
Photon index: 1.47478     ( -0.28057   0.109581 )
Epeak [keV] : 432.317      ( -432.317 -432.317 )
Norm@50keV  : 7.10626E-03    ( -0.000704664   0.00245518 )
------------------------------------------------------------
#Fit statistic : Chi-Squared =          55.20 using 59 PHA bins.
# Reduced chi-squared =         0.9857 for     56 degrees of freedom
# Null hypothesis probability =   5.052482e-01

Photon flux (15-150 keV)    in 55.01 sec: 0.831915 ( -0.037286  0.036661 ) ph/cm2/s
Energy fluence (15-150 keV)             : 3.42007e-06 ( -1.57065e-07  1.52823e-07 ) ergs/cm2
Band function

Spectral model in the Band function:
------------------------------------------------------------
Parameters  : value       lower 90%   higher 90%
alpha       : -1.47535   ( 1.29616   1.29616 )
beta        : -4.83001    ( 3.61703   13.617 )
Epeak [keV] : 432.934      ( -432.934 -432.934 )
Norm@50keV   : 7.10346E-03    ( -0.000269189   0.00214336 )
------------------------------------------------------------
#Fit statistic : Chi-Squared =          55.20 using 59 PHA bins.
# Reduced chi-squared =          1.004 for     55 degrees of freedom
# Null hypothesis probability =   4.671809e-01

Photon flux (15-150 keV)    in 55.01 sec:  (    ) ph/cm2/s
Energy fluence (15-150 keV)             : 0 ( 0  0 ) ergs/cm2
S(25-50 keV) vs. S(50-100 keV) plot
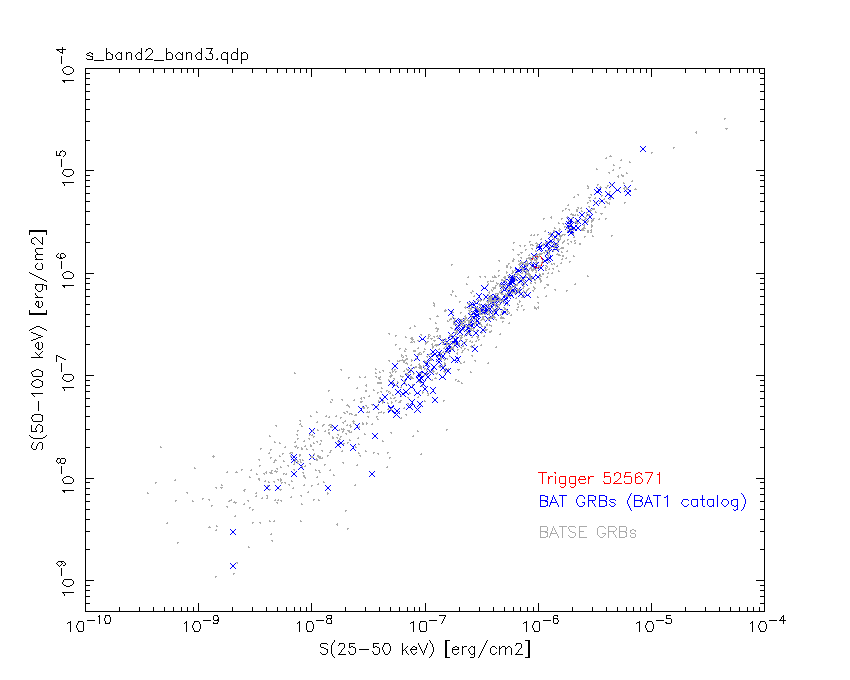
S(25-50 keV)  = 9.78e-07
S(50-100 keV) = 1.30e-06
T90 vs. Hardness ratio plot

T90                                   = 51.7039999961853 sec.
Hardness ratio (energy fluence ratio) = 1.32924
Color vs. Color plot
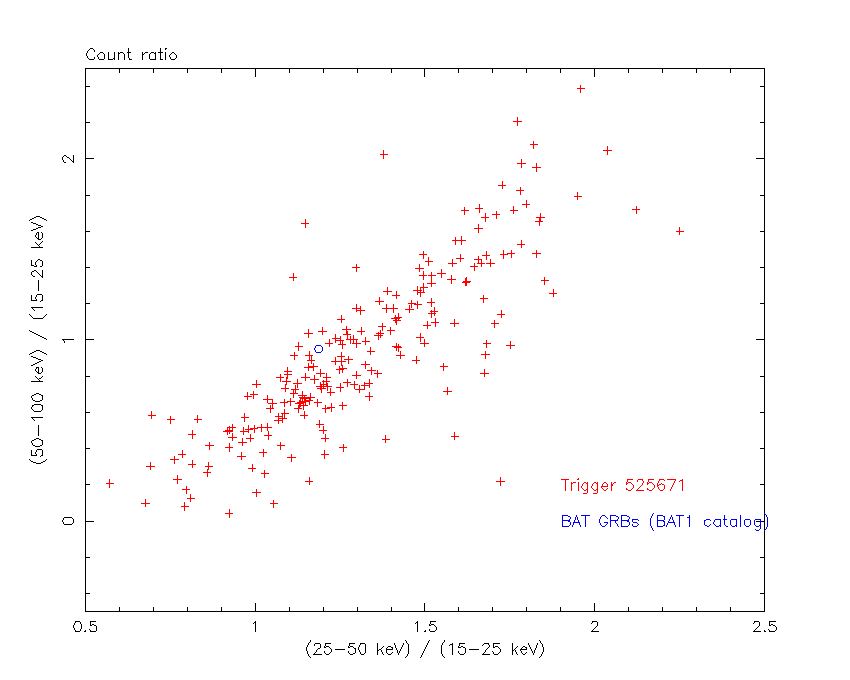
Count Ratio  (25-50 keV) / (15-25 keV) = 1.18662
Count Ratio (50-100 keV) / (15-25 keV) = 0.950583
Mask shadow pattern
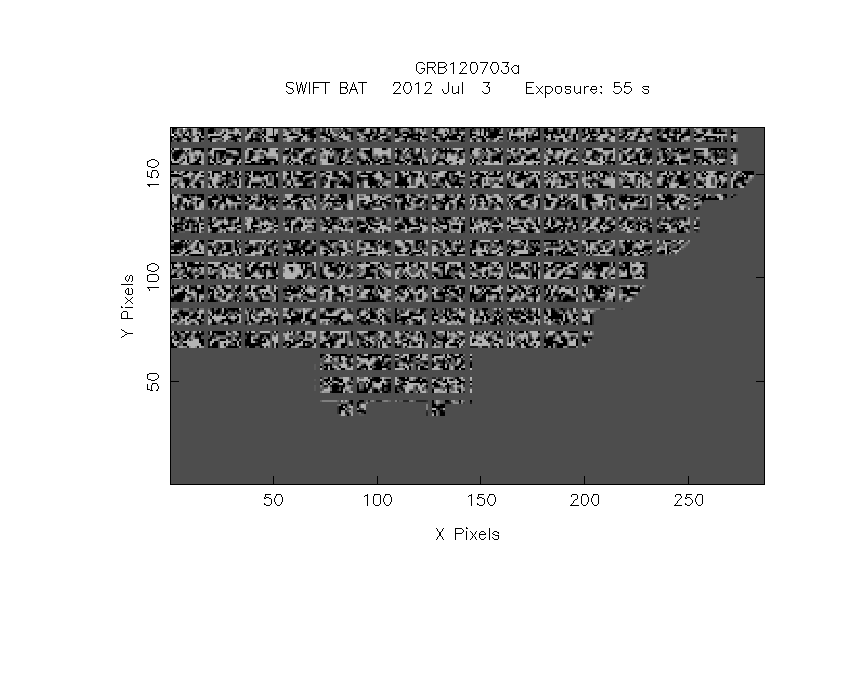
IMX = 4.730598618759329E-01, IMY = -3.486816869462041E-01
TIME vs. PHA plot around the trigger time
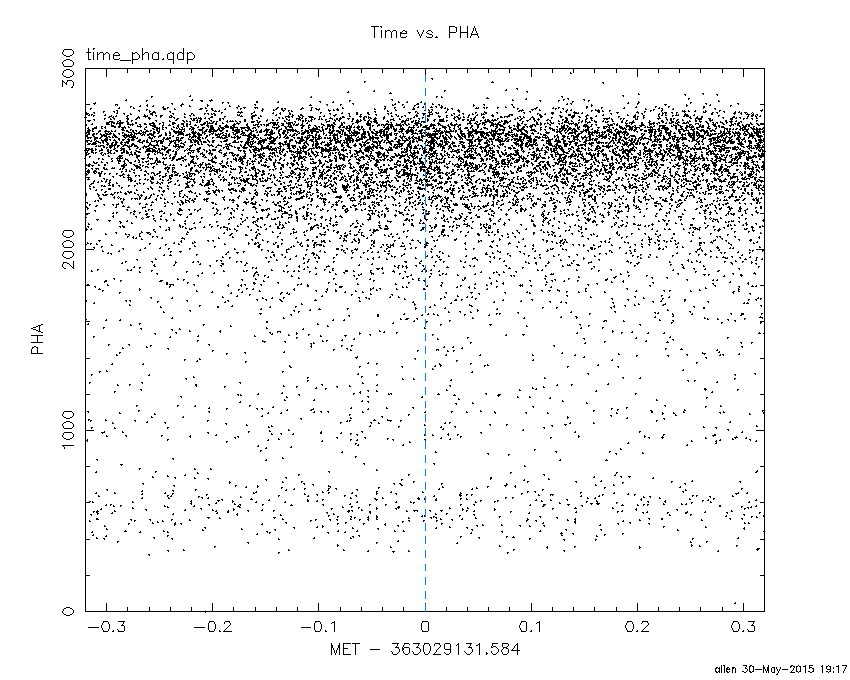
Blue+Cyan dotted lines: Time interval of the scaled map
From 0.000000 to 0.512000
TIME vs. DetID plot around the trigger time

Blue+Cyan dotted lines: Time interval of the scaled map
From 0.000000 to 0.512000
100 us light curve (15-350 keV)
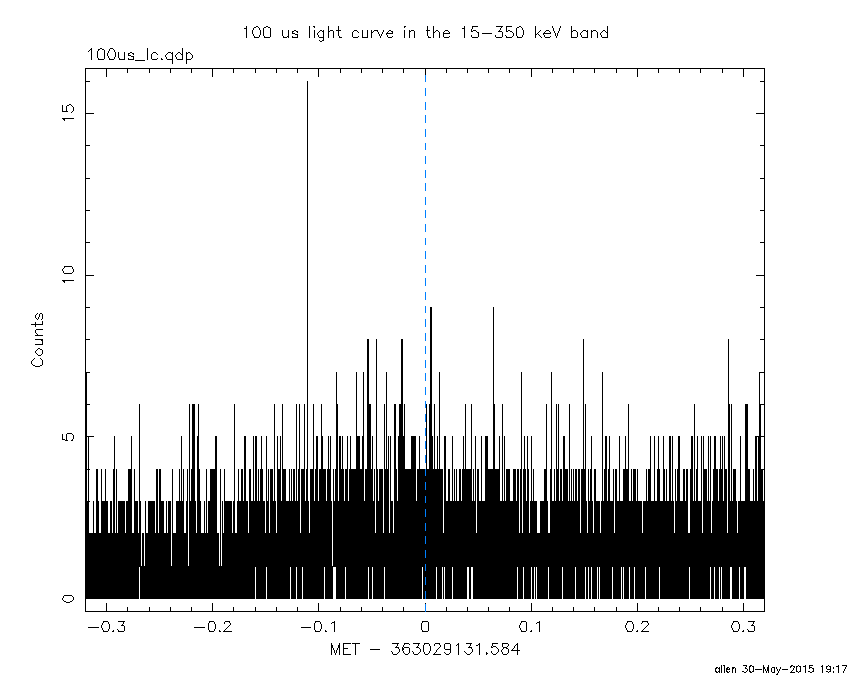
Blue+Cyan dotted lines: Time interval of the scaled map
From 0.000000 to 0.512000
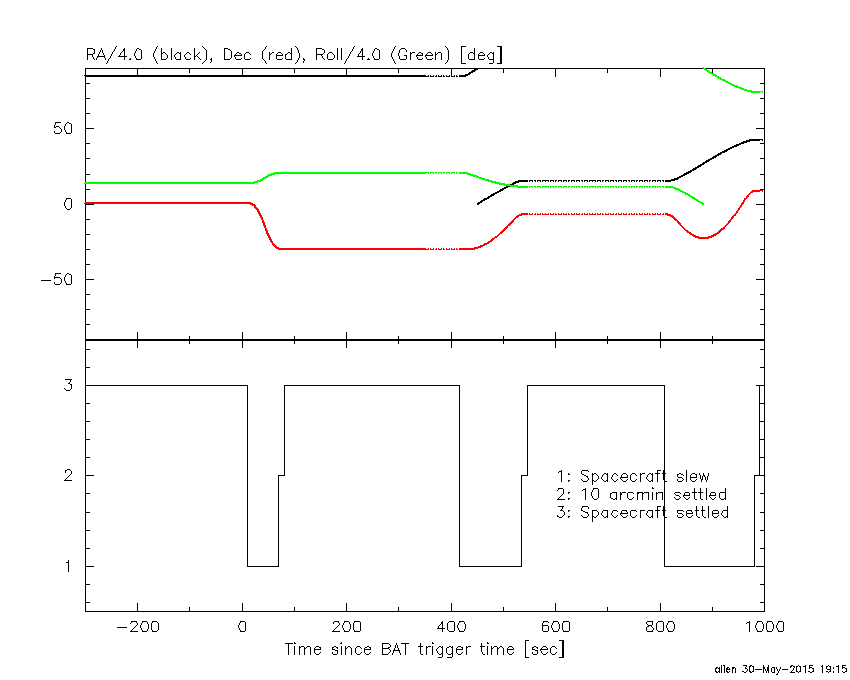
Spacecraft aspect plot
Bright source in the pre-burst/pre-slew/post-slew images
Pre-burst image of 15-350 keV band
Time interval of the image:
-239.584000 -44.496000

# RAcent  DECcent POSerr Theta    Phi  PeakCts   SNR AngSep     Name
#  [deg]    [deg]    ['] [deg]  [deg]                   [']
299.5952  35.1659    4.9  51.4  170.9   1.3651   2.4    2.2	Cyg X-1
308.1895  41.0290    7.2  49.9 -177.7   0.6495   1.6    5.8	Cyg X-3
326.2617  38.4188    9.6  40.0 -163.4   0.2920   1.2    7.2	Cyg X-2
297.4891   1.8309    2.4  43.1  126.2   3.3418   4.9 ------	UNKNOWN
325.5066  17.2307    2.9  22.2  173.1   0.6468   4.0 ------	UNKNOWN
 27.5421 -29.6020    2.3  54.0  -17.5   2.3665   5.0 ------	UNKNOWN
323.5791  56.8859    2.8  57.8 -156.7   4.1340   4.1 ------	UNKNOWN
 30.6366  -8.3051    2.5  50.6  -44.4   4.1605   4.6 ------	UNKNOWN
Pre-slew background subtracted image of 15-350 keV band
Time interval of the image:
-44.496000 10.516610

# RAcent  DECcent POSerr Theta    Phi  PeakCts   SNR AngSep     Name
#  [deg]    [deg]    ['] [deg]  [deg]                   [']
299.5276  35.1214    8.2  51.4  170.8   0.4650   1.4    5.7	Cyg X-1
308.3472  40.9218    0.0  49.7 -177.7  -0.1291  -0.5   10.9	Cyg X-3
325.9973  38.4052    4.5  40.0 -163.7  -0.3661  -2.6    9.6	Cyg X-2
292.9305  15.8612    2.4  49.4  144.7   2.2940   4.7 ------	UNKNOWN
339.3530 -29.7236    0.3  30.4   36.4   5.5164  40.4 ------	UNKNOWN
 31.8781 -27.3290    2.5  56.6  -21.9   1.7494   4.6 ------	UNKNOWN
Post-slew image of 15-350 keV band
Time interval of the image:
70.516600 416.516600

# RAcent  DECcent POSerr Theta    Phi  PeakCts   SNR AngSep     Name
#  [deg]    [deg]    ['] [deg]  [deg]                   [']
343.4090 -50.4937    2.3  21.0   -0.8   1.1676   5.0 ------	UNKNOWN
Plot creation:
Sat May 30 19:17:30 EDT 2015